
Rationale and Objectives
To assess the performance of an experimental prototype dual-energy (DE) chest imaging system in comparison to digital radiography (DR) in detection and characterization of lung lesions using receiver-operating characteristic (ROC) tests.
Materials and Methods
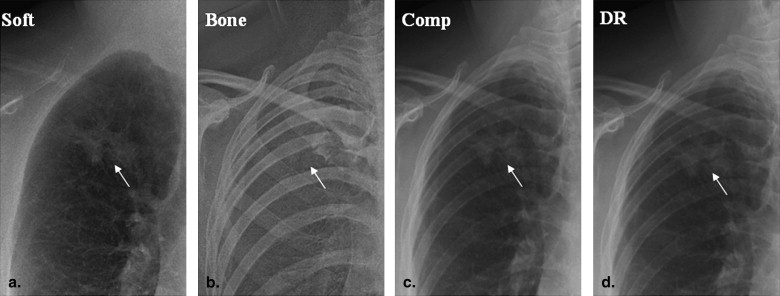
A cohort of 129 patients (80 M, 49 F; mean age, 64.8 years) was drawn from a trial of patients referred for percutaneous biopsy of a lung lesion. DR and DE images were acquired of each patient (posteroanterior view) before biopsy using a prototype system developed in our laboratory. The system incorporated a flat-panel detector and previously reported imaging techniques optimized such that the total dose for the DE image was equivalent to that of a DR acquisition. Each DE image was decomposed to three components (soft-tissue, bone, and composite “equivalent radiograph”) by log subtraction with optimized noise reduction techniques. ROC tests were performed to evaluate the diagnostic performance of DR imaging in comparison to DE for nodule detection, with 258 left/right “half-chest” images derived from the 129 cases to give a roughly equal number of disease and normal cases. Five chest radiologists scored 258 half-chest DE and 258 half-chest DR (516 in total) images on a 5-point scale, and results (including ROC and area under the curve [AUC]) were analyzed using the ROCkit toolkit. Statistical significance in the observed differences was evaluated in terms of P values determined by a z test. Performance was analyzed for all cases pooled (258 DE vs. 258 DR images) and by retrospective stratification of the data according to nodule size, density, gender, lung region, and chest thickness.
Results
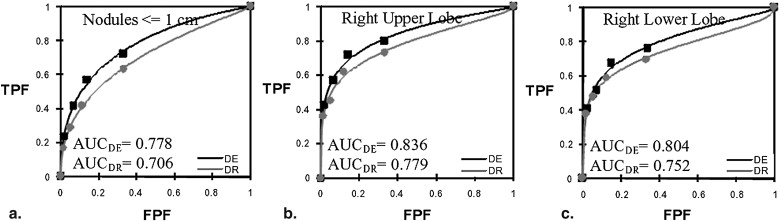
For results pooled over the entire cohort, there was no significant difference in ROC performance between DE and DR (AUC DE = 0.795 AUC DR = 0.789; P = .696). This finding is believed to be due to a large portion of lesions that were fairly conspicuous in either modality. In retrospective analysis of subgroups, a significant advantage was measured for DE imaging of small nodules (<1 cm diameter; AUC DE = 0.778; AUC DR = 0.706; P = .056), for nodules located in the right upper lobe (AUC DE = 0.836; AUC DR = 0.779; P = .003), and nodules located in right lower lobe (AUC DE = 0.804; AUC DR = 0.752; P = .054). DE imaging provided a clinically significant differential diagnosis in approximately one third of patients (49/158) (ie, disease cases in which the lesion was correctly identified in DE [(ROC rating ≥3], but missed in DR [ROC rating ≤2]). DE imaging also appeared to provide more definitive diagnosis (ie, a greater proportion of ROC ratings = 5 and 1 for identification of disease and normal cases, respectively), which presumably translates to increased confidence and a steeper ROC curve (even if the AUC are the same).
Conclusions
DE imaging at dose equivalent to DR exhibited similar overall ROC performance to DR, although the radiologists noted qualitatively improved visualization (eg, improved characterization of lesion margins, visibility of calcifications and rib fractures). DE imaging demonstrated significant improvement in diagnostic performance for specific subgroups, including subcentimeter lung lesions and lesions in the right upper lobe, each of which is a potentially important factor in detecting early-stage malignancy.
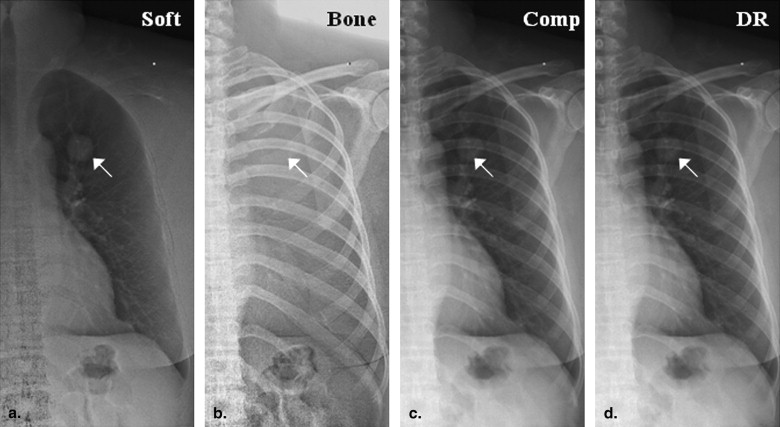
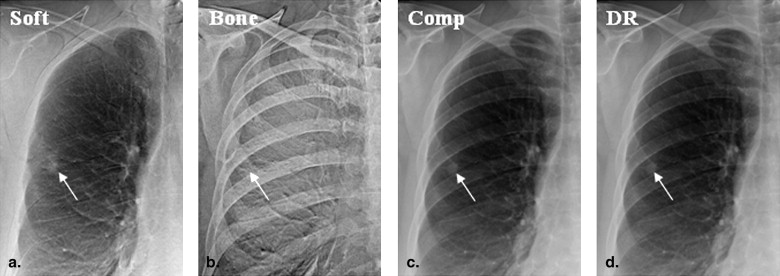
Chest radiography (CXR) presents a low-cost, low radiation dose modality that remains the mainstay of noninvasive examination and diagnosis of chest pathologies in large health centers and rural hospitals alike. Because CXR lacks sensitivity in the detection of small lung nodules, it is unsuitable for screening purposes . Technical advances in digital radiography (DR) have yielded remarkable improvements in diagnostic quality through the introduction of high-performance flat-panel detectors (FPDs) and computed radiography (CR) . Still, the fundamental limitation to diagnostic performance remains the compression of three-dimensional anatomy into a two-dimensional projection image , with the visual clutter associated with superimposed structures believed to be a major limiting factor. Dual-energy (DE) imaging mitigates this limitation in part by acquiring low- and high-energy projections from which soft-tissue and bone images are decomposed, the former presenting soft-tissue anatomy free from obscuration of superimposed bony anatomy (eg, ribs and clavicles) and the latter permitting clear visualization of bones and calcifications.
Commercially available DE imaging systems include storage phosphor and FPD designs . Single-shot DE imaging involves two CR storage phosphors as front and back detectors separated by an intermediate filter, (eg, FCR XU-D1; Fujifilm, Tokyo, Japan) with the image produced by the front plate representing a low-energy image and that by the back plate a high-energy image. As detailed in the following section, soft-tissue and bone images are decomposed from these low- and high-energy images using various subtraction algorithms. Double-shot DE images are generated using two x-ray exposures at two kVp settings (eg, XQ/I Revolution, GE Healthcare, Chalfont St. Giles, UK) with the advantage of improved energy separation (and, therefore, contrast-to-noise ratio) and the potential disadvantage of motion artifacts, even for FPDs with rapid readout .
Get Radiology Tree app to read full this article<
Get Radiology Tree app to read full this article<
Materials and methods
DE Imaging System
Get Radiology Tree app to read full this article<
Get Radiology Tree app to read full this article<
ln(IDEsoft)=ln(IH)−wsln(IL) ln
(
I
s
o
f
t
D
E
)
=
ln
(
I
H
)
−
w
s
ln
(
I
L
)
ln(IDEbone)=−ln(IH)+wbln(IL) ln
(
I
b
o
n
e
D
E
)
=
−
ln
(
I
H
)
+
w
b
ln
(
I
L
)
ln(IDEcomp)=ln(IH)+wcln(IL) ln
(
I
c
o
m
p
D
E
)
=
ln
(
I
H
)
+
w
c
ln
(
I
L
)
Get Radiology Tree app to read full this article<
Get Radiology Tree app to read full this article<
Get Radiology Tree app to read full this article<
Patient Cohort
Get Radiology Tree app to read full this article<
Observer Study
Get Radiology Tree app to read full this article<
Get Radiology Tree app to read full this article<
Get Radiology Tree app to read full this article<
Get Radiology Tree app to read full this article<
Table 1
Five-point Rating Scale for Receiver-Operating Characteristic Studies
Receiver-Operating Characteristic Rating Scale 1 Definitely normal (or almost definitely normal) 2 Probably normal 3 Possibly abnormal 4 Probably abnormal 5 Definitely abnormal (or almost definitely abnormal)
Get Radiology Tree app to read full this article<
Get Radiology Tree app to read full this article<
ROC Analysis
ROC curves and area under the curve (AUC)
Get Radiology Tree app to read full this article<
a=(μ1−μ0)/σ1 a
=
(
μ
1
−
μ
0
)
/
σ
1
b=σ0/σ1 b
=
σ
0
/
σ
1
Get Radiology Tree app to read full this article<
Get Radiology Tree app to read full this article<
Comparing two ROC curves
Get Radiology Tree app to read full this article<
Z=(A1−A2)/SE(A1−A2) Z
=
(
A
1
−
A
2
)
/
SE
(
A
1
−
A
2
)
Get Radiology Tree app to read full this article<
Get Radiology Tree app to read full this article<
Stratification of the results
Get Radiology Tree app to read full this article<
Table 2
Summary of Cases Overall and within Each Post-hoc Stratification
Cases Stratification Description DE DR How Determined Pooled All cases 258 258 N/A Lesion size Mass (>3 cm) 44 44 Maximum linear dimension measured in CT Nodule (≤3 cm) 114 114 Nodule (≤1 cm) 18 18 Lesion density Solid (≥20 HU) 128 128 Mean HU measured in CT Non-solid (<20 HU) 30 30 Chest thickness Large (>26 cm) 68 68 AP distance (T9-xiphoid) measured in axial CT Average (≤26 cm) 190 190 Lesion location Right-upper lobe 48 48 Belonging to a given anatomical region as visualized in CT Left-upper lobe 29 29 Right-middle lobe 8 8 Lingula 4 4 Right-lower lobe 26 26 Left-lower lobe 30 30 Mediastinum 13 13 Gender Male 160 160 Patient chart Female 98 98
DE, dual energy; DR, digital radiography; N/A, not applicable; CT, computed tomography; HU, Hounsfield units.
Get Radiology Tree app to read full this article<
Results
Individual Observers
Get Radiology Tree app to read full this article<
Table 3
ROC Results for Five Individual Observers
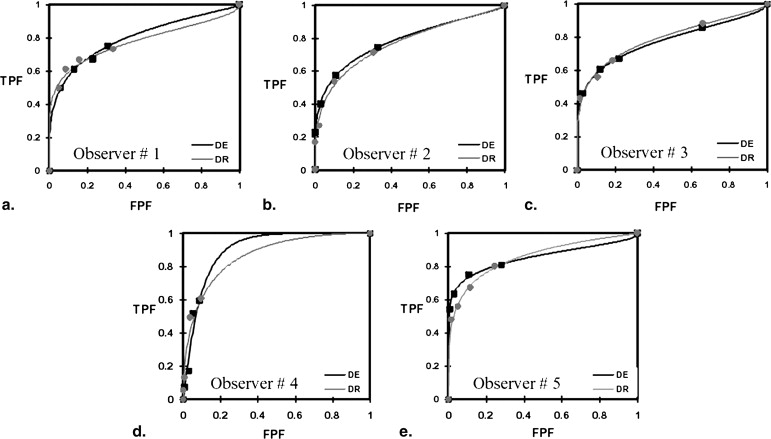
AUC DE AUC DR P Value (Two-tail) in AUC_P_ Value (Two-tail) at FPF = 0.1 Observer 1 0.805 0.784 .523 .536 Observer 2 0.785 0.768 .648 .391 Observer 3 0.780 0.794 .598 .980 Observer 4 0.891 0.843 .334 .793 Observer 5 0.854 0.854 .990 .018
The area under the curve (AUC) for each observer is shown, found to be superior for dual energy (DE) imaging in three of vie observers but not to a significant extent (two-tailed P value based on AUC). For Observer #5, a statistically significant improvement in the receiver-operating characteristic (ROC) was found at false-positive fraction (FPF) = 0.1 ( P = .018) for DE imaging, seen also in Figure 2 .
Get Radiology Tree app to read full this article<
All Observers Pooled
Get Radiology Tree app to read full this article<
Table 4
Summary of Cases and ROC Test Results
AUC_P_ Value (Two-tail) Stratification Description AUC DE AUC DR (AUC) (FPF = 0.1) Pooled All cases 0.795 0.789 .696 .566 Lesion size Mass (>3 cm) 0.801 0.832 .079 .230 Nodule (≤3 cm) 0.786 0.771 .370 .190 Nodule (≤1 cm) 0.778 0.706.056.037 Lesion density Solid (≥20 HU) 0.821 0.814 .657 .430 Non-solid (<20 HU) 0.682 0.697 .629 .696 Chest thickness Large (>26 cm) 0.764 0.766 .938 .382 Average (≤26 cm) 0.806 0.799 .606 .250 Lesion location Right-upper lobe 0.836 0.779.003.006 Left-upper lobe 0.809 0.831 .330 .611 Right-middle lobe 0.850 0.887 .182 .535 Lingula 0.892 0.934 .195 .137 Right-lower lobe 0.804 0.752.054 .202 Left-lower lobe 0.763 0.801 .124 .047 Mediastinum 0.622 0.642 .678 .250 Gender Male 0.712 0.732 .327 .762 Female 0.829 0.788 .111 .807
The total number of readings for each modality was 1290 (equal to 258 cases × 5 radiologists), with 790 actually positive and 500 actually negative. Results were analyzed in terms of the AUC for dual energy (DE) imaging and digital radiography (DR) (area under the curve [AUC] DE and AUC DR , respectively). Statistical significance in the observed differences were analyzed in terms of the P value associated with the entire AUC as well as for the AUC up to a specificity of 90% false-positive fraction (FPF) = 0.10. Statistically significant results are highlighted in bold text.
Get Radiology Tree app to read full this article<
Get Radiology Tree app to read full this article<
Get Radiology Tree app to read full this article<
Diagnostic Accuracy and Clinical Significance
Get Radiology Tree app to read full this article<
Table 5
Accuracy, Definitiveness, and Clinical Significance
Actually Positive Actually Negative Accurate DE ≥3 (Correct) AND DR ≤2 (Wrong) DE ≤2 (Wrong) AND DR ≥3 (Correct) DE ≤2 (Correct) AND DR ≥3 (Wrong) DE ≥3 (Wrong) AND DR ≤2 (Correct) Fraction (Number of readings) 0.31 (49/158) 0.26 (41/158) 0.24 (24/100) 0.33 (33/100) Definitive DE = 5 AND DR ≤4 DE ≤4 AND DR = 5 DE = 1 AND DR ≥2 DE ≥2 AND DR = 1 Fraction (Number of readings) 0.29 (46/158) 0.18 (29/158) 0.46 (46/100) 0.44 (44/100)
Dual energy (DE) imaging was more accurate than digital radiography (DR) in identifying actually positive cases but less accurate in ruling out actually negative. DE imaging was more definitive in properly identifying both actually positive and actually negative cases.
Get Radiology Tree app to read full this article<
Get Radiology Tree app to read full this article<
Discussion
Get Radiology Tree app to read full this article<
Get Radiology Tree app to read full this article<
Get Radiology Tree app to read full this article<
Get Radiology Tree app to read full this article<
Get Radiology Tree app to read full this article<
Get Radiology Tree app to read full this article<
Get Radiology Tree app to read full this article<
Get Radiology Tree app to read full this article<
Acknowledgments
Get Radiology Tree app to read full this article<
Get Radiology Tree app to read full this article<
References
1. Kido S., Kuriyama K., Kuroda C., et. al.: Detection of simulated pulmonary nodules by single-exposure dual-energy computed radiography of the chest: effect of a computer-aided diagnosis system. Eur J Radiol 2002; 44: pp. 205-209.
2. Samei E., Flynn M.J.: An experimental comparison of detector performance for direct and indirect digital radiography systems. Med Phys 2003; 30: pp. 608-622.
3. Antonuk L.E., El-Mohri Y., Siewerdsen J.H., et. al.: Empirical investigation of the signal performance of a high-resolution, indirect detection, active matrix flat-panel imager (AMFPI) for fluoroscopic and radiographic operation. Med Phys 1997; 24: pp. 51-70.
4. Zhao W., Blevis I., Germann S., et. al.: Digital radiology using active matrix readout of amorphous selenium: construction and evaluation of a prototype real-time detector. Med Phys 1997; 24: pp. 1834-1843.
5. Sonoda M., Takano M., Miyahara J., et. al.: Computed radiography utilizing scanning laser stimulated luminescence. Radiology 1983; 148: pp. 833-838.
6. Samei E., Flynn M.J., Eyler W.R.: Detection of subtle lung nodules: relative influence of quantum and anatomic noise on chest radiographs. Radiology 1999; 213: pp. 727-734.
7. Szucs-Farkas Z., Patak M.A., Yuksel-Hatz S., et. al.: Single-exposure dual-energy subtraction chest radiography: detection of pulmonary nodules and masses in clinical practice. Eur Radiol 2008; 18: pp. 24-31.
8. Ricke J., Fischbach F., Freund T., et. al.: Clinical result of Csl-detector-based dual-exposure dual-energy subtraction chest radiography. Eur Radiol 2003; 13: pp. 2577-2582.
9. Ide K., Mogami H., Murakami T., et. al.: Detection of lung cancer using single-exposure dual-energy subtraction chest radiography. Radiat Med 2007; 25: pp. 195-201.
10. Uemura M., Miyagawa M., Yasuhara Y., et. al.: Clinical evaluation of pulmonary nodules with Dual-exposure Dual-energy subtraction chest radiography. Radiat Med 2005; 23: pp. 391-397.
11. Sabol J., Avinash G., Nicolas F., et. al.: The development and characterization of a dual-energy subtraction imaging system for chest radiography based on CsI: TI amorphous silicon flat panel technology. Proc SPIE 2001; 4320:399–408
12. Tagashira H., Arakawa K., Yoshimoto M., et. al.: Detectability of lung nodules using flat panel dual energy subtraction by two shot method: evaluation by ROC method. Eur J Radiol 2007; 64: pp. 279-284.
13. Fraser R., Hickey N., Niklason L., et. al.: Calcification in pulmonary nodules: detection with dual-energy digital radiography. Radiology 1986; 160: pp. 595-601.
14. Kelcz F., Zink F., Peppler W., et. al.: Conventional chest radiography vs. dual-energy computed radiography in the detection and characterization of pulmonary nodules. AJR Am J Roentgenol 1994; 162: pp. 271-278.
15. Rühl R., Wozniak M.M., Werk M., et. al.: CsI-detector-based dual-exposure dual energy in chest radiography for lung nodule detection: results of an international multicenter trial. Eur Radiol 2008; 18: pp. 1831-1839.
16. Kashani H., Gang J.G., Shkumat N.A., et. al.: Development of a high-performance dual-energy chest imaging system: initial investigation of diagnostic performance. Acad Radiol 2009; 16: pp. 464-476.
17. Shkumat N.A., Siewerdsen J.H., Dhanantwari A.C., et. al.: Optimization of image acquisition techniques for dual-energy imaging of the chest. Med Phys 2007; 34: pp. 3904-3915.
18. Richard S., Siewerdsen J.H.: Cascaded systems analysis of noise reduction algorithms in dual-energy imaging. Med Phys 2008; 35: pp. 586-601.
19. Siewerdsen J., Shkumat N., Dhanantwari A., et. al.: High performance dual-energy imaging with a flat panel detector: imaging physics from blackboard to benchtop to bedside. Proc SPIE medical imaging. Physics of Medical Imaging 2006; 6142:61421E-1–61421E-10
20. Shkumat N.A., Siewerdsen J.H., Dhanantwari A.C., et. al.: Cardiac gating with a pulse oximeter for dual-energy imaging. Med Phys 2008; 53: pp. 6097-6112.
21. Gang J., Varon C., Kashani H., et. al.: Multiscale deformable registration for dual-energy x-ray imaging. Med Phys 2009; 36: pp. 351-363.
22. Kalender W.A., Klotz E., Kostaridou L.: An algorithm for noise suppression in dual energy CT material density images. IEEE Trans Med Imaging 1988; 7: pp. 218-224.
23. McCollough C.H., Van Lysel M.S., Peppler W.W., et. al.: A correlated noise reduction algorithm for dual-energy digital subtraction angiography. Med Phys 1989; 16: pp. 873-880.
24. Johns P.C., Yaffe M.J.: Theoretical optimization of dual-energy x-ray imaging with application to mammography. Med Phys 1985; 12: pp. 289-296.
25. Obuchowski N.A.: ROC Analysis. AJR Am J Roentgenol 2005; 184: pp. 364-372.
26. Dorfman D.D., Alf E.: Maximum likelihood estimation of parameters of signal detection theory—a direct solution. Psychometrika 1968; 33: pp. 117-124.
27. Shah P.K., Austin J.H., White C.S., et. al.: Missed non-small cell lung cancer: radiographic findings of potentially resectable lesions evident only in retrospect. Radiology 2003; 226: pp. 235-241.