
Rationale and Objectives
We aimed to do a meta-analysis of the existing literature to assess the accuracy of prostate cancer (PCa) studies that use contrast-enhanced ultrasound (CEUS) as a diagnostic tool.
Materials and Methods
The MEDLINE, EMBASE, and Cochrane Library databases were searched for relevant original articles published up to August 2012. Characteristics of Included studies were recorded. Methodological quality was assessed by using the quality assessment of diagnostic studies tool. Pooled weighted estimates of diagnostic odds ratio (DOR), sensitivity, specificity, and positive and negative likelihood ratio (LR) were calculated. A summary receiver operator characteristic (SROC) curve was constructed to calculate the area under the curve (AUC). Publication bias analysis was also performed.
Results
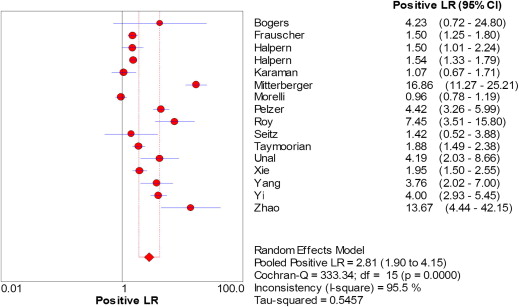
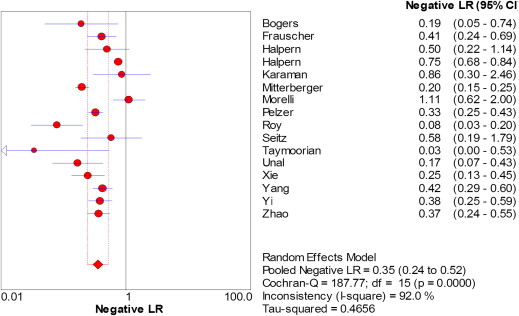
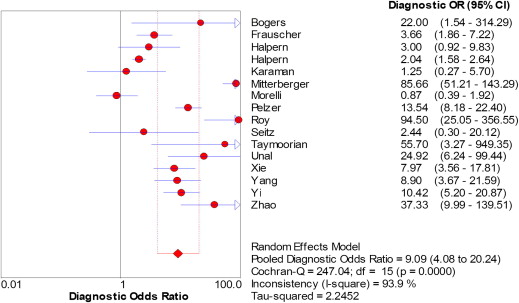
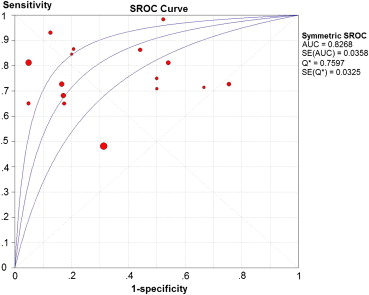
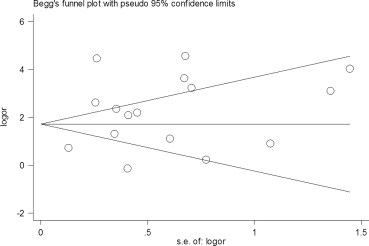
Sixteen studies (2624 patients) were included in the meta-analysis. Various contrast agents and imaging modes were applied. The independent random-effects summary showed a variation in diagnostic values. The summary estimates of sensitivity, specificity, and DOR were 0.70, 0.74, and 9.09, respectively. The weighted positive and negative LR were 2.81 and 0.35, with statistically significant between-study heterogeneity ( P < .001). Sensitivity was better in positive patient studies than positive biopsy cores ones (0.78 vs. 0.64). SROC plot displayed value for AUC (0.82). Begg’s test ( P = .822) and Egger’s test ( P = .198) did not show evidence of publication bias.
Conclusion
CEUS is a promising tool in the detection of PCa, but it cannot completely replace systematic biopsy under the present circumstances. It is necessary to standardize imaging techniques, contrast agents and diagnostic criteria. Large samples, multi-center studies and high-quality prospective trials are necessary to assess its clinical value.
Introduction
Prostate cancer (PCa) is one of the most commonly diagnosed cancers in males. The American Cancer Society estimates that in 2012 PCa will account for 29% of new cancer diagnoses in men and 9% of cancer-related deaths in the United States . Early detection is the key to successful treatment. Digital rectal examination, prostate-specific antigen, conventional transrectal ultrasonography, and magnetic resonance imaging have been the main methods for detecting PCa. These methods are available but the diagnosis of PCa is far from optimal . Grayscale transrectal ultrasound-guided systematic biopsy is the reference standard method, however, it has been shown that this approach missed clinically relevant cancers. Autopsy studies have demonstrated that sensitivity of sextant prostate biopsy was 30%, with increasing sensitivity with increasing numbers of biopsy cores, 36%–58% for 12-core biopsies, and 53%–58% for 18-core biopsies . PCa is multifocal and heterogeneous in nature, making it difficult to detect all cancers, sites, and grades . Thus, new techniques that help us to display more cancerous lesions and to target areas of high cancer incidence are desirable.
Contrast-enhanced ultrasound (CEUS) imaging was developed to real-time image perfusion . Ultrasound contrast agents consist of small encapsulated gas bubbles that are administered intravenously and remain intravascular. Adding microbubbles as additional reflectors into the bloodstream increase the sensitivity of imaging. Numerous studies have been performed to assess the diagnostic performance of CEUS in the evaluation of prostate lesions . These studies yield varying estimates of sensitivity and specificity, which are probably caused by advances in technology, differences in scan protocols, and heterogeneity in patient populations. The purpose of our study, therefore, was to perform a systematic review and quantitative meta-analysis of the literature to determine the overall diagnostic value of CEUS for PCa.
Materials and methods
Data Sources and Exclusion Criteria
Get Radiology Tree app to read full this article<
Get Radiology Tree app to read full this article<
Quality Assessment and Data Extraction
Get Radiology Tree app to read full this article<
Get Radiology Tree app to read full this article<
Data Synthesis and Statistical Analysis
Get Radiology Tree app to read full this article<
Get Radiology Tree app to read full this article<
Get Radiology Tree app to read full this article<
Get Radiology Tree app to read full this article<
Results
Study Selection and Characteristics
Get Radiology Tree app to read full this article<
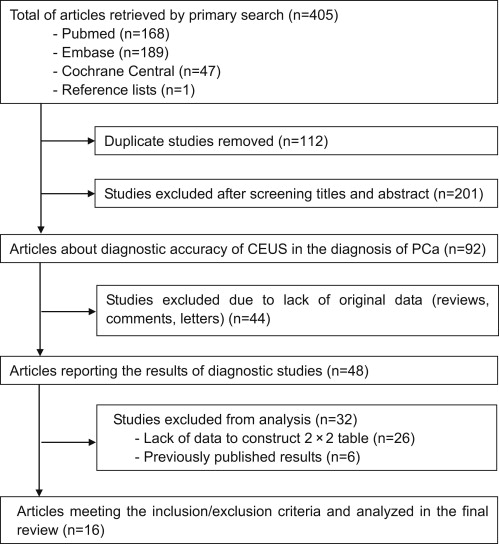
Get Radiology Tree app to read full this article<
Get Radiology Tree app to read full this article<
Table 1
Characteristics of Included Studies
Author, Publication Year (Reference) Country No. of Patients Study Design Mean Patient Age (y) Contrast Agent Gold Standard Mean PSA (ng/mL) Volume of Prostate (mL) QUADAS Score Bogers et al, 1999 Netherlands 18 Retrospective NR Levovist® Biopsy 18.6 NR 11 Frauscher et al, 2002 Austria 230 Prospective 56.0 Levovist® Biopsy 4.6 NR 13 Halpern et al, 2001 United States 60 Prospective 64.0 Definity® Biopsy NR NR 12 Halpern et al, 2005 United States 301 NR 63.0 AF0150 Biopsy 9.5 NR 13 Karaman et al, 2005 Turkey 32 Prospective 63.5 Levovist® Biopsy 9.5 48.0 13 Mitterberger et al, 2010 Austria 760 NR 60.9 Sulfur hexafluoride Biopsy 4.5 43.0 12 Morelli et al, 2011 Italy 150 Prospective 65.0 SonoVue® Biopsy 8.2 NR 13 Pelzer et al, 2005 Austria 380 NR 60.7 SonoVue® Biopsy 6.2 35.5 13 Roy et al, 2003 France 85 NR 64.0 NR Biopsy 18.2 NR 12 Seitz et al, 2011 Germany 35 Prospective 64.0 SonoVue® Prostatectomy 12.7 NR 13 Taymoorian et al, 2007 Germany 95 Prospective 66.0 SonoVue® Biopsy 10.0 50.0 13 Unal et al, 2000 Netherlands 59 Retrospective 64.9 Levovist Prostatectomy 10.1 45.8 11 Xie et al, 2011 China 150 Prospective 68.5 SonoVue® Biopsy 22.1 54.4 13 Yang et al, 2008 China 115 Prospective 70.0 SonoVue® Biopsy NR NR 13 Yi et al, 2006 Korea 48 Prospective 62.0 Levovist® Biopsy 7.5 NR 11 Zhao et al, 2011 China 106 NR 68.7 SonoVue® Biopsy 10.1 53.9 12
NR, not reported.
Get Radiology Tree app to read full this article<
Get Radiology Tree app to read full this article<
Methodologic Quality Assessment
Get Radiology Tree app to read full this article<
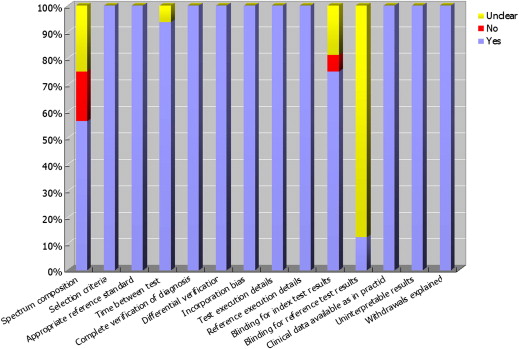
Get Radiology Tree app to read full this article<
Pooled Estimates
Get Radiology Tree app to read full this article<
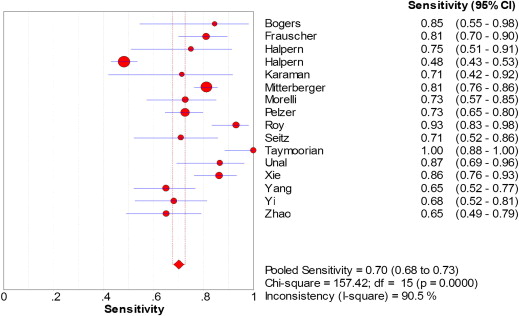
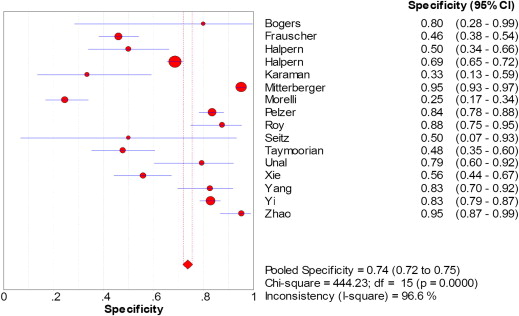
Get Radiology Tree app to read full this article<
Get Radiology Tree app to read full this article<
Heterogeneity and Meta-regression Analysis
Get Radiology Tree app to read full this article<
Publication Bias
Get Radiology Tree app to read full this article<
Get Radiology Tree app to read full this article<
Discussion
Get Radiology Tree app to read full this article<
Get Radiology Tree app to read full this article<
Get Radiology Tree app to read full this article<
Get Radiology Tree app to read full this article<
Get Radiology Tree app to read full this article<
Get Radiology Tree app to read full this article<
Get Radiology Tree app to read full this article<
Get Radiology Tree app to read full this article<
Get Radiology Tree app to read full this article<
Get Radiology Tree app to read full this article<
Conclusions
Get Radiology Tree app to read full this article<
Get Radiology Tree app to read full this article<
References
1. Siegel R., Naishadham D., Jemal A.: Cancer statistics. CA Cancer J Clin 2012; 62: pp. 10-29.
2. Kayhan A., Fan X.B., Oto Aytekin: Dynamic contrast-enhanced magnetic resonance imaging in prostate cancer. Top Magn Reson Imaging 2009; 20: pp. 105-112.
3. Shah J.B., Reese A.C., McKiernan J.M., et. al.: PSA updated: still relevant in the new millennium?. Eur Urol 2005; 47: pp. 427-432.
4. Delongchamps N.B., de la Roza G., Jones R., et. al.: Saturation biopsies on autopsied prostates for detecting and characterizing prostate cancer. BJU Int 2009; 103: pp. 49-54.
5. Cookson M.S., Fleshner N.E., Soloway S.M., et. al.: Correlation between Gleason score of needle biopsy and radical prostatectomy specimen: accuracy and clinical implications. J Urol 1997; 157: pp. 559-562.
6. Albrecht T., Blomley M., Bolondi L., et. al.: Guidelines for the use of contrast agents in ultrasound. Ultraschall Med 2004; 25: pp. 249-256.
7. Feinstein S.B.: The powerful microbubble: from bench to bedside, from intravascular indicator to therapeutic delivery system, and beyond. Am J Physiol Heart Circ Physiol 2004; 287: pp. H450-H457.
8. Wink M.H., de la Rosette J.J., Grimbergen C.A., et. al.: Transrectal contrast enhanced ultrasound for diagnosis of prostate cancer. World J Urol 2007; 25: pp. 367-373.
9. Moher D., Liberati A., Tetzlaff J., et. al.: Preferred reporting items for systematic reviews and meta-analyses: the PRISMA statement. J Clin Epidemiol 2009; 62: pp. 1006-1012.
10. Whiting P., Rutjes A.W., Reitsma J.B., et. al.: The development of QUADAS: a tool for the quality assessment of studies of diagnostic accuracy included in systematic reviews. BMC Med Res Methodol 2003; 3: pp. 25.
11. Whiting P.F., Weswood M.E., Rutjes A.W., et. al.: Evaluation of QUADAS, a tool for the quality assessment of diagnostic accuracy studies. BMC Med Res Methodol 2006; 6: pp. 9.
12. Borenstein M., Hedges L.V., Higgins J.P.T., et. al.: Introduction to meta-analysis.2009.WileyChichester, UK
13. Littenberg B., Moses L.E.: Estimating diagnostic accuracy from multiple conflicting reports: a new meta-analytic method. Med Decis Making 1993; 13: pp. 313-321.
14. Sweeting M.J., Sutton A.J., Lambert P.C.: What to add to nothing? Use and avoidance of continuity corrections in meta-analysis of sparse data. Stat Med 2004; 23: pp. 1351-1375.
15. Bruce N., Pope D., Stanistreet D.: Quantitative methods for health research: a practical interactive guide to epidemiology and statistics.2008.WileyChichester, UK
16. DerSimonian R., Laird N.: Meta-analysis in clinical trials. Control Clin Trials 1986; 7: pp. 177-188.
17. Frauscher F., Klauser A., Volgger H., et. al.: Comparison of contrast enhanced color Doppler targeted biopsy with conventional systematic biopsy: impact on prostate cancer detection. J Urol 2002; 167: pp. 1648-1652.
18. Mitterberger M., Aigner F., Pinggera G.M., et. al.: Contrast-enhanced colour Doppler-targeted prostate biopsy: correlation of a subjective blood-flow rating scale with the histopathological outcome of the biopsy. BJU Int 2010; 106: pp. 1315-1318.
19. Pelzer A., Bektic J., Berger A.P., et. al.: Prostate cancer detection in men with prostate specific antigen 4 to 10 ng/ml using a combined approach of contrast enhanced color Doppler targeted and systematic biopsy. J Urol 2005; 173: pp. 1926-1929.
20. Roy C., Buy X., Lang H., et. al.: Contrast enhanced color Doppler endorectal sonography of prostate: efficiency for detecting peripheral zone tumors and role for biopsy procedure. J Urol 2003; 170: pp. 69-72.
21. Yi A., Kim J.K., Park S.H., et. al.: Contrast-enhanced sonography for prostate cancer detection in patients with indeterminate clinical findings. Am J Roentgenol 2006; 186: pp. 1431-1435.
22. Karaman C.Z., Unsal A., Akdilli A., et. al.: The value of contrast enhanced power Doppler ultrasonography in differentiating hypoechoic lesions in the peripheral zone of prostate. Eur J Radiol 2005; 54: pp. 148-155.
23. Morelli G., Pagni R., Mariani C., et. al.: Results of vardenafil mediated power Doppler ultrasound, contrast enhanced ultrasound and systematic random biopsies to detect prostate cancer. J Urol 2011; 185: pp. 2126-2131.
24. Bogers H.A., Sedelaar J.P., Beerlage H.P., et. al.: Contrast-enhanced three-dimensional power Doppler angiography of the human prostate: correlation with biopsy outcome. Urology 1999; 54: pp. 97-104.
25. Unal D., Sedelaar J.P., Aarnink R.G., et. al.: Three-dimensional contrast-enhanced power Doppler ultrasonography and conventional examination methods: the value of diagnostic predictors of prostate cancer. BJU Int 2000; 86: pp. 58-64.
26. Taymoorian K., Thomas A., Slowinski T., et. al.: Transrectal broadband-Doppler sonography with intravenous contrast medium administration for prostate imaging and biopsy in men with an elevated PSA value and previous negative biopsies. Anticancer Res 2007; 27: pp. 4315-4320.
27. Xie S.W., Li H.L., Du J., et. al.: Contrast-enhanced ultrasonography with contrast-tuned imaging technology for the detection of prostate cancer: comparison with conventional ultrasonography. BJU Int 2011; 109: pp. 1620-1626.
28. Yang J.C., Tang J., Li J., et. al.: Contrast-enhanced gray-scale transrectal ultrasound-guided prostate biopsy in men with elevated serum prostate-specific antigen levels. Acad Radiol 2008; 15: pp. 1291-1297.
29. Zhao H.W., Luo J.H., Xu H.X., et. al.: The value of contrast-enhanced transrectal ultrasound in predicting the nature of prostate diseases and the Gleason score of prostate cancer by a subjective blood flow grading scale. Urol Int 2011; 87: pp. 165-170.
30. Halpern E.J., Rosenberg M., Gomella L.G.: Prostate cancer: contrast-enhanced us for detection. Radiology 2001; 219: pp. 219-225.
31. Halpern E.J., Ramey R.J., Strup S.E., et. al.: Detection of prostate carcinoma with contrast-enhanced sonography using intermittent harmonic imaging. Cancer 2005; 104: pp. 2373-2383.
32. Seitz M., Gratzke C., Schlenker B., et. al.: Contrast-enhanced transrectal ultrasound (CE-TRUS) with cadence-contrast pulse sequence (CPS) technology for the identification of prostate cancer. Urol Oncol 2011; 29: pp. 295-301.
33. Huque M.F.: Experiences with meta-analysis in DNA submissions. Proc Biopharm Sect Am Stat Assoc 1988; 2: pp. 28-33.
34. Irwig L., Macaskill P., Glasziou P., et. al.: Meta-analytic methods for diagnostic test accuracy. J Clin Epidemiol 1995; 48: pp. 119-132.
35. Irwig L., Tosteson A.N., Gatsonis C., et. al.: Guidelines for meta-analyses evaluating diagnostic tests. Ann Intern Med 1994; 120: pp. 667-676.
36. Casciaro S., Conversano F., Ragusa A., et. al.: Optimal enhancement configuration of silica nanoparticles for ultrasound imaging and automatic detection at conventional diagnostic frequency. Invest Radiol 2010; 45: pp. 715-724.
37. Halpern E.J.: Contrast-enhanced ultrasound imaging of prostate cancer. Rev Urol 2006; 8: pp. S29-S37.
38. Whiting P., Rutjes A.W.S., Reitsma J.B., et. al.: The development and validation of methods for assessing the quality of diagnostic accuracy studies. Health Technol Assess 2004; 8: pp. 1.
39. Deville W.L., Buntinx F., Bouter L.M., et. al.: Conducting systematic reviews of diagnostic studies: didactic guidelines. BMC Med Res Methodol 2002; 2: pp. 9.
40. Halligan S., Altman D.G., Taylor S.A., et. al.: CT colonography in the detection of colorectal polyps and cancer: systematic review, metaanalysis, and proposed minimum data set for study level reporting. Radiology 2005; 237: pp. 893-904.
41. Colleselli D., Bektic J., Schaefer G., et. al.: The influence of prostate volume on prostate cancer detection using a combined approach of contrast enhanced ultrasonography-targeted and systematic grey-scale biopsy. BJU Int 2007; 100: pp. 1264-1267.