
Rationale and Objectives
Although myocardial perfusion positron emission tomography (PET), using either cyclotron-produced ammonia or generator-produced rubidium 82, has reported excellent diagnostic capabilities in the detection of coronary artery disease (CAD) in individual studies, the technique is not widely used in practice. This may be driven by cost and availability or by unawareness of performance. The purpose of our study was to conduct an evidence-based evaluation of PET in the diagnosis of CAD.
Materials and Methods
We examined studies from January 1977 to July 2007 using MEDLINE and EMBASE. A study was included if it ( ) used PET as a diagnostic test for CAD and ( ) used catheter x-ray angiography as the reference standard (≥50% diameter stenosis). Analysis was performed on a subject and coronary territory level.
Results
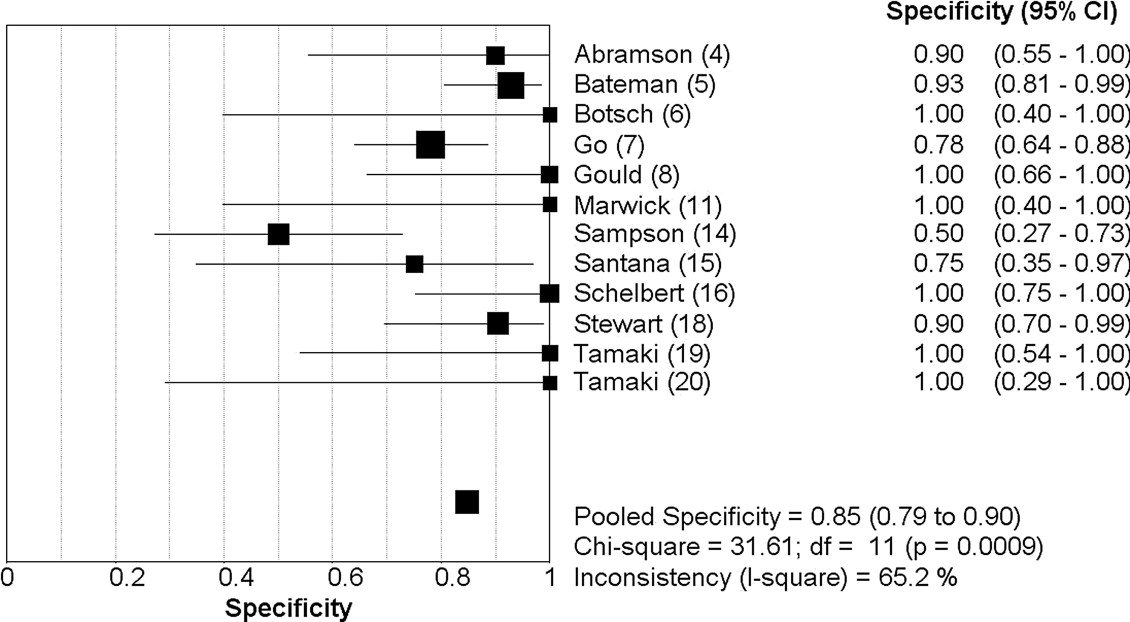
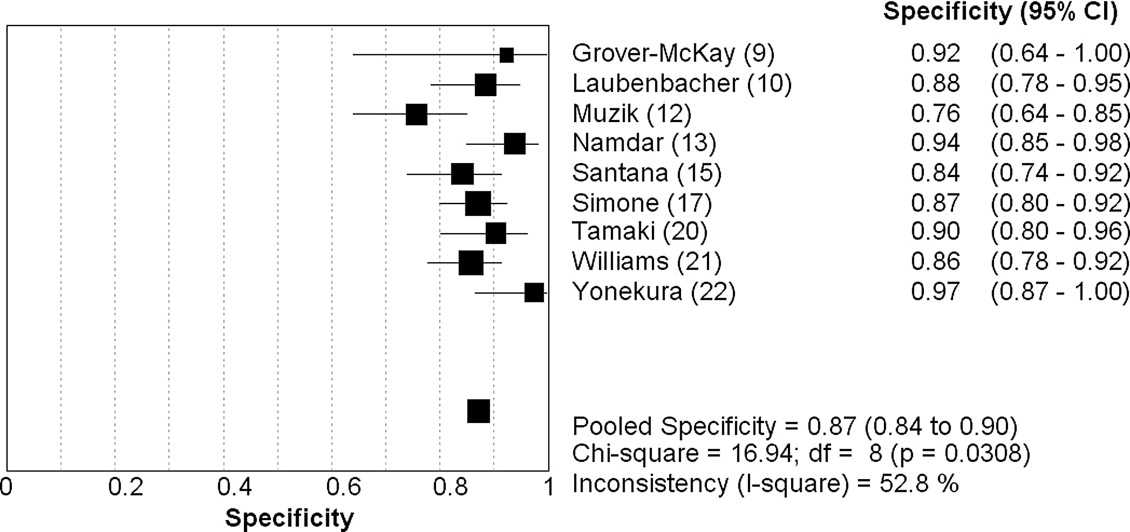
Nineteen studies (1442 patients) met the inclusion criteria. On a patient level, PET demonstrated a sensitivity of 0.92 (95% confidence interval [CI]: 0.90–0.94) and specificity of 0.85 (CI: 0.79–0.90), with a positive likelihood ratio (LR+) of 6.2 (CI: 3.3–11.8) and negative likelihood ratio (LR−) of 0.11 (CI: 0.08–0.14). On a coronary territory level (n = 1130), PET showed a sensitivity of 0.81 (CI: 0.77–0.84) and specificity of 0.87 (CI: 0.84–0.90), with an LR+ of 5.9 (CI: 4.5-7.9) and an LR− of 0.19 (CI: 0.09–0.38).
Conclusion
PET demonstrates excellent diagnostic properties in the diagnosis of CAD, especially at the patient level. The capabilities appear superior to those reported in meta-analyses for perfusion imaging with Tl-201 and sestamibi, or anatomical imaging with coronary MDCT angiography or MRA. Given that previous studies have found PET to be cost-effective and the current findings of excellent sensitivity and specificity, the modality should be more widely considered as an initial test in the diagnosis of CAD.
Coronary artery disease (CAD), secondary to atherosclerosis, is the leading cause of mortality in the United States, underlying or contributing to approximately 650,000 deaths per year ( ). While catheter-based x-ray angiography evaluation of the coronary lumen is generally used as the clinical reference standard, the invasive procedure carries small but significant risks; thus, a potential noninvasive alternative would be valuable. Radionuclide myocardial perfusion imaging is one of the most common used diagnostic tests in the assessment of CAD and largely performed by thallium-201 or a technetium-99m perfusion tracer via single-photon emission computed tomography (SPECT). However, myocardial perfusion positron emission tomography (PET), which has several advantages over SPECT, including better spatial resolution, higher counting efficiencies, and excellent attenuation correction, resulting in single-center studies demonstrating robust sensitivity and specificity, is less commonly performed throughout the world. This is likely driven by the greater availability and lesser costs of SPECT, but lack of awareness regarding the diagnostic properties of PET in the diagnosis of CAD may also be a factor. Moreover, PET has become more prevalent and less expensive in the last decade, given its widespread use in oncological imaging. The purpose of our study was to provide an evidence-based evaluation of the clinical utility of PET for coronary artery disease; thus, we performed a comprehensive meta-analysis of all currently published studies comparing PET with catheter-based x-ray angiography as the gold standard.
Methods
Data Sources and Searches
MEDLINE and EMBASE for English and non-English literature published from January 1977 to July 2007 were searched evaluating for the presence of CAD in native or non-native coronary arteries by PET and catheter-based x-ray angiography in the same patients. The search included medical subject headings for positron emission tomography, myocardial perfusion , and coronary angiography with the exploded term coronary artery disease. Moreover, we evaluated bibliographies of retrieved articles, review articles, and textbooks. The retrieved studies were examined for potentially duplicate or overlapping data. Given that meeting abstracts provide insufficient information regarding their data and lack of finality regarding the results, they were excluded.
Study Selection
Get Radiology Tree app to read full this article<
Data Extraction and Quality Assessment
Get Radiology Tree app to read full this article<
Get Radiology Tree app to read full this article<
Data Synthesis and Statistical Analysis
Get Radiology Tree app to read full this article<
Assessment of Heterogeneity
Get Radiology Tree app to read full this article<
Get Radiology Tree app to read full this article<
Results
Get Radiology Tree app to read full this article<
Table 1
Characteristics of Included Studies
First Author (Ref.) Year Journal Patients ( N ) Excluded Male (%) Mean Age, yr (SD) PET Radiotracer Stressor Selection Stenosis Abramson ( ) 2000Journal of Nuclear Cardiology 19 0 0 59 (10) F-18 deoxyglucose (FDG) Treadmill n = 8, dipyridamole n = 11 Women referred for chest pain ≥50% Bateman ( ) 2006Journal of Nuclear Cardiology 112 0 46 67 (NS) Rubidium-82 Dipyridamole Matched case-control ≥70% Botsch ( ) 1994European Journal of Nuclear Medicine 34 0 NS 56 (NS) Rubidium-82 Exercise Suspected CAD ≥50% Go ( ) 1990Journal of Nuclear Medicine 202 0 NS NS Rubidium-82 Dipyridamole Suspected CAD ≥50% Gould ( ) 1986Journal of the American College of Cardiology 31 0 NS NS 27 rubidium-82/23 nitrogen-13 (N-13) Dipyridamole-handgrip stress Suspected CAD CFR<3.0 Grover-McKay ( ) 1992American Heart Journal 16 0 6 50 (11) Rubidium-82 Dipyridamole-handgrip stress 16 with known CAD ≥50% Laubenbacher ( ) 1993Journal of Nuclear Medicine 29 0 NS 61 (11) Nitrogen-13 (N-13) Dipyridamole or adenosine Suspected CAD ≥75% Marwick ( ) 1992Journal of the American Society of Echocardiography 74 0 81 60 (4) Rubidium-82 Dipyridamole-handgrip stress Known CAD >50% Muzik ( ) 1998Journal of the American College of Cardiology 31 0 74 62 (12) Nitrogen-13 (N-13) Adenosine 31 with CAD ≥70% Namdar ( ) 2005Journal of Nuclear Medicine 25 0 88 62 (NS) Nitrogen-13 (N-13) PET/CT Known CAD >50% Sampson ( ) 2007Journal of the American College of Cardiology 64 0 39 62 (15) Rubidium-82 PET/CT (dipyridamole, adenosine, dobutamine) Suspected CAD ≥70% Santana ( ) 2007Journal of Nuclear Medicine 53 NS 29 NS Rubidium-82 PET/CT (adenosine) Known or Suspected CAD ≥50% Schelbert ( ) 1982American Journal of Cardiology 45 0 78 NS Nitrogen-13 (N-13) Dipyridamole 32 with CAD/13 normal volunteers >50% Simone ( ) 1992American Journal of Physiologic Imaging 225 NS 80 57 (NS) Rubidium-82 Dipyridamole Suspected CAD ≥67% Stewart ( ) 1991American Journal of Cardiology 81 0 64 57 (12) Rubidium-82 Dipyridamole-handgrip stress Suspected CAD >50% Tamaki ( ) 1985European Journal of Nuclear Medicine 25 0 NS 53 (NS) Nitrogen-13 (N-13) Exercise 19 known CAD/6 normal volunteers NS Tamaki ( ) 1988Journal of Nuclear Medicine 51 0 NS 56 (NS) Nitrogen-13 (N-13) Exercise Known CAD >50% Williams ( ) 1994Journal of Nuclear Medicine 287 NS NS NS Rubidium-82 Dipyridamole Suspected CAD 67 Yonekura ( ) 1987American Heart Journal 40 2 95 52 (NS) Nitrogen-13 (N-13) Exercise 40 with known CAD >75%
NS, not specified.
Get Radiology Tree app to read full this article<
Get Radiology Tree app to read full this article<
Table 2
Per Patient, Per Coronary Territory Analysis
Analysis by Patient Analysis by Coronary Territory First Author (Ref)N TP ( n ) FN ( n ) FP ( n ) TN ( n ) Sensitivity Specificity_N_ TP ( n ) FN ( n ) FP ( n ) TN ( n ) Sensitivity Specificity Abramson ( ) 19 8 1 1 9 0.89 0.90 NS NS NS NS NS NS NS Bateman ( ) 112 61 9 3 39 0.87 0.93 NS NS NS NS NS NS NS Botsch ( ) 29 24 1 0 4 0.96 1.0 NS NS NS NS NS NS NS Go ( ) 202 142 10 11 39 0.93 0.78 NS NS NS NS NS NS NS Gould ( ) 31 21 1 0 9 0.95 1 NS NS NS NS NS NS NS Grover-McKay ( ) 16 15 1 0 0 0.94 0 48 32 3 1 12 0.91 0.92 Laubenbacher ( ) NS NS NS NS NS NS NS 87 14 4 8 61 0.78 0.88 Marwick ( ) 74 63 7 0 4 0.90 1 NS NS NS NS NS NS NS Muzik ( ) NS NS NS NS NS NS NS 93 21 2 17 53 0.91 0.76 Namdar ( ) NS NS NS NS NS NS NS 100 11 24 4 61 0.31 0.94 Sampson ( ) 64 41 3 10 10 0.93 0.50 NS NS NS NS NS NS NS Santana ( ) 53 42 3 2 6 0.93 0.75 159 58 25 12 64 0.70 0.84 Schelbert ( ) 45 31 1 0 13 0.97 1 NS NS NS NS NS NS NS Simone ( ) NS NS NS NS NS NS NS 153 26 3 16 108 0.90 0.87 Stewart ( ) 81 51 9 2 19 0.85 0.90 NS NS NS NS NS NS NS Tamaki ( ) 25 18 1 0 6 0.945 1 NS NS NS NS NS NS NS Tamaki ( ) 51 47 1 0 3 0.98 1 153 80 11 6 56 0.88 0.90 Williams ( ) NS NS NS NS NS NS NS 213 88 13 16 96 0.87 0.86 Yonekura ( ) 38 37 1 0 0 0.89 0.90 114 67 8 1 38 0.89 0.97
NS, not specified.
Get Radiology Tree app to read full this article<
Patient-Level Summary Performance Estimates
Get Radiology Tree app to read full this article<
Get Radiology Tree app to read full this article<
Get Radiology Tree app to read full this article<
Coronary Territory-Level Summary Performance Estimates
Get Radiology Tree app to read full this article<
Get Radiology Tree app to read full this article<
Assessment of Heterogeneity
Get Radiology Tree app to read full this article<
Get Radiology Tree app to read full this article<
Table 3
Quality Assessment
First Author (Ref) Item 1 Item 2 Item 3 Item 4 Item 5 Item 6 Item 7 Item 8 Item 9 Item 10 Score Abramson ( ) Yes Yes Yes No Yes Yes Yes Yes No No 7 Bateman ( ) Yes No Yes No No Yes Yes Yes Yes Yes 7 Botsch ( ) No No Yes No No Yes Yes No No No 3 Go ( ) Yes No Yes No No Yes Yes No Yes No 5 Gould ( ) Yes No Yes No Yes Yes Yes No No No 5 Grover-McKay ( ) Yes No Yes No Yes Yes Yes No No No 5 Laubenbacher ( ) No No Yes No Yes Yes Yes Yes No No 5 Marwick ( ) Yes Yes Yes No Yes Yes Yes No Yes No 7 Muzik ( ) Yes Yes No No Yes Yes Yes No No No 5 Namdar ( ) Yes No Yes No Yes Yes Yes No No No 5 Sampson ( ) Yes No Yes Yes Yes Yes Yes Yes Yes Yes 9 Santana ( ) Yes No Yes No Yes Yes Yes Yes Yes Yes 8 Schelbert ( ) No No Yes No Yes Yes Yes No Yes No 5 Simone ( ) Yes No Yes No No Yes Yes Yes Yes No 6 Stewart ( ) Yes No Yes No Yes Yes Yes No Yes Yes 7 Tamaki ( ) No No Yes No No Yes No No No No 2 Tamaki ( ) Yes Yes Yes No Yes Yes Yes No Yes No 7 Williams ( ) Yes No Yes No No Yes Yes No Yes No 5 Yonekura ( ) Yes No Yes No Yes Yes Yes No Yes Yes 7
Item 1: Was the population clinically relevant, defined as a group of patients covering the spectrum of disease that is likely to be encountered in the current or future use of the test?
Item 2: Was there complete verification by the reference standard?
Item 3: Was there blinded interpretation of the test results?
Item 4: Was there consecutive patient selection?
Item 5: Was there prospective enrollment of patients?
Item 6: Was there adequate description and quality of the imaging procedure?
Item 7: Was the quality of the reference test technically adequate?
Item 8: Was there adequate clinical description of the patient population?
Item 9: Was the sample size ≥35 patients?
Item 10: Was there adequate reporting of results, including summary and subgroup indices of accuracy?
Get Radiology Tree app to read full this article<
Discussion
Get Radiology Tree app to read full this article<
Get Radiology Tree app to read full this article<
Get Radiology Tree app to read full this article<
Get Radiology Tree app to read full this article<
Get Radiology Tree app to read full this article<
References
1. Thom T., Haase N., Rosamond W., et. al., American Heart Association Statistics Committee and Stroke Statistics Subcommittee: Heart disease and stroke statistics: 2006 Update: A report from the American Heart Association Statistics Committee and Stroke Statistics Subcommittee. Circulation 2006; 113: pp. e85-e151.
2. Whiting P., Rutjes A.W., Reitsma J.B., et. al.: The development of QUADAS: A tool for the quality assessment of studies of diagnostic accuracy included in systematic reviews. BMC Med Res Methodol 2003; 3: pp. 25.
3. Reitsma J.B., Glas A.S., Rutjes A.W., et. al.: Bivariate analysis of sensitivity and specificity produces informative summary measures in diagnostic reviews. J Clin Epidemiol 2005; 58: pp. 982-990.
4. Abramson B.L., Ruddy T.D., deKemp R.A., et. al.: Stress perfusion/metabolism imaging: A pilot study for a potential new approach to the diagnosis of coronary disease in women. J Nucl Cardiol 2000; 7: pp. 205-212.
5. Bateman T.M., Heller G.V., McGhie A.I., et. al.: Diagnostic accuracy of rest/stress ECG-gated Rb-82 myocardial perfusion PET: Comparison with ECG-gated Tc-99m sestamibi SPECT. J Nucl Cardiol 2006; 13: pp. 24-33.
6. Botsch H., Beringer K., Petersen J., et. al.: Single-photon emission tomography studies of rubidium-81 in the detection of ischaemic heart disease, using a stress-reinjection protocol. Eur J Nucl Med 1994; 21: pp. 407-414.
7. Go R.T., Marwick T.H., MacIntyre W.J., et. al.: A prospective comparison of rubidium-82 PET and thallium-201 SPECT myocardial perfusion imaging utilizing a single dipyridamole stress in the diagnosis of coronary artery disease. J Nucl Med 1990; 31: pp. 1899-1905.
8. Gould K.L., Goldstein R.A., Mullani N.A., et. al.: Noninvasive assessment of coronary stenoses by myocardial perfusion imaging during pharmacologic coronary vasodilation. J Am Coll Cardiol 1986; 7: pp. 775-789.
9. Grover-McKay M., Ratib O., Schwaiger M., et. al.: Detection of coronary artery disease with positron emission tomography and rubidium 82. Am Heart J 1992; 123: pp. 646-652.
10. Laubenbacher C., Rothley J., Sitomer J., et. al.: An automated analysis program for the evaluation of cardiac PET studies: Initial results in the detection and localization of coronary artery disease using nitrogen-13-ammonia. J Nucl Med 1993; 34: pp. 968-978.
11. Marwick T.H., Nemec J.J., Stewart W.J., et. al.: Diagnosis of coronary artery disease using exercise echocardiography and positron emission tomography: Comparison and analysis of discrepant results. J Am Soc Echocardiogr 1992; 5: pp. 231-238.
12. Muzik O., Duvernoy C., Beanlands R.S., et. al.: Assessment of diagnostic performance of quantitative flow measurements in normal subjects and patients with angiographically documented coronary artery disease by means of nitrogen-13 ammonia and positron emission tomography. J Am Coll Cardiol 1998; 31: pp. 534-540.
13. Namdar M., Hany T.F., Koepfli P., et. al.: Integrated PET/CT for the assessment of coronary artery disease: A feasibility study. J Nucl Med 2005; 46: pp. 930-935.
14. Sampson U.K., Dorbala S., Limaye A., et. al.: Diagnostic accuracy of rubidium-82 myocardial perfusion imaging with hybrid positron emission tomography/computed tomography in the detection of coronary artery disease. J Am Coll Cardiol 2007; 49: pp. 1052-1058.
15. Santana C.A., Folks R.D., Garcia E.V., et. al.: Quantitative (82)Rb PET/CT: Development and validation of myocardial perfusion database. J Nucl Med 2007; 48: pp. 1122-1128.
16. Schelbert H.R., Wisenberg G., Phelps M.E., et. al.: Noninvasive assessment of coronary stenoses by myocardial imaging during pharmacologic coronary vasodilation. Am J Cardiol 1982; 49: pp. 1197-1207.
17. Simone G.L., Mullani N.A., Page D.A., et. al.: Utilization statistics and diagnostic accuracy of a nonhospital-based positron emission tomography center for the detection of coronary artery disease using rubidium-82. Am J Physiol Imaging 1992; 7: pp. 203-209.
18. Stewart R.E., Schwaiger M., Molina E., et. al.: Comparison of rubidium-82 positron emission tomography and thallium-201 SPECT imaging for detection of coronary artery disease. Am J Cardiol 1991; 67: pp. 1303-1310.
19. Tamaki N., Yonekura Y., Senda M., et. al.: Myocardial positron computed tomography with 13N-ammonia at rest and during exercise. Eur J Nucl Med 1985; 11: pp. 246-251.
20. Tamaki N., Yonekura Y., Senda M., et. al.: Value and limitation of stress thallium-201 single photon emission computed tomography: Comparison with nitrogen-13 ammonia positron tomography. J Nucl Med 1988; 29: pp. 1181-1188.
21. Williams B.R., Mullani N.A., Jansen D.E., et. al.: A retrospective study of the diagnostic accuracy of a community hospital-based PET center for the detection of coronary artery disease using rubidium-82. J Nucl Med 1994; 35: pp. 1586-1592.
22. Yonekura Y., Tamaki N., Senda M., et. al.: Detection of coronary artery disease with 13N-ammonia and high-resolution positron-emission computed tomography. Am Heart J 1987; 113: pp. 645-654.
23. Sistrom C.L., Garvan C.W.: Proportions, odds, and risk. Radiology 2004; 230: pp. 12-19.
24. Patterson R.E., Eisner R.L., Horowitz S.F.: Comparison of cost-effectiveness and utility of exercise ECG, single photon emission computed tomography, positron emission tomography, and coronary angiography for diagnosis of coronary artery disease. Circulation 1995; 91: pp. 54-65.
25. Yoshinaga K., Chow B.J., Williams K., et. al.: What is the prognostic value of myocardial perfusion imaging using rubidium-82 positron emission tomography?. J Am Coll Cardiol 2006; 48: pp. 1029-1039.
26. Nandalur K.R., Dwamena B.A., Choudhri A.F., Nandalur M.R., Carlos R.C.: Diagnostic performance of stress cardiac magnetic resonance imaging in the detection of coronary artery disease: A meta-analysis. J Am Coll Cardiol 2007; 50: pp. 1343-1353.
27. Underwood S.R., Anagnostopoulos C., Cerqueira M., et. al.: Myocardial perfusion scintigraphy: The evidence. Eur J Nucl Med Mol Imaging 2004; 31: pp. 261-291.
28. Bax J.J., Van der Wall E.E., De Roos A., et. al.: State of the art and future directions.Zaret Bl.Beller G.A.Clinical Nuclear Cardiology.2005.MosbyPhiladelphia:
29. Nandalur K.R., Baskurt E., Hagspiel K.D., et. al.: Calcified carotid atherosclerotic plaque is associated less with ischemic symptoms than is noncalcified plaque on MDCT. AJR Am J Roentgenol 2005; 184: pp. 295-298.
30. Nandalur K.R., Hardie A.D., Raghavan P., et. al.: Composition of the stable carotid plaque: Insights from a multidetector computed tomography study of plaque volume. Stroke 2007; 38: pp. 935-940.
31. Tawakol A., Migrino R.Q., Bashian G.G., et. al.: In vivo 18F-fluorodeoxyglucose positron emission tomography imaging provides a noninvasive measure of carotid plaque inflammation in patients. J Am Coll Cardiol 2006; 48: pp. 1818-1824.