
Rationale and Objectives
The aim of this study was to correlate acoustic radiation force impulse (ARFI) imaging velocities with the pathology results and to evaluate the ability of ARFI in distinguishing benign from malignant breast lesions.
Materials and Methods
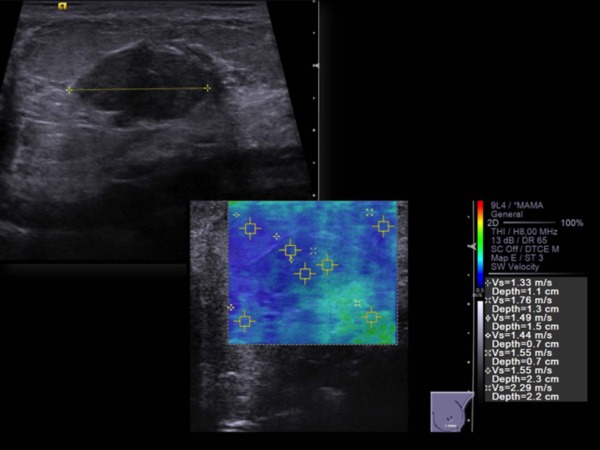
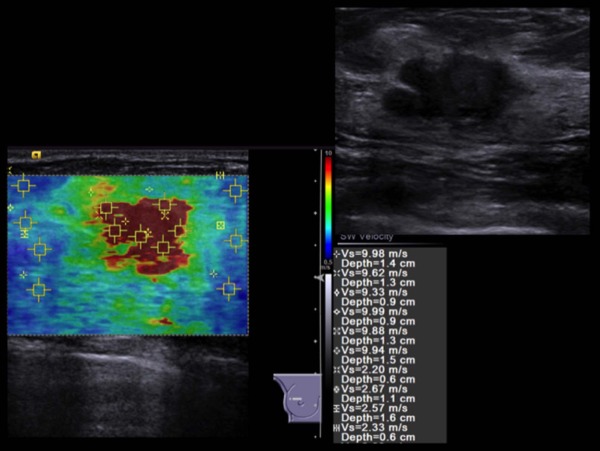
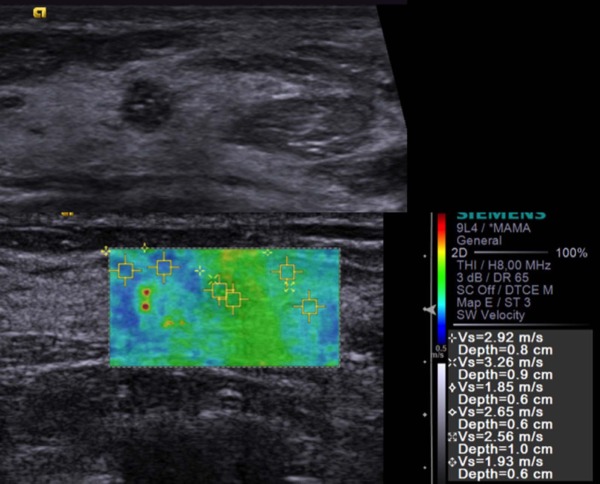
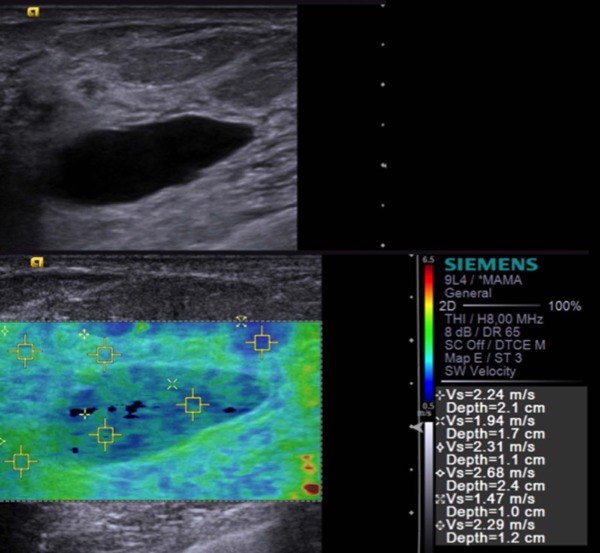
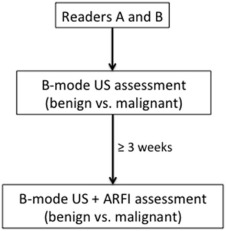
B-mode ultrasonography (US) and ARFI were performed in patients with previously diagnosed and selected breast lesions for biopsy. Shear wave velocity (SWV) was measured inside lesions and in the surrounding parenchyma ( m/s ). SWV measurements as well as lesion-to-parenchyma ratio (LPR) were compared between benign and malignant lesions, and receiver operating characteristic (ROC) curves were plotted. Two blinded readers independently classified the lesions as benign or malignant in two separate reading sessions, one using B-mode US alone and the other using a combined set of B-mode US and ARFI.
Results
Eighty-one patients with a total of 92 breast lesions were included (57 benign and 35 malignant nodules). SWV inside lesions were significantly higher for malignant neoplasms compared to benign (medians of 9.1 m/s vs 3.5 m/s; P < 0.001). LPR was also significantly higher for malignant lesions (3.0 vs 1.4; P < 0.001). Parenchyma SWV had no differences between groups ( P = 0.071). ROC curves showed a significant discriminative power for lesion SWV (area under the curve [AUC] = 0.980; P < 0.001) and LPR (AUC = 0.954; P < 0.001). For lesion measures, a cutoff of 6.593 m/s was obtained, with sensitivity and specificity of 88.6% and 96.5%, respectively.
Conclusions
ARFI provides quantitative elasticity measurements, adding valuable complementary information to B-mode ultrasound, that can potentially help in breast lesion characterization and assisting the decision for biopsy recommendations.
Introduction
Ultrasonography (US) is a useful technique that has been increasingly used as an important diagnostic tool complement to mammography in differentiating benign from malignant breast tumors . Although US depicts more cancers than mammography alone, it has a considerable number of false-positives, which also leads to a higher number of benign mass biopsies .
In the last decades, US technology has experienced several advances, including real-time elastography, which evaluates tissue stiffness, detecting its displacement after slight manual compression . Information is converted into color-scale images and is superimposed to B-mode images. Knowing that malignant tumors tend to be stiffer and that benign masses are usually softer , real-time elastography is used as a complementary technique in addition to B-mode sonography, increasing its specificity (83.1% vs 76.9% for B-mode US alone) . However, this technique has some limitations. The first, and perhaps the most important, is the fact that it is operator dependent and has a higher interobserver variability, because it requires compression with the probe, preventing lateral or angulated movements, to obtain good quality images . Besides variability caused by technical limitations, there is also a certain degree of subjectivity in image interpretation . Another limitation is that real-time elastography only provides qualitative information, although ratios between the lesion and surrounding breast parenchyma can be calculated .
Get Radiology Tree app to read full this article<
Get Radiology Tree app to read full this article<
Materials and Methods
Patients and Lesions
Get Radiology Tree app to read full this article<
B-Mode Ultrasound and ARFI Acquisition
Get Radiology Tree app to read full this article<
Get Radiology Tree app to read full this article<
Get Radiology Tree app to read full this article<
Get Radiology Tree app to read full this article<
Get Radiology Tree app to read full this article<
Readers and Reading Procedures
Get Radiology Tree app to read full this article<
Get Radiology Tree app to read full this article<
Get Radiology Tree app to read full this article<

Get Radiology Tree app to read full this article<
Statistical Analysis
Get Radiology Tree app to read full this article<
Get Radiology Tree app to read full this article<
Get Radiology Tree app to read full this article<
Get Radiology Tree app to read full this article<
Get Radiology Tree app to read full this article<
Results
Get Radiology Tree app to read full this article<
Get Radiology Tree app to read full this article<
Table 1
Histopathologic Diagnosis and Dimensions of Breast Lesions
Malignant Lesions Tumor histology Histologic grade 1 15 2 13 3 7Total35 Tumor type Ductal 31 Lobular 3 Metaplastic 1Total35 Benign Lesions Tumor type Fibroadenoma 34 Intraductal papilloma 4 Complex cyst 7 Hamartoma 4 Tubular adenoma 1 Radial scar 1 Granuloma 2 Other ANDI \* 4Total57 Lesion dimensions (mm) ≥ 5 and < 10 21 ≥ 10 and < 15 28 ≥ 15 and < 20 18 ≥ 20 and < 25 13 ≥ 25 11Total91
Get Radiology Tree app to read full this article<
Get Radiology Tree app to read full this article<
ARFI Quantification
Get Radiology Tree app to read full this article<
Table 2
ARFI Measurements for Benign and Malignant Lesions
Measurement Benign Malignant_P_ Value_n_ = 57n = 35 Inside lesion
(m/s) Mean ± SD 3.8 ± 1.41 8.7 ± 1.49 <0.001 \* Median (IQR) 3.5(2.1) 9.1(1.7) Parenchyma
(m/s) Mean ± SD 2.6 ± 0.65 2.8 ± 0.57 0.160 † Median (IQR) 2.4(0.95) 2.8(0.84) LPR Mean ± SD 1.5 ± 0.52 3.3 ± 1.20 <0.001 \* Median (IQR) 1.4(0.59) 3.0(1.37)
ARFI, acoustic radiation force impulse; IQR, interquartile range; LPR, lesion-to-parenchyma ratio; SD, standard deviation.
Get Radiology Tree app to read full this article<
Get Radiology Tree app to read full this article<
Get Radiology Tree app to read full this article<
Get Radiology Tree app to read full this article<
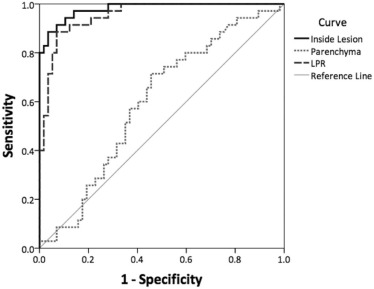
Table 3
AUC, Cutoff, Sensitivity, and Specificity for ARFI Measurements
Measurement AUC (SE)P Value Cutoff Sensitivity (%) Specificity (%) Inside lesion 0.980 (0.011) <0.001 6.593 m/s 88.6 96.5 Parenchyma 0.597 (0.060) 0.118 2.527 m/s 71.4 54.4 LPR 0.954 (0.020) <0.001 2.181 88.6 93.0
ARFI, acoustic radiation force impulse; AUC, area under the curve; LPR, lesion-to-parenchyma ratio; SE, standard error.
Get Radiology Tree app to read full this article<
Comparison between Readers
Get Radiology Tree app to read full this article<
Table 4
BI-RADS Classification by Reader
BI-RADS 3 BI-RADS 4 BI-RADS 5 Reader A (B-mode US) 28 55 9 Reader A (B-mode US + ARFI) 32 51 9 Reader B (B-mode US) 23 60 9 Reader B (B-mode US + ARFI) 40 43 9
ARFI, acoustic radiation force impulse; BI-RADS, Breast Imaging - Reporting and Data System; US, ultrasonography.
Table 5
Sensitivity and Specificity for Each Reader
B-mode US (%) B-mode US + ARFI (%) Reader A Sensitivity 100 100 Specificity 49.1 59.6 Reader B Sensitivity 100 100 Specificity 40.4 70.2
ARFI, acoustic radiation force impulse; US, ultrasonography.
Get Radiology Tree app to read full this article<
Get Radiology Tree app to read full this article<
Discussion
Get Radiology Tree app to read full this article<
Get Radiology Tree app to read full this article<
Get Radiology Tree app to read full this article<
Get Radiology Tree app to read full this article<
Get Radiology Tree app to read full this article<
Get Radiology Tree app to read full this article<
Get Radiology Tree app to read full this article<
Get Radiology Tree app to read full this article<
Get Radiology Tree app to read full this article<
Get Radiology Tree app to read full this article<
Conclusion
Get Radiology Tree app to read full this article<
Acknowledgments
Get Radiology Tree app to read full this article<
Get Radiology Tree app to read full this article<
References
1. Cho N., Jang M., Lyou C.Y., et. al.: Distinguishing benign from malignant masses at breast US: combined US elastography and color Doppler US—influence on radiologist accuracy. Radiology 2012; 262: pp. 80-90. Epub 2011 Nov 14
2. Hooley R.J., Scoutt L.M., Philpotts L.E.: Breast ultrasonography: state of the art. Radiology 2013; 268: pp. 642-659.
3. Berg W.A., Cosgrove D.O., Doré C.J., et. al.: Shear-wave elastography improves the specificity of breast US: the BE1 multinational study of 939 masses. Radiology 2012; 262: pp. 435-449.
4. Chang J.M., Moon W.K., Cho N., et. al.: Breast mass evaluation: factors influencing the quality of US elastography. Radiology 2011; 259: pp. 59-64. Epub 2011 Feb 17
5. Faruk T., Islam M.K., Arefin S., et. al.: The journey of elastography: background, current status, and future possibilities in breast cancer diagnosis. Clin Breast Cancer 2015; 15: pp. 313-324.
6. Shiina T., Nightingale K.R., Palmeri M.L., et. al.: WFUMB guidelines and recommendations for clinical use of ultrasound elastography: part 1: basic principles and terminology. Ultrasound Med Biol 2015; 41: pp. 1126-1147.
7. Navarro B., Úbeda B., Vallespí M., et. al.: Role of elastography in the assessment of breast lesions: preliminary results. J Ultrasound Med 2011; 30: pp. 313-321.
8. Balleyguier C., Canale S., Hassen W.B., et. al.: Breast elasticity: principles, technique, results: an update and overview of commercially available software. Eur J Radiol 2013; 82: pp. 427-434.
9. Youden W.J.: An index for rating diagnostic tests. Cancer 1950; 3: pp. 32-35.
10. Tang L., Xu H.X., Bo X.W., et. al.: A novel two-dimensional quantitative shear wave elastography for differentiating malignant from benign breast lesions. Int J Clin Exp Med 2015; 8: pp. 10920-10928.
11. Park J., Woo O.H., Shin H.S., et. al.: Diagnostic performance and color overlay pattern in shear wave elastography (SWE) for palpable breast mass. Eur J Radiol 2015; 84: pp. 1943-1948.
12. Barr R.G., Zhang Z.: Shear-wave elastography of the breast: value of a quality measure and comparison with strain elastography. Radiology 2015; 275: pp. 45-53.
13. Yao M., Wu J., Zou L., et. al.: Diagnostic value of virtual touch tissue quantification for breast lesions with different size. Biomed Res Int 2014; 2014: pp. 142504.
14. Ng W.L., Rahmat K., Fadzli F., et. al.: Shear wave elastography increases diagnostic accuracy in characterization of breast lesions. Medicine (Baltimore) 2016; 95: pp. e3146.
15. Lee S.H., Cho N., Chang J.M., et. al.: Two-view versus single-view shear-wave elastography: comparison of observer performance in differentiating benign from malignant breast masses. Radiology 2014; 270: pp. 344-353.
16. Athanasiou A., Tardivon A., Tanter M., et. al.: Breast lesions: quantitative elastography with supersonic shear imaging—preliminary results. Radiology 2010; 256: pp. 297-303.
17. Evans A., Sim Y.T., Thomson K., et. al.: Shear wave elastography of breast cancer: sensitivity according to histological type in a large cohort. Breast 2016; 26: pp. 115-118.
18. Kapetas P., Pinker-Domenig K., Woitek R., et. al.: Clinical application of acoustic radiation force impulse imaging with virtual touch IQ in breast ultrasound: diagnostic performance and reproducibility of a new technique. Acta Radiol 2016; Epub ahead of print; 0284185116641347[pii]
19. Giannotti E., Vinnicombe S., Thomson K., et. al.: Shear-wave elastography and greyscale assessment of palpable probably benign masses: is biopsy always required?. Br J Radiol 2016; 89: pp. 20150865.