
Rationale and Objectives
This prospective study aimed to evaluate the diagnostic performance of dual-input computed tomography perfusion technique (DI-CTP) in identifying the bronchial-pulmonary artery fistula in patients tuberculosis with massive hemoptysis.
Material and Methods
Twenty patients with tuberculosis with massive hemoptysis were enrolled from January 2015 to December 2015. The association between DI-CTP parameters and the diagnostic outcomes of digital subtraction angiography was assessed. Diagnostic efficacy of DI-CTP was evaluated by receiver operating curve (ROC) analyses using the diagnostic outcomes of digital subtraction angiography, which is the gold standard for identifying bronchial-pulmonary artery fistula.
Results
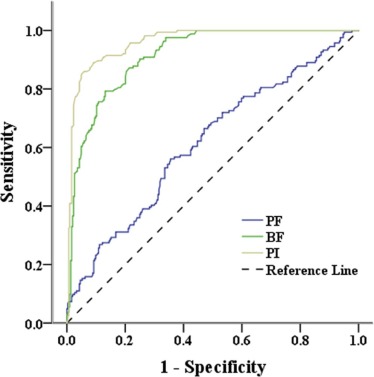
Compared to lung segments with normal blood flow ( n = 304), those with bronchial-pulmonary artery fistula ( n = 164) had a reduced pulmonary flow value, perfusion index (PI) value, and an elevated bronchial artery (BF) value in the DI-CTP scan, which was further confirmed by multivariate logistic regression. ROC analysis showed that PI and bronchial artery has an excellent diagnostic performance (both area under the ROC curve > 0.9, P < .001) and high sensitivity and specificity (from 0.79 to 0.95 at the optimal cutoff). PI has the best diagnostic performance, with an overall diagnostic accuracy of 0.91.
Conclusions
DI-CTP scan possesses the diagnostic value for detecting bronchial-pulmonary artery fistula in patients with tuberculosis with massive hemoptysis, providing an alternative diagnostic method.
Introduction
Massive hemoptysis is a life-threatening condition which is most frequently defined as the expectoration of an amount of blood >300 mL within a period of 24 hours . Tuberculosis is one of the most common causes of hemoptysis , and bronchial-pulmonary artery fistula is an important pathologic mechanism for massive hemoptysis in patients with tuberculosis .
Conventional diagnostic methods for hemoptysis include chest radiography, bronchoscopy, multidetector computed tomography (CT) angiography (MDCTA), and digital subtraction angiography (DSA) . Chest radiography and bronchoscopy are considered to be the primary methods for diagnosis of hemoptysis and for identifying the source of bleeding, but both the sensitivities are relatively low . MDCTA can provide a comprehensive assessment of pulmonary vascular morphology and the potential causes of hemoptysis before bronchial arterial embolization (BAE) . However, the sensitivity of MDCTA for identifying bronchial-pulmonary artery fistula is relatively low because it is incapable of dynamically showing the abnormal blood flow in the bronchial and pulmonary artery and vein fistula, as well as simultaneously displaying the fine vascular structures in the pulmonary artery, pulmonary vein, and bronchial artery . Currently, DSA is the gold standard for identifying bronchial-pulmonary artery fistula . Nevertheless, DSA is limited by its invasiveness and high cost. Therefore, it is required to develop an alternative or auxiliary diagnostic method for locating the bronchial-pulmonary artery fistula in patients with massive hemoptysis.
Get Radiology Tree app to read full this article<
Materials and Methods
Participants
Get Radiology Tree app to read full this article<
DI-CTP Imaging Technique
Get Radiology Tree app to read full this article<
Get Radiology Tree app to read full this article<
Get Radiology Tree app to read full this article<
Get Radiology Tree app to read full this article<
Get Radiology Tree app to read full this article<
Digital Subtraction Angiography (DSA)
Get Radiology Tree app to read full this article<
Get Radiology Tree app to read full this article<
Statistical Analysis
Get Radiology Tree app to read full this article<
Results
Patients’ Demographic and Clinical Characteristics
Get Radiology Tree app to read full this article<
TABLE 1
Patients’ Demographic and Clinical Characteristics
No Gender Age (y) Pathological Type Length of Disease Course (mo) Daily Hemoptysis Amount (mL) 1 Male 39 Chronic fibrous cavitary pulmonary tuberculosis 60 30 2 Male 55 Chronic fibrous cavitary pulmonary tuberculosis 12 100 3 Male 49 Infiltrative pulmonary tuberculosis 120 600 4 Male 66 Infiltrative pulmonary tuberculosis 3 100 5 Male 29 Infiltrative pulmonary tuberculosis 48 500 6 Male 38 Chronic fibrous cavitary pulmonary tuberculosis 120 450 7 Male 53 Infiltrative pulmonary tuberculosis 120 200 8 Male 45 Tuberculous pleurisy 24 300 9 Male 49 Infiltrative pulmonary tuberculosis 12 500 10 Male 57 Infiltrative pulmonary tuberculosis 108 600 11 Male 46 Infiltrative pulmonary tuberculosis 48 400 12 Male 57 Infiltrative pulmonary tuberculosis 24 400 13 Male 26 Infiltrative pulmonary tuberculosis 7 400 14 Female 52 Chronic fibrous cavitary pulmonary tuberculosis 240 600 15 Female 17 Acute miliary tuberculosis 4 100 16 Female 53 Infiltrative pulmonary tuberculosis 24 150 17 Male 43 Infiltrative pulmonary tuberculosis 24 400 18 Male 61 Infiltrative pulmonary tuberculosis 144 150 19 Male 39 Chronic fibrous cavitary pulmonary tuberculosis 60 30 20 Male 33 Infiltrative pulmonary tuberculosis 24 50
Get Radiology Tree app to read full this article<
Association Between DI-CTP Parameters and DSA Diagnosis
Get Radiology Tree app to read full this article<
TABLE 2
Comparisons of the DI-CTP Parameters Between Normal and Bronchial-Pulmonary Artery Fistula Groups
DI-CTP Parameters Normal Group \* ( n = 229) Bronchial-Pulmonary Artery Fistula Group \* ( n = 131) Total_P_ PF 153.82 ± 63.39 129.29 ± 57.55 144.90 ± 62.38 <.001 BF 5.74 ± 12.34 30.69 ± 32.44 14.82 ± 24.94 <.001 PI 97.18 ± 4.68 84.52 ± 8.35 92.57 ± 8.74 <.001
BF, bronchial flow; DI-CTP, dual-input computed tomography perfusion; PF, pulmonary flow; PI, perfusion index.
Get Radiology Tree app to read full this article<
TABLE 3
The Results of Univariate and Multivariate Logistic Regression
DI-CTP Parameters OR (95% CI)P Univariate PF 0.99 (0.99–1.00) <.001 BF 1.11 (1.08–1.14) <.001 PI 0.69 (0.64–0.74) <.001 Multivariate \* PF 0.99 (0.99–1.00) <.001 BF 1.14 (1.10–1.17) <.001 PI 0.66 (0.61–0.72) <.001
BF, bronchial flow; CI, confidence interval; DI-CTP, dual-input computed tomography perfusion; OR, odds ratio; PF, pulmonary flow; PI, perfusion index.
Get Radiology Tree app to read full this article<
Get Radiology Tree app to read full this article<
ROC Analyses for Diagnostic Efficacy of DI-CTP Parameters
Get Radiology Tree app to read full this article<
TABLE 4
The Results of ROC Analyses and Likelihoods
DI-CTP Parameters AUC (95% CI)P Optimal Cutoff \* Sensitivity Specificity Youden Index PPV NPV PLR NLR Accuracy PF 0.616 (0.556–0.676) <.001 87.5 0.27 0.87 0.14 0.54 0.67 2.04 0.84 0.65 BF 0.901 (0.870–0.932) <.001 9.1 0.82 0.83 0.65 0.73 0.89 4.84 0.21 0.83 PI 0.955 (0.934–0.976) <.001 92.75 0.88 0.93 0.81 0.88 0.93 12.56 0.13 0.91
AUC, area under the ROC curve; BF, bronchial flow; DI-CTP, dual-input computed tomography perfusion; NLR, negative likelihood ratio; NPV, negative-predicted value; PF, pulmonary flow; PI, perfusion index; PLR, positive likelihood ratio; PPV, positive-predicted value.
Get Radiology Tree app to read full this article<
Get Radiology Tree app to read full this article<
Discussion
Get Radiology Tree app to read full this article<
Get Radiology Tree app to read full this article<
Get Radiology Tree app to read full this article<
Get Radiology Tree app to read full this article<
Get Radiology Tree app to read full this article<
Conclusion
Get Radiology Tree app to read full this article<
Get Radiology Tree app to read full this article<
References
1. Sopko D.R., Smith T.P.: Bronchial artery embolization for hemoptysis. Semin Intervent Radiol 2011; 28: pp. 48-62.
2. Larici A.R., Franchi P., Occhipinti M., et. al.: Diagnosis and management of hemoptysis. Diagn Interv Radiol 2014; 20: pp. 299-309.
3. Muthuswamy P.P., Akbik F., Franklin C., et. al.: Management of major or massive hemoptysis in active pulmonary tuberculosis by bronchial arterial embolization. Chest 1987; 92: pp. 77-82.
4. Ittrich H., Klose H., Adam G.: Radiologic management of haemoptysis: diagnostic and interventional bronchial arterial embolisation. Röfo 2014; 187: pp. 248-259.
5. Revel M.P., Fournier L.S., Hennebicque A.S., et. al.: Can CT replace bronchoscopy in the detection of the site and cause of bleeding in patients with large or massive hemoptysis?. AJR Am J Roentgenol 2002; 179: pp. 1217-1224.
6. Hirshberg B., Biran I., Glazer M., et. al.: Hemoptysis: etiology, evaluation, and outcome in a tertiary referral hospital. Chest 1997; 112: pp. 440-444.
7. Remy-Jardin M., Bouaziz N., Dumont P., et. al.: Bronchial and nonbronchial systemic arteries at multi-detector row CT angiography: comparison with conventional angiography. Radiology 2004; 233: pp. 741-749.
8. Khalil A., Fartoukh M., Tassart M., et. al.: Role of MDCT in identification of the bleeding site and the vessels causing hemoptysis. AJR Am J Roentgenol 2007; 188: pp. W117-W125.
9. Noë G.D., Jaffé S.M., Molan M.P.: CT and CT angiography in massive haemoptysis with emphasis on pre-embolization assessment. Clin Radiol 2011; 66: pp. 869-875.
10. Miles K.A., Hayball M.P., Dixon A.K.: Functional images of hepatic perfusion obtained with dynamic CT. Radiology 1993; 188: pp. 405-411.
11. Xia J., Broadhurst D.I., Wilson M., et. al.: Translational biomarker discovery in clinical metabolomics: an introductory tutorial. Metabolomics 2013; 9: pp. 280-299.
12. Fluss R., Faraggi D., Reiser B.: Estimation of the Youden index and its associated cutoff point. Biom J 2005; 47: pp. 458-472.
13. Chun J.Y., Morgan R., Belli A.M.: Radiological management of hemoptysis: a comprehensive review of diagnostic imaging and bronchial arterial embolization. Cardiovasc Intervent Radiol 2010; 33: pp. 240-250.
14. Yoon W., Kim J.K., Kim Y.H., et. al.: Bronchial and nonbronchial systemic artery embolization for life-threatening hemoptysis: a comprehensive review. Radiographics 2002; 22: pp. 1395-1409.
15. Yuan X., Zhang J., Ao G., et. al.: Lung cancer perfusion: can we measure pulmonary and bronchial circulation simultaneously?. Eur Radiol 2012; 22: pp. 1665-1671.