
Rationale and Objectives
This study aimed to collect the studies on the role of dynamic contrast-enhanced magnetic resonance imaging (DCE-MRI) and dynamic susceptibility contrast MRI (DSC-MRI) in differentiating the grades of gliomas, and evaluate the diagnostic performances of relevant quantitative parameters in glioma grading.
Materials and Methods
We systematically searched studies on the diagnosis of gliomas with DCE-MRI or DSC-MRI in Medline, PubMed, China National Knowledge Infrastructure database, Cochrane Library, and Embase published between January 2005 and December 2016. Standardized mean differences and 95% confidence intervals were calculated for volume transfer coefficient (K trans ), volume fraction of extravascular extracellular space (V e ), rate constant of backflux (K ep ), relative cerebral blood volume (rCBV), and relative cerebral blood flow (rCBF) using Review Manager 5.2 software. Sensitivity, specificity, area under the curve (AUC), and Begg test were calculated by Stata 12.0.
Results
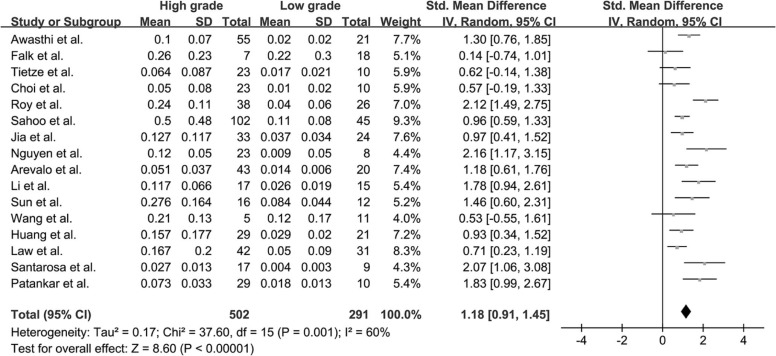
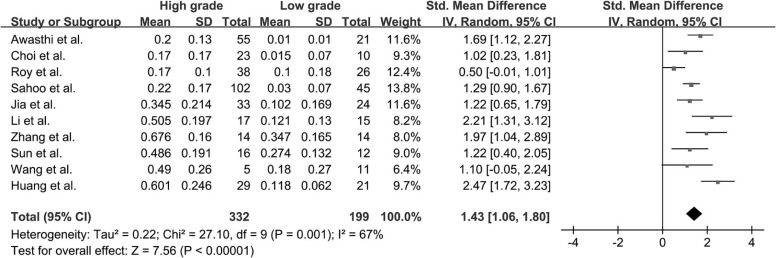
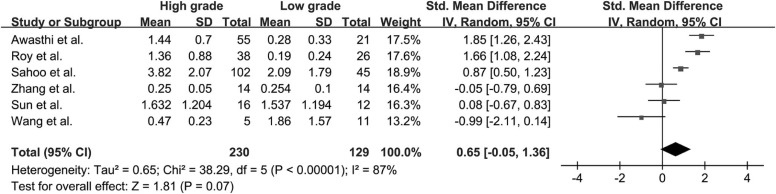
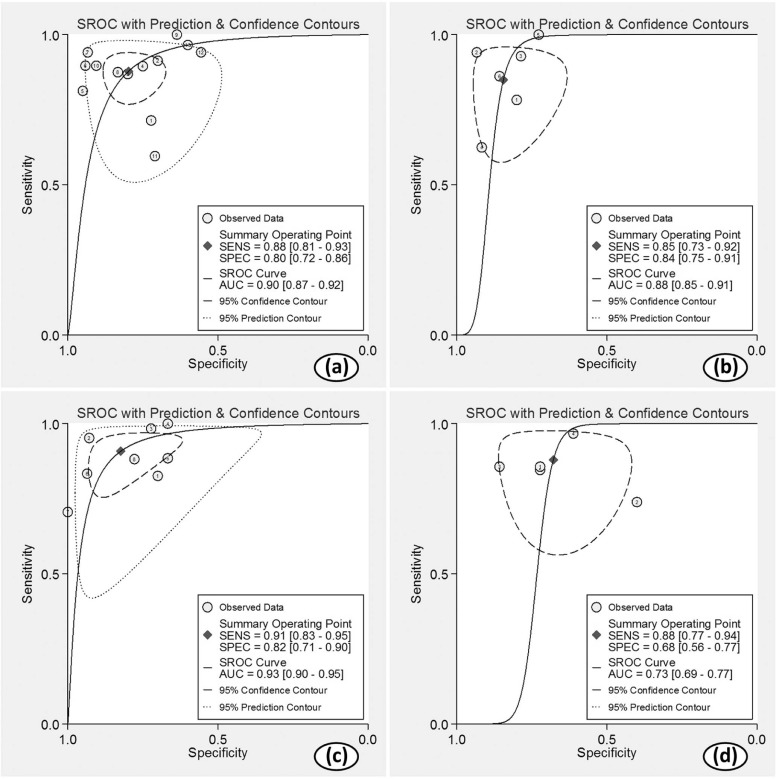
Twenty-two studies with available outcome data were included in the analysis. The standardized mean difference of K trans values between high-grade glioma and low-grade glioma were 1.18 (0.91, 1.45); V e values were 1.43 (1.06, 1.80); K ep values were 0.65 (−0.05, 1.36); rCBV values were 1.44 (1.08, 1.81); and rCBF values were 1.17 (0.68, 1.67), respectively. The results were all significant statistically ( P < .05) except K ep values ( P = .07), and high-grade glioma had higher K trans , V e , rCBV, and rCBF values than low-grade glioma. AUC values of K trans , V e , rCBV, and rCBF were 0.90, 0.88, 0.93, and 0.73, respectively; rCBV had the largest AUC among the four parameters ( P < .05).
Conclusion
Both DCE-MRI and DSC-MRI are reliable techniques in differentiating the grades of gliomas, and rCBV was found to be the most sensitive one.
Introduction
Gliomas are the most common primary malignant tumors of the central nervous system. According to the 2016 World Health Organization (WHO) classification of tumors of the central nervous system , gliomas are divided into four grades based on their histology and molecular features. Accurate grading of gliomas is critical to the determination of surgery scheme, treatment response, and prognostic evaluation. On pathology, low-grade gliomas (LGGs) are slowly proliferating tumors that display cytological atypia but no signs of anaplasia, endothelial cell proliferation, or brisk mitotic activity . However, in high-grade gliomas (HGGs), substantial hyperplasia of anomalous cells can be observed, resulting in neovascularization and incomplete basement membrane of tumor neovasculature, which in turns leads to augmentation of microvascular permeability, a histologic marker of HGG . Furthermore, the abnormal vessels of tumors are usually tortuous and disorganized. The resultant disordered cerebral hemodynamics alter blood volume and blood flow directly.
Conventional morphologic magnetic resonance imaging (MRI) can estimate benign and malignant tumors based grossly on the range of cytotoxic edema, hemorrhage, necrosis, signal intensity heterogeneity, and degree of enhancement. However, it has been reported that 9.5% HGG showed no enhancement, whereas 22.72% of LGG enhanced after contrast administration . Therefore, quantitative and reliable imaging methods are needed. Dynamic contrast-enhanced MRI (DCE-MRI) is a noninvasive technology that provides information about the microcirculation of tumors. It assesses several valuable parameters including volume transfer coefficient (K trans ), volume fraction of extravascular extracellular space (V e ), and rate constant of backflux (K ep ), all of which can reflect the permeability of new vessels and are indicative of malignant grade of tumors . Dynamic susceptibility contrast MRI (DSC-MRI) is another advanced technique that provides perfusion information with parameters such as cerebral blood volume (CBV) and cerebral blood flow (CBF). Increased tumor vascularity and tumor grade correlate credibly with relative CBV (rCBV) and relative CBF (rCBF) .
Get Radiology Tree app to read full this article<
Materials and Methods
Data Sources
Get Radiology Tree app to read full this article<
Studies Selection
Get Radiology Tree app to read full this article<
Data Abstraction and Quality Assessment
Get Radiology Tree app to read full this article<
Data Synthesis
Get Radiology Tree app to read full this article<
Results
Literature Search and Selection of Studies
Get Radiology Tree app to read full this article<
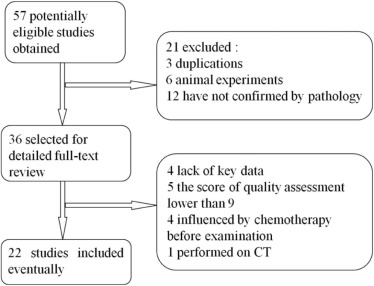
TABLE 1
Characteristics of Studies Included in the Meta-analysis
Author Year Machine Type Country Age (y) Type (Count) Journal Quality Assessment Awasthi et al. 2012 1.5T GE India 16–65 I + II (21), III +IV (55) Neuroradiology 12 Falk et al. 2014 3T Philips Sweden 22–79 II(18), III(7) Neuroradiology 10 Tietze et al. 2015 3T Philips Denmark NA II(10), IV(23) Neuroradiology 13 Choi et al. 2013 3T Philips Korea 51.79 ± 18.34 I (1), II(9), III(8), IV(15) Korean J Radiol 10 Roy et al. 2013 3T GE India 43 I(3), II(23),III (9), IV(29) J Comput Assist Tomogr 13 Sahoo et al. 2013 1.5T GE India 21–63 I + II (45), III + IV (102) J Magn Reson Imaging 13 Jia et al. 2015 3T Siemens China 46 ± 12 II (24), III (7), IV (26) Eur J Radiol 14 Nguyen et al. 2012 1.5T Siemens Canada NA II (8), III (4), IV (19) Am J Neuroradiol 12 Arevalo-Perez et al. 2015 1.5T GE USA 54.3 II (20), III (10), IV (33) J Neuroimaging 11 Li et al. 2015 3T Siemens China 42.6 ± 14.3 I + II (15), III (8), IV (9) Cancer Imaging 10 Zhang et al. 2012 1.5T Siemens China 47.11 ± 14.18 I (8), II (6), III (6), IV (8) J Magn Reson Imaging 13 Sun et al. 2015 3T GE China 45.7(14–73) I (2), II (10), III (7), IV (9) Acta acad Med sin 12 Wang et al. 2015 3T Siemens China 12.7 ± 4.6 I + II (11), III + IV (5) Chin J Med Imaging Technol 9 Huang et al. 2015 3T Siemens China 45(17–72) I (2), II (34), III (21), IV (28) J Third Mil Med Univ 9 Server et al. 2011 3T GE Norway 57.73 ± 12.95 II (18), III (14), IV (47) Neuroradiology 14 de Fatima Vasco Aragao et al. 2014 1.5T GE Brazil 36.23 ± 16.95 I + II (9), III + IV (20) Am J Neuroradiol 13 Direksunthorn et al. 2013 3T Philips Thailand 45.9(12–74) I + II (18), III + IV (26) J Med Assoc Thai 9 Law et al. 2006 1.5T Siemens USA 42(4–85) II (31), III (16), IV (26) Am J Neuroradiol 11 Santarosa et al. 2016 3T Philips Italy 55.4(22–79) II (9), III (4), IV (13) Eur J Radiol 13 Kim et al. 2013 3T Siemens Korea NA II (9), III (16), IV (38) PLOS ONE 9 Patankar et al. 2005 1.5T Philips UK 52.9(31–77) II (10), III (6), IV (23) Am J Neuroradiol 10 Boxerman et al. 2006 1.5T GE USA 52(19–80) II (11), III (9), IV (23) Am J Neuroradiol 12
NA, not available.
TABLE 2
The Specific Parameters of DCE- and DSC-MRI of the Included Studies
Study DCE Sequence Model Leakage Correction of rCBV DSC Sequence Contrast Type Flow rate Dose OA/OG Post-Processing Software Awasthi et al. 3D-SPGR Pharmacokinetic model Corrected NA Omniscan 5 mL/s 0.2 mmol/kg NA NA Falk et al. T1W SPGR Tikhonov method NA T2*W SS-GE-EPI Gadovist 3 mL/s 0.05 mmol/kg 7/8 MATLAB Tietze et al. Turbo FLASH extended two compartment exchange model Corrected NA Gadovist 2.5 mL/s 0.05 mmol/kg 0/6 SPM8 and MATLAB Choi et al. NA classic Tofs-Kermode model NA NA Gadovist 2 mL/s 0.1 mmol/kg 3/2 PRIDE tools(Philips Medical Systems) Roy et al. 3D-SPGR Pharmacokinetic model Corrected NA Omniscan 5 mL/s NA NA NA Sahoo et al. 3D-FSPGR leaky tracer kinetic model NA NA Gd-DTPA 5 mL/s 0.2 mmol/kg NA in-house-developed software Jia et al. NA classic Tofs-Kermode model NA NA Omniscan 4 mL/s 0.1 mmol/kg 5/8 Tissue-4D software(Siemens Syngo) Nguyen et al. 2D FLASH Phase-Derived VIF with Bookend T1 Correction NA NA Magnevist 4 mL/s 0.1 mmol/kg 3/1 NordicICE software Arevalo-Perez et al. 3D-SPGR classic Tofs-Kermode model NA NA Magnevist 2–3 mL/s 0.2 mmol/kg 4/6 NordicICE software Li et al. T1-twist classic Tofs-Kermode model NA NA Omniscan 4 mL/s 0.1 mmol/kg 2/6 Tissue-4D software(Siemens Syngo) Zhang et al. 3D Turbo FLASH modified Tofts’ two compartment model NA NA Gd-DTPA 4 mL/s 0.1 mmol/kg NA MATLAB Sun et al. NA extended Tofts Linear model NA NA Omniscan 2 mL/s 0.1 mmol/kg 6/1 Omni Kinetics(GE) Wang et al. T1-twist classic Tofs-Kermode model NA NA Gd-DTPA 2–3 mL/s 0.1 mmol/kg 0/0 Tissue-4D software(Siemens Syngo) Huang et al. T1-twist classic Tofs-Kermode model NA T2W SE-EPI Gd-DTPA 4 mL/s 0.1 mmol/kg NA Tissue-4D software(Siemens Syngo) Server et al. NA NA NA T2*W SS-GE-EPI Magnevist 5 mL/s 18 ml 3/2 NordicICE software de Fatima Vasco Aragao et al. SE NA Corrected NA Magnevist 4 mL/s 0.1 mmol/kg 0/0 FuncTool (GE AW4.2 workstation) Direksunthorn et al. NA NA NA 3D-PRESTO Gadovist 4–5 mL/s NA NA proprietary analytic software((Philip) Law et al. NA classic Tofs-Kermode model Corrected GE-EPI Magnevist 5 mL/s 0.1 mmol/kg 0/10 in-house-developed software Santarosa et al. GE classic Tofs-Kermode model Corrected T2*W GE-EPI Gadovist 2–5 mL/s 10 ml 4/3 NordicICE software Kim et al. NA NA Corrected SS-GE-EPI Gadovist 4 mL/s 0.1 mmol/kg 0/0 NordicICE software Patankar et al. 3D T1 FFE biexponential model of PCCF Corrected NA Omniscan NA 0.1 mmol/kg NA in-house-developed software Boxerman et al. NA NA Corrected SS-GE-EPI Omniscan 3–5 mL/s 0.15–0.25 mmol/kg 2/5 NA
DCE, dynamic contrast-enhanced; DSC, dynamic susceptibility contrast; EPI, echo planar imaging; FFE, fast-field echo sequence; FLASH, fast low angle shot; FSPGR, fast spoiled gradient echo images; GE, gradient echo; NA, Not available; OA, oligoastrocytomas; OG, oligodendrogliomas; SS, single shot.
Get Radiology Tree app to read full this article<
Quantitative Analysis
K trans
Get Radiology Tree app to read full this article<
Get Radiology Tree app to read full this article<
V e
Get Radiology Tree app to read full this article<
Get Radiology Tree app to read full this article<
K ep
Get Radiology Tree app to read full this article<
Get Radiology Tree app to read full this article<
rCBV
Get Radiology Tree app to read full this article<
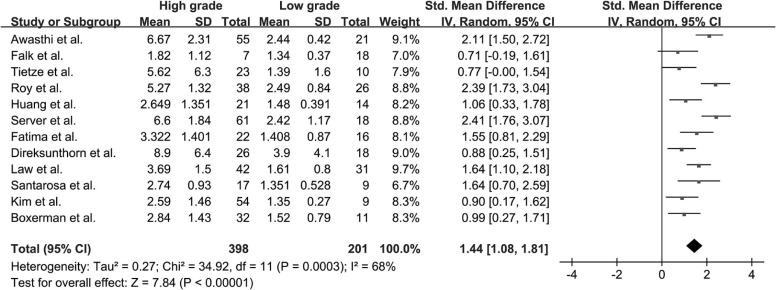
Get Radiology Tree app to read full this article<
rCBF
Get Radiology Tree app to read full this article<
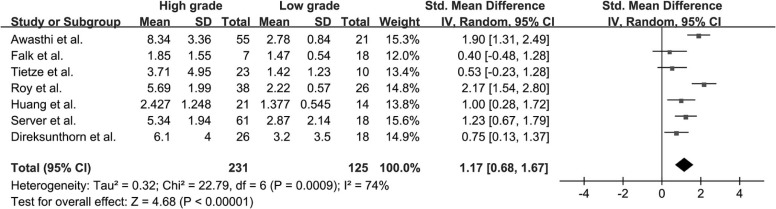
Get Radiology Tree app to read full this article<
Diagnosis Values
Get Radiology Tree app to read full this article<
TABLE 3
Diagnosis Values of K trans , V e , rCBV, and rCBF
Index Combined Studies Sensitivity (95% CI) Specificity (95% CI) PLR (95% CI) NLR (95% CI) DOR (95% CI) AUC (95% CI) I 2 Sensitivity Specificity K trans 13 0.88(0.81,0.93) 0.80(0.72,0.86) 4.3(3.0,6.2) 0.15(0.09,0.25) 28(14,58) 0.90(0.87,0.92) 63.80% 39.88% V e 6 0.85(0.73,0.92) 0.84(0.75,0.91) 5.5(3.3,9.2) 0.18(0.09,0.34) 31(12,78) 0.88(0.85,0.91) 44.87% 0 rCBV 8 0.91(0.83,0.95) 0.82(0.71,0.90) 5.1(3.1,8.6) 0.11(0.06,0.20) 46(23,94) 0.93(0.90,0.95) 61.22% 42.05% rCBF 5 0.88(0.77,0.94) 0.68(0.56,0.77) 2.7(1.9,3.9) 0.18(0.09,0.36) 15(6,40) 0.73(0.69,0.77) 57.33% 36.16%
AUC, area under the curve; CI, confidence interval; DOR, diagnostic odds ratio; K trans , volume transfer coefficient; NLR, negative likelihood ratio; PLR, positive likelihood ratio; rCBF, relative cerebral blood flow; rCBV, relative cerebral blood volume; V e , volume fraction of extravascular extracellular space.
K trans ; V e ; rCBV ; rCBF . K ep was not listed because no statistic difference was seen in SMD.
Get Radiology Tree app to read full this article<
Sensitivity Analysis
Get Radiology Tree app to read full this article<
Discussion
Get Radiology Tree app to read full this article<
Get Radiology Tree app to read full this article<
Get Radiology Tree app to read full this article<
Get Radiology Tree app to read full this article<
Get Radiology Tree app to read full this article<
Get Radiology Tree app to read full this article<
Get Radiology Tree app to read full this article<
Limitations
Get Radiology Tree app to read full this article<
Conclusions
Get Radiology Tree app to read full this article<
Get Radiology Tree app to read full this article<
Get Radiology Tree app to read full this article<
References
1. Louis D.N., Perry A., Reifenberger G., et. al.: The 2016 World Health Organization Classification of Tumors of the Central Nervous System: a summary. Acta Neuropathol 2016; 131: pp. 803-820. https://doi.org/10.1007/s00401-016-1545-1
2. Falk A., Fahlstrom M., Rostrup E., et. al.: Discrimination between glioma grades II and III in suspected low-grade gliomas using dynamic contrast-enhanced and dynamic susceptibility contrast perfusion MR imaging: a histogram analysis approach. Neuroradiology 2014; 56: pp. 1031-1038. https://doi.org/10.1007/s00234-014-1426-z
3. Zhang N., Zhang L., Qiu B., et. al.: Correlation of volume transfer coefficient Ktrans with histopathologic grades of gliomas. J Magn Reson Imaging 2012; 36: pp. 355-363. https://doi.org/10.1002/jmri.23675
4. Haris M., Husain N., Singh A., et. al.: Dynamic contrast-enhanced derived cerebral blood volume correlates better with leak correction than with no correction for vascular endothelial growth factor, microvascular density, and grading of astrocytoma. J Comput Assist Tomogr 2008; 32: pp. 955-965. https://doi.org/10.1097/RCT.0b013e31816200d1
5. Hussain N.S., Moisi M.D., Keogh B., et. al.: Dynamic susceptibility contrast and dynamic contrast-enhanced MRI characteristics to distinguish microcystic meningiomas from traditional Grade I meningiomas and high-grade gliomas. J Neurosurg 2016; pp. 1-7. https://doi.org/10.3171/2016.3.JNS14243
6. Law M., Young R., Babb J., et. al.: Comparing perfusion metrics obtained from a single compartment versus pharmacokinetic modeling methods using dynamic susceptibility contrast-enhanced perfusion MR imaging with glioma grade. AJNR Am J Neuroradiol 2006; 27: pp. 1975-1982.
7. Patankar T.F., Haroon H.A., Mills S.J., et. al.: Is volume transfer coefficient (K(trans)) related to histologic grade in human gliomas?. AJNR Am J Neuroradiol 2005; 26: pp. 2455-2465.
8. Sun S.J., Qian H.F., Li F.Q., et. al.: Diagnostic value of combining permeability with T1 perfusion parameters in quantitative dynamic contrast-enhanced magnetic resonance imaging for glioma grading. Acta Academiae Medicinae Sinicae 2015; 37: pp. 674-680. https://doi.org/10.3881/j.issn.1000-503X.2015.06.007
9. Wang J.L., Fan M., Chu J.P., et. al.: Application of parameters of dynamic contrast-enhanced MRI and ADC in grading pediatric gliomas. Chin J Med Imaging Technol 2015; 31: pp. 678-682.
10. Awasthi R., Rathore R.K., Soni P., et. al.: Discriminant analysis to classify glioma grading using dynamic contrast-enhanced MRI and immunohistochemical markers. Neuroradiology 2012; 54: pp. 205-213. https://doi.org/10.1007/s00234-011-0874-y
11. Roy B., Awasthi R., Bindal A., et. al.: Comparative evaluation of 3-dimensional pseudocontinuous arterial spin labeling with dynamic contrast-enhanced perfusion magnetic resonance imaging in grading of human glioma. J Comput Assist Tomogr 2013; 37: pp. 321-326. https://doi.org/10.1097/RCT.0b013e318282d7e2
12. Hu Q., Wang X.Y., Zhu S.Y., et. al.: Meta-analysis of contrast-enhanced ultrasound for the differentiation of benign and malignant breast lesions. Acta Radiol 2015; 56: pp. 25-33. https://doi.org/10.1177/0284185113517115
13. Louis D.N., Ohgaki H., Wiestler O.D., et. al.: The 2007 WHO classification of tumours of the central nervous system. Acta Neuropathol 2007; 114: pp. 97-109. https://doi.org/10.1007/s00401-007-0243-4
14. Whiting P.F., Rutjes A.W., Westwood M.E., et. al.: QUADAS-2: a revised tool for the quality assessment of diagnostic accuracy studies. Ann Intern Med 2011; 155: pp. 529-536. https://doi.org/10.7326/0003-4819-155-8-201110180-00009
15. Tietze A., Mouridsen K., Mikkelsen I.K.: The impact of reliable prebolus T 1 measurements or a fixed T 1 value in the assessment of glioma patients with dynamic contrast enhancing MRI. Neuroradiology 2015; 57: pp. 561-572. https://doi.org/10.1007/s00234-015-1502-z
16. Choi H.S., Kim A.H., Ahn S.S., et. al.: Glioma grading capability: comparisons among parameters from dynamic contrast-enhanced MRI and ADC value on DWI. Korean J Radiol 2013; 14: pp. 487-492. https://doi.org/10.3348/kjr.2013.14.3.487
17. Sahoo P., Rathore R.K., Awasthi R., et. al.: Subcompartmentalization of extracellular extravascular space (EES) into permeability and leaky space with local arterial input function (AIF) results in improved discrimination between high- and low-grade glioma using dynamic contrast-enhanced (DCE) MRI. J Magn Reson Imaging 2013; 38: pp. 677-688. https://doi.org/10.1002/jmri.24021
18. Jia Z.Z., Gu H.M., Zhou X.J., et. al.: The assessment of immature microvascular density in brain gliomas with dynamic contrast-enhanced magnetic resonance imaging. Eur J Radiol 2015; 84: pp. 1805-1809. https://doi.org/10.1016/j.ejrad.2015.05.035
19. Nguyen T.B., Cron G.O., Mercier J.F., et. al.: Diagnostic accuracy of dynamic contrast-enhanced MR imaging using a phase-derived vascular input function in the preoperative grading of gliomas. AJNR Am J Neuroradiol 2012; 33: pp. 1539-1545. https://doi.org/10.3174/ajnr.A3012
20. Arevalo-Perez J., Peck K.K., Young R.J., et. al.: Dynamic contrast-enhanced perfusion MRI and diffusion-weighted imaging in grading of gliomas. J Neuroimaging 2015; 25: pp. 792-798. https://doi.org/10.1111/jon.12239
21. Li X., Zhu Y., Kang H., et. al.: Glioma grading by microvascular permeability parameters derived from dynamic contrast-enhanced MRI and intratumoral susceptibility signal on susceptibility weighted imaging. Cancer Imaging 2015; 15: pp. 4. https://doi.org/10.1186/s40644-015-0039-z
22. Huang J., Li X.G., Kang H.Y., et. al.: Dynamic contrast enhanced magnetic resonance imaging and dynamic susceptibility contrast magnetic resonance imaging in grading of glioma. J Third Mil Med Univ 2015; 37: pp. 672-677.
23. Server A., Graff B.A., Orheim T.E., et. al.: Measurements of diagnostic examination performance and correlation analysis using microvascular leakage, cerebral blood volume, and blood flow derived from 3T dynamic susceptibility-weighted contrast-enhanced perfusion MR imaging in glial tumor grading. Neuroradiology 2011; 53: pp. 435-447. https://doi.org/10.1007/s00234-010-0770-x
24. de Fatima Vasco Aragao M., Law M., Batista de Almeida D., et. al.: Comparison of perfusion, diffusion, and MR spectroscopy between low-grade enhancing pilocytic astrocytomas and high-grade astrocytomas. AJNR Am J Neuroradiol 2014; 35: pp. 1495-1502. https://doi.org/10.3174/ajnr.A3905
25. Direksunthorn T., Chawalparit O., Sangruchi T., et. al.: Diagnostic performance of perfusion MRI in differentiating low-grade and high-grade gliomas: advanced MRI in glioma, A Siriraj project. J Med Assoc Thai 2013; 96: pp. 1183-1190.
26. Santarosa C., Castellano A., Conte G.M., et. al.: Dynamic contrast-enhanced and dynamic susceptibility contrast perfusion MR imaging for glioma grading: Preliminary comparison of vessel compartment and permeability parameters using hotspot and histogram analysis. Eur J Radiol 2016; 85: pp. 1147-1156. https://doi.org/10.1016/j.ejrad.2016.03.020
27. Kim H., Choi S.H., Kim J.H., et. al.: Gliomas: application of cumulative histogram analysis of normalized cerebral blood volume on 3 T MRI to tumor grading. PLoS ONE 2013; 8: e63462 https://doi.org/10.1371/journal.pone.0063462
28. Boxerman J.L., Schmainda K.M., Weisskoff R.M.: Relative cerebral blood volume maps corrected for contrast agent extravasation significantly correlate with glioma tumor grade, whereas uncorrected maps do not. AJNR Am J Neuroradiol 2006; 27: pp. 859-867.
29. Xyda A., Haberland U., Klotz E., et. al.: Brain volume perfusion CT performed with 128-detector row CT system in patients with cerebral gliomas: a feasibility study. Eur Radiol 2011; 21: pp. 1811-1819. https://doi.org/10.1007/s00330-011-2150-2
30. Grabner G., Kiesel B., Wohrer A., et. al.: Local image variance of 7 Tesla SWI is a new technique for preoperative characterization of diffusely infiltrating gliomas: correlation with tumour grade and IDH1 mutational status. Eur Radiol 2017; 27: pp. 1556-1567. https://doi.org/10.1007/s00330-016-4451-y
31. Jimenez-Heffernan J.A., Freih Fraih A., Alvarez F., et. al.: Cytologic features of pleomorphic xanthoastrocytoma, WHO grade II. A comparative study with glioblastoma. Diagn Cytopathol 2017; 45: pp. 339-344. https://doi.org/10.1002/dc.23660
32. Jia Z.Z., Geng D.Y., Liu Y., et. al.: Microvascular permeability of brain astrocytoma with contrast-enhanced magnetic resonance imaging: correlation analysis with histopathologic grade. Chin Med J 2013; 126: pp. 1953-1956.
33. Zhang L., Kundu S., Feenstra T., et. al.: Pleiotrophin promotes vascular abnormalization in gliomas and correlates with poor survival in patients with astrocytomas. Sci Signal 2015; 8: pp. ra125. https://doi.org/10.1126/scisignal.aaa1690
34. Nguyen T.B., Cron G.O., Bezzina K., et. al.: Correlation of tumor immunohistochemistry with dynamic contrast-enhanced and DSC-MRI parameters in patients with gliomas. AJNR Am J Neuroradiol 2016; 37: pp. 2217-2223. https://doi.org/10.3174/ajnr.A4908
35. Emblem K.E., Nedregaard B., Nome T., et. al.: Glioma grading by using histogram analysis of blood volume heterogeneity from MR-derived cerebral blood volume maps. Radiology 2008; 247: pp. 808-817. https://doi.org/10.1148/radiol.2473070571
36. Awasthi R., Pandey C.M., Sahoo P., et. al.: Dynamic contrast-enhanced magnetic resonance imaging-derived kep as a potential biomarker of matrix metalloproteinase 9 expression in patients with glioblastoma multiforme: a pilot study. J Comput Assist Tomogr 2012; 36: pp. 125-130. https://doi.org/10.1097/RCT.0b013e31823f6c59
37. Nguyen T.B., Cron G.O., Perdrizet K., et. al.: Comparison of the diagnostic accuracy of DSC- and dynamic contrast-enhanced MRI in the preoperative grading of astrocytomas. AJNR Am J Neuroradiol 2015; 36: pp. 2017-2022. https://doi.org/10.3174/ajnr.A4398
38. Harrer J.U., Parker G.J., Haroon H.A., et. al.: Comparative study of methods for determining vascular permeability and blood volume in human gliomas. J Magn Reson Imaging 2004; 20: pp. 748-757. https://doi.org/10.1002/jmri.20182
39. Cha S., Tihan T., Crawford F., et. al.: Differentiation of low-grade oligodendrogliomas from low-grade astrocytomas by using quantitative blood-volume measurements derived from dynamic susceptibility contrast-enhanced MR imaging. AJNR Am J Neuroradiol 2005; 26: pp. 266-273.