
Rationale and Objectives
This study aimed to determine the diagnostic aid of computed tomography (CT) features for the differentiation of active alveolitis and fibrosis using a CT texture analysis (CTTA) prototype and CT densitometry in patients with systemic sclerosis (SSc) using ancillary high-resolution computed tomography (HRCT) features and their longitudinal course as standard of reference.
Materials and Methods
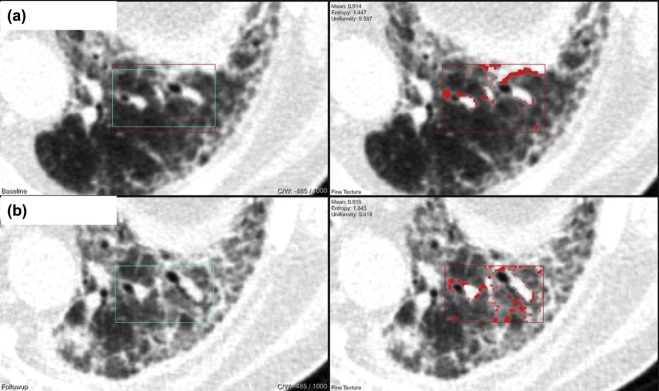
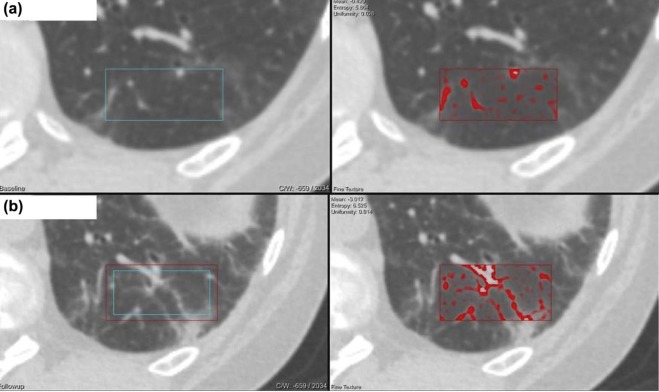
We retrospectively analyzed thin-slice noncontrast chest CT image data of 43 patients with SSc (18 men, mean age 51.55 ± 15.52 years; range 23–71 years). All of them had repeated noncontrast enhanced HRCT of the lung. Classification into active alveolitis or fibrosis was done on HRCT based on classical HRCT findings (active alveolitis [19; 44.2%] and fibrosis [24; 55.8%]) and their course at midterm. Results were compared to pulmonary functional tests and were followed up by CT. Ground glass opacity was considered suggestive of alveolitis, whereas coarse reticulation with parenchymal distortion, traction bronchiectasis, and honeycombing were assigned to fibrosis.
Results
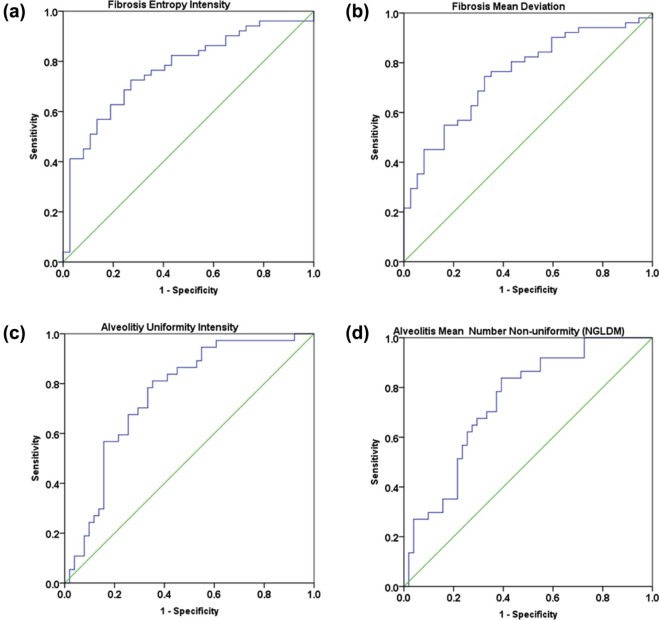
Statistically significant differences in CTTA were found for first-order textural features (mean intensity, average, deviation, skewness) and second-order statistics (entropy of co-occurrence matrix, mean number of nonuniformity (NGLDM), entropy of NGLDM, entropy of heterogeneity, intensity, and average). Cut-off value for the prediction of fibrosis at baseline was significant for entropy of intensity ( P value < .001) and for mean deviation ( P value < .001), and for prediction of alveolitis was significant for uniformity of intensity ( P value < .001) and for NGLDM ( P value < .001).
At pulmonary functional tests, forced expiratory volume in 1 second and single-breath diffusion capacity for carbon monoxide were significantly lower in fibrosis than in alveolitis 2.03 ± 0.78 vs. 2.61 ± 0.83, P < .016 and 4.51 ± 1.61 vs. 6.04 ± 1.75, P < .009, respectively. Differences in CT densitometry between alveolitis and fibrosis were not significant.
Conclusions
CTTA parameters are significantly different in active alveolitis vs. fibrosis in patients with SSc and may be helpful for differentiation of these two entities.
Introduction
Pulmonary involvement in systemic sclerosis (SSc) is frequent and greatly impacts morbidity and mortality . Respiratory symptoms occur first with disease progression and are confirmed with abnormal pulmonary function tests (PFT) at advanced stages . Although advanced fibrosis can be detected with chest radiography, active alveolitis, which represents a reversible, inflammatory component, may not be visible on radiography and requires high-resolution computed tomography (HRCT) . HRCT shows pulmonary abnormalities in up to 90% of patients with SSc, whereas PFT are abnormal in only 40%–75% of cases . For this reason, CT has advanced to a major diagnostic tool for detection and quantification of pulmonary involvement and is now recommended in all patients with SSc for accurate evaluation of this target organ .
Get Radiology Tree app to read full this article<
Get Radiology Tree app to read full this article<
Materials and Methods
Patient Characteristics
Get Radiology Tree app to read full this article<
Get Radiology Tree app to read full this article<
CT Technique
Get Radiology Tree app to read full this article<
Imaging Analysis
Get Radiology Tree app to read full this article<
Get Radiology Tree app to read full this article<
Get Radiology Tree app to read full this article<
CT Densitometry
Get Radiology Tree app to read full this article<
CT Texture Analysis
Get Radiology Tree app to read full this article<
Get Radiology Tree app to read full this article<
Get Radiology Tree app to read full this article<
Statistics
Get Radiology Tree app to read full this article<
Get Radiology Tree app to read full this article<
Get Radiology Tree app to read full this article<
Results
Clinical and Radiologic Course of the Disease Between Baseline CT and Follow-up CT
Get Radiology Tree app to read full this article<
TABLE 1
Patients’ Demographics
No. of Patients_n_ = 43 100% Age, y, mean ± SD 51.55 ± 15.52 – Range 23–71 – Age at initial diagnosis, mean ± SD 45.15 ± 13.90y – Male 18 41.9% Female 25 58.1% Therapies Cyclophosphamide 14 32.5% Mycophenolate-mofetil 12 27.9% Rituximab 3 6.9% Prednisolone 3 6.9% Hydroxychloroquine 1 2.3% Azathioprine 1 2.3%
Get Radiology Tree app to read full this article<
Get Radiology Tree app to read full this article<
Get Radiology Tree app to read full this article<
Pulmonary Function Tests
Get Radiology Tree app to read full this article<
TABLE 2
Listed Clinical Parameters Including PFT in Patients with Systemic Sclerosis of the Lung in Inspiration at Baseline Examination
Fibrosis Alveolitis_P_ Mean ± SD Mean ± SD TLC 4.61 ± 1.59 5.25 ± 1.58 .212 Pre TLC % 79.52 ± 20.54 92.35 ± 17.79 .039 ERV 1.20 ± 1.13 1.19 ± 0.54 .223 Pre ERV % 84.98 ± 39.62 97.72 ± 28.22 .223 RV, mL 1.87 ± 0.72 2.01 ± 0.80 .759 Pre RV % 99.44 ± 29.70 110.10 ± 41.30 .473 RV%TLC 41.19 ± 11.59 37.31 ± 2.29 .191 Pre RV%TLC 122.11 ± 28.66 118.74 ± 22.81 .942 VC, mL 2.42 ± 0.96 4.97 ± 8.44 .044 Pre VC % 71.76 ± 23.69 83.08 ± 19.96 .082 FVC, mL 2.03 ± 0.78 3.01 ± 1.00 .096 Pre FVC % 72.38 ± 23.57 81.71 ± 13.57 .096 FEV1, mL 2.03 ± 0.78 2.61 ± 0.83 .016 \* Pre FEV1 % 72.38 ± 23.57 84.92 ± 13.56 .033 FEV1 %VC, mL 84.51 ± 13.30 87.32 ± 11.47 .788 Pre FEV1 %VC, % 107.70 ± 15.60 109.47 ± 12.98 .961 DLCOc SB 4.51 ± 1.61 6.04 ± 1.75 .009 \* Pre DLCOc SB % 52.23 ± 16.56 65.97 ± 16.85 .009 \*
FEV 1 , forced expiratory volume in 1s; FRV, forced expiratory residual column; FVC, forced expiratory vital capacity; RV, residual volume; TLC, total lung capacity; VC, vital capacity.
Single-breath diffusion capacity for carbon monoxide (DLCOc SB ) and percentage of the measured values to the predicted values (Pre).
Get Radiology Tree app to read full this article<
Get Radiology Tree app to read full this article<
Results of CT Densitometry
Get Radiology Tree app to read full this article<
TABLE 3
Overview of Lung Volumes in Milliliters of All Patients
Fibrosis (19/43 patients)P Alveolitis (24/43 patients)P Baseline Follow-up Baseline Follow-up Total lung volume (mL) 4027.58 ± 1571.44 3783.38 ± 1328.48 .006 \* 4576.63 ± 1230.54 4211.63 ± 1261.90 .044 Mean lung density (MLD) −762.79±59.65 −746.42±64.98 .069 −784.53 ± 44.15 −773.11 ± 47.05 .217 High-attenuation values (HAV) 2.00 ± 0.79 2.34 ± 1.15 .346 1.58 ± 0.62 1.76 ± 0.83 .612 Low-attenuation values (LAV) 1.45 ± 5.45 0.95 ± 2.90 .039 0.53 ± 1.02 0.68 ± 2.14 .063
Get Radiology Tree app to read full this article<
Get Radiology Tree app to read full this article<
CT Texture Analysis (CTTA)
Get Radiology Tree app to read full this article<
TABLE 4
Differences in CTTA Between Fibrosis and Alveolitis Using Fine Granularities
Fine Filter Fibrosis Alveolitis_P__P__P_ Mean Entropy Uniformity Mean Entropy Uniformity Heterogeneity −2.309 6.4502 0.0164 −1.2675 61670 0.0207 .014 \* .001 .001 \* Intensity −683.2016 7.1358 0.0100 −759.2873 6.6530 0.0143 .001 \* .001 \* .001 \* Average −686.1355 7.3237 0.0078 −760.5881 7.1545 0.0090 .001 \* .010 \* .021 \* Deviation 90.6543 7.0647 0.0092 70.4687 6.9377 0.111 .001 \* .065 .012 \* Skewness 0.01825 2.3752 0.4000 0.2420 2.5097 0.3803 .008 \* .390 .496 Entropy (Co-occurrence matrix) fine 2.0320 7.269 0.0069 1.5651 7.3505 0.0086 .001 \* .673 .187 Difference variance (Co-occurrence matrix) fine 0.5853 6.1778 0.0278 0.4579 5.8294 0.0341 .122 .017 \* .122 Number Nonuniformity (NGLDM) 0.5095 4.1779 0.0887 0.6156 3.9771 0.1160 .001 \* .429 .055 Entropy (NGLDM) 1.0252 4.7748 0.0524 0.8595 4.7247 0.0599 .001 \* .828 .214 Contrast (NGTDM) 29.2144 3.0794 0.2188 21.8599 3.4811 0.1896 .006 \* .129 .406
CTTA, computed tomography texture analysis.
Get Radiology Tree app to read full this article<
Get Radiology Tree app to read full this article<
Get Radiology Tree app to read full this article<
Receiver Operating Characteristics for Defining Cutoff Values for Prediction of Active Alveolitis (GGO) and Fibrosis Based on CTTA Parameters
Get Radiology Tree app to read full this article<
TABLE 5
Cutoff Values in CTTA with Predictive Value
Texture Analysis Parameter Value Sensitivity 1-Specitifity AUC_P_ 95% Interval ROC values for fibrosis fine filter Entropy intensity 6.7246 78.4% 56.8% 0.768 .001 \* 0.669–0.868 Mean deviation 72.2217 76.5% 59.5% 0.753 .001 \* 0.652–0.854 ROC values for alveolitis fine filter Uniformity intensity 0.0157 75.7% 66.7% 0.756 .001 \* 0.654–0.858 Mean number nonuniformity (NGLDM) 0.5602 75.7% 62.7% 0.742 .001 \* 0.640–0.845
AUC, areas under curve; CTTA, computed tomography texture analysis; ROC, receiver operating characteristic.
Get Radiology Tree app to read full this article<
Get Radiology Tree app to read full this article<
Get Radiology Tree app to read full this article<
Discussion
Get Radiology Tree app to read full this article<
Get Radiology Tree app to read full this article<
Get Radiology Tree app to read full this article<
Get Radiology Tree app to read full this article<
Get Radiology Tree app to read full this article<
Get Radiology Tree app to read full this article<
Get Radiology Tree app to read full this article<
Get Radiology Tree app to read full this article<
Supplementary Data
Get Radiology Tree app to read full this article<
Appendix S1
Get Radiology Tree app to read full this article<
Get Radiology Tree app to read full this article<
References
1. Schurawitzki H., Stiglbauer R., Graninger W., et. al.: Interstitial lung disease in progressive systemic sclerosis: high-resolution CT versus radiography. Radiology 1990; 176: pp. 755-759.
2. Solomon J.J., Olson A.L., Fischer A., et. al.: Scleroderma lung disease. Eur Respir Rev 2013; 22: pp. 6-19.
3. Molberg O., Hoffmann-Vold A.M.: Interstitial lung disease in systemic sclerosis: progress in screening and early diagnosis. Curr Opin Rheumatol 2016; 28: pp. 613-618.
4. Wangkaew S., Euathrongchit J., Wattanawittawas P., et. al.: Correlation of delta high-resolution computed tomography (HRCT) score with delta clinical variables in early systemic sclerosis (SSc) patients. Quant Imaging Med Surg 2016; 6: pp. 381-390.
5. Nihtyanova S.I., Schreiber B.E., Ong V.H., et. al.: Prediction of pulmonary complications and long-term survival in systemic sclerosis. Arthritis Rheumatol 2014; 66: pp. 1625-1635.
6. Bouros D., Wells A.U., Nicholson A.G., et. al.: Histopathologic subsets of fibrosing alveolitis in patients with systemic sclerosis and their relationship to outcome. Am J Respir Crit Care Med 2002; 165: pp. 1581-1586.
7. Travis W.D., Costabel U., Hansell D.M., et. al.: An official American Thoracic Society/European Respiratory Society statement: update of the international multidisciplinary classification of the idiopathic interstitial pneumonias. Am J Respir Crit Care Med 2013; 188: pp. 733-748.
8. Schettino I.A., Ab’Saber A.M., Vollmer R., et. al.: Accuracy of high resolution CT in assessing idiopathic pulmonary fibrosis histology by objective morphometric index. Pathol Res Pract 2002; 198: pp. 347-354.
9. Tourassi G.D.: Journey toward computer-aided diagnosis: role of image texture analysis. Radiology 1999; 213: pp. 317-320.
10. Henes J.C., Horger M., Amberger C., et. al.: Enteric-coated mycophenolate sodium for progressive systemic sclerosis—a prospective open-label study with CT histography for monitoring of pulmonary fibrosis. Clin Rheumatol 2013; 32: pp. 673-678.
11. Kloth C., Thaiss W.M., Hetzel J., et. al.: Impact of endobronchial coiling on segmental bronchial lumen in treated and untreated lung lobes: correlation with changes in lung volume, clinical and pulmonary function tests. Eur Radiol 2016; 26: pp. 2176-2183.
12. Kloth C., Thaiss W.M., Ditt H., et. al.: Segmental bronchi collapsibility: computed tomography-based quantification in patients with chronic obstructive pulmonary disease and correlation with emphysema phenotype, corresponding lung volume changes and clinical parameters. J Thorac Dis 2016; 8: pp. 3521-3529.
13. Haider M.A., Vosough A., Khalvati F., et. al.: CT texture analysis: a potential tool for prediction of survival in patients with metastatic clear cell carcinoma treated with sunitinib. Cancer Imaging 2017; 17: pp. 4.
14. Fu S., Chen S., Liang C., et. al.: Texture analysis of intermediate-advanced hepatocellular carcinoma: prognosis and patients’ selection of transcatheter arterial chemoembolization and sorafenib. Oncotarget 2017; 8: pp. 37855-37865.
15. Ahn S.J., Kim J.H., Park S.J., et. al.: Prediction of the therapeutic response after FOLFOX and FOLFIRI treatment for patients with liver metastasis from colorectal cancer using computerized CT texture analysis. Eur J Radiol 2016; 85: pp. 1867-1874.
16. Ganeshan B., Miles K.A., Babikir S., et. al.: CT-based texture analysis potentially provides prognostic information complementary to interim FDG-PET for patients with Hodgkin’s and aggressive non-Hodgkin’s lymphomas. Eur Radiol 2017; 27: pp. 1012-1020.
17. Ganeshan B., Miles K.A.: Quantifying tumour heterogeneity with CT. Cancer Imaging 2013; 13: pp. 140-149.
18. Bellia M., Cannizzaro F., Scichilone N., et. al.: HRCT and scleroderma: semiquantitative evaluation of lung damage and functional abnormalities. Radiol Med 2009; 114: pp. 190-203.
19. Matsuoka S., Yamashiro T., Matsushita S., et. al.: Quantitative CT evaluation in patients with combined pulmonary fibrosis and emphysema: correlation with pulmonary function. Acad Radiol 2015; 22: pp. 626-631.
20. Kloth C., Maximilian Thaiss W., Preibsch H., et. al.: Quantitative chest CT analysis in patients with systemic sclerosis before and after autologous stem cell transplantation: comparison of results with those of pulmonary function tests and clinical tests. Rheumatology (Oxford) 2016; 55: pp. 1763-1770.
21. Alemzadeh M., Boylan C., Kamath M.V.: Review of texture quantification of CT images for classification of lung diseases. Crit Rev Biomed Eng 2015; 43: pp. 183-200.
22. Ginsburg S.B., Lynch D.A., Bowler R.P., et. al.: Automated texture-based quantification of centrilobular nodularity and centrilobular emphysema in chest CT images. Acad Radiol 2012; 19: pp. 1241-1251.
23. Korfiatis P.D., Karahaliou A.N., Kazantzi A.D., et. al.: Texture-based identification and characterization of interstitial pneumonia patterns in lung multidetector CT. IEEE Trans Inf Technol Biomed 2010; 14: pp. 675-680.
24. Huber M.B., Bunte K., Nagarajan M.B., et. al.: Texture feature ranking with relevance learning to classify interstitial lung disease patterns. Artif Intell Med 2012; 56: pp. 91-97.
25. Huber M.B., Nagarajan M.B., Leinsinger G., et. al.: Performance of topological texture features to classify fibrotic interstitial lung disease patterns. Med Phys 2011; 38: pp. 2035-2044.