
Rationale and Objectives
To compare two semiautomated methods for measurement of infarcted myocardium area on delayed contrast enhanced magnetic resonance imaging, with histopathology findings as standard of reference.
Materials and Methods
Percentage area of myocardial infarction was measured in 10 Yorkshire landrace pigs manually and using two semiautomated methods. The first (standard deviation method) used two operator-selected regions of interest (ROIs) and nine different cutoff values (one to nine times the standard deviation of signal intensity in normal myocardium) to identify infarction. The second (threshold method) used threshold values based on percentages of maximum signal intensity to identify infarction. Results were compared with histopathology findings.
Results
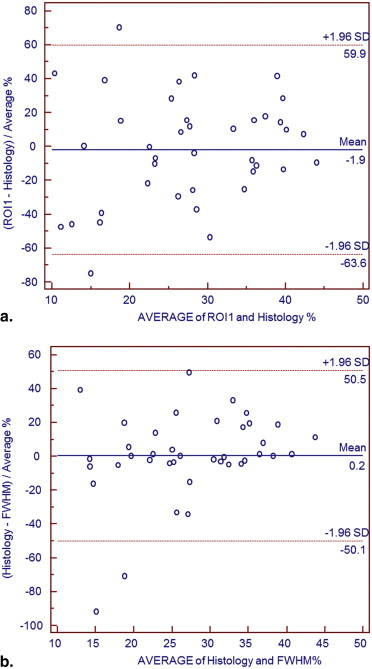
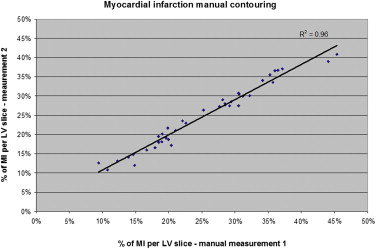
Difference between percentage area of infarction obtained with standard deviation method and autopsy specimens was in the range: −13.5% to +13.2%. With threshold method (thresholds from 30% to 90% of signal intensity), difference was −15% to +23%. Manual contouring underestimated infarcted area by 2% comparing to autopsy results. The best agreement between histopathology and semi-automated software was achieved for 4 standard deviations with standard deviation method: difference −0.45%, and for a percentage threshold of 70% (difference +0.67%) with threshold method. However, with standard deviation method, there was statistically significant difference between ROIs based on their location in viable myocardium: mean difference 1.7 ± 4%, P < .0001.
Conclusion
Semiautomated measurement of myocardial infarcted area on delayed enhanced magnetic resonance images performs well compared to autopsy. The threshold method, based on percentages of maximum signal intensity is preferable over standard deviation method, which is more susceptible to variability from location of ROIs within viable myocardium.
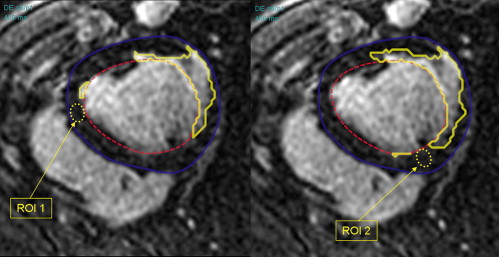
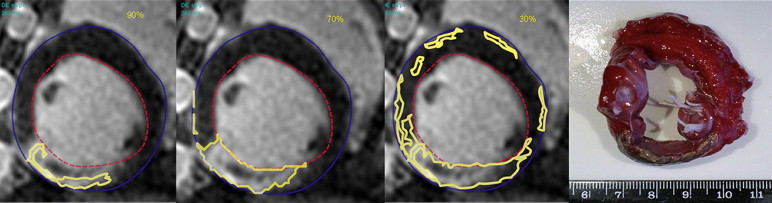
Delayed enhancement magnetic resonance imaging (DE-MRI) is an established imaging technique for the identification of myocardial infarction in clinical practice . Quantification of the amount of infarction is desirable and was first attempted with manual methods which resulted in serious interobserver variability . Therefore dedicated software has been developed. However, there is no consensus on the best method for the automated quantitative estimation of the infarcted area based on DE-MRI images . Most commercially available software packages differentiate infarcted myocardium from viable myocardium using the standard deviation (SD) method. Generally, 2 SD above the mean signal intensity of the remote viable myocardium are used to identify the infarcted myocardium . However, local variations in signal intensity, which can occur using a surface coil, may introduce a bias when remote myocardial regions are used to calculate the segmentation threshold. More recently, another method for semiautomated segmentation was introduced . According to this method, a percentage of the maximum myocardial signal intensity is used as a threshold value to differentiate viable from infarcted myocardium. The threshold of 50% is referred to as full width at half maximum (FWHM). This technique is independent from regions of interest (ROIs) positioned in remote areas of viable myocardium. This method may be limited when the infarcted myocardium contains areas of microvascular obstruction, which appear as central dark zones within enhancing infarcted areas. However, regions of microvascular obstruction are generally easily recognized and the segmentation can be corrected manually.
In this study, we have addressed the influence of different cutoff values when using the SD method, and investigated the variability introduced by the position of the ROIs in areas of remote viable myocardium. Also, a newer semiautomated threshold method has been optimized using different cutoff values. Both methods have been compared with histopathology findings.
Materials and methods
Animal Experiments
Get Radiology Tree app to read full this article<
Get Radiology Tree app to read full this article<
MRI Protocol
Get Radiology Tree app to read full this article<
Image Analysis
Get Radiology Tree app to read full this article<
Get Radiology Tree app to read full this article<

Get Radiology Tree app to read full this article<
Get Radiology Tree app to read full this article<
Get Radiology Tree app to read full this article<
Get Radiology Tree app to read full this article<
Get Radiology Tree app to read full this article<
Statistical Analysis
Get Radiology Tree app to read full this article<
Get Radiology Tree app to read full this article<
Get Radiology Tree app to read full this article<
1n∑ni=1|pi−qi| 1
n
∑
i
=
1
n
|
p
i
−
q
i
|
where p was the infarcted myocardial area calculated in DE-MRI with different methods: (SD1–9, and FHWM) and q was the myocardial area obtained in histopathology specimen. p i (or q i ) is the coordinate of p (or q ) in dimension i.
Get Radiology Tree app to read full this article<
Get Radiology Tree app to read full this article<
Get Radiology Tree app to read full this article<
Get Radiology Tree app to read full this article<
Results
Get Radiology Tree app to read full this article<
Manual Contouring of Myocardial Infarction
Get Radiology Tree app to read full this article<
Get Radiology Tree app to read full this article<
Get Radiology Tree app to read full this article<
Semiautomated Analysis of Myocardial Infarction on DE-MRI
First method: standard deviation (SD) signal intensity thresholding
Get Radiology Tree app to read full this article<

Get Radiology Tree app to read full this article<
Get Radiology Tree app to read full this article<
Get Radiology Tree app to read full this article<
Get Radiology Tree app to read full this article<

Get Radiology Tree app to read full this article<
Second method: percentage signal intensity thresholding
Get Radiology Tree app to read full this article<

Get Radiology Tree app to read full this article<
Get Radiology Tree app to read full this article<
Table 1
Estimated Average Myocardial Infarction Area (in %) for Each Experimental Animal Calculated with Manual Tracing and Automatic Segmentation: SD4 and FWHM 70% Methods Compared to Autopsy Results
Average Infarct Size (%) per Animal Animal Manual Tracing SD4 ROI 1 FWHM 70% Autopsy 1 20.0 23.3 24.4 15.3 2 24.2 25.3 26.2 25.1 3 28.3 32.8 32.7 32.2 4 35.7 34.9 37.5 37.4 5 36.7 41.7 33.7 40.3 6 20.8 17.2 18.3 26.4 7 17.3 24.9 21.7 25.9 8 23.7 42.5 32.4 35.4 9 26.9 26.1 29.6 29.1 10 16.1 15.6 16.9 16.8
FWHM, full width at half maximum; ROI, region of interest; SD, standard deviation.
Get Radiology Tree app to read full this article<
Discussion
Get Radiology Tree app to read full this article<
Get Radiology Tree app to read full this article<
Get Radiology Tree app to read full this article<
Get Radiology Tree app to read full this article<
Get Radiology Tree app to read full this article<
Get Radiology Tree app to read full this article<
Get Radiology Tree app to read full this article<
Get Radiology Tree app to read full this article<
Get Radiology Tree app to read full this article<
Get Radiology Tree app to read full this article<
Conclusion
Get Radiology Tree app to read full this article<
Acknowledgments
Get Radiology Tree app to read full this article<
References
1. Kim R.J., Fieno D.S., Parrish R.B., et. al.: Relationship of MRI delayed contrast enhancement to irreversible injury, infarct age and contractile function. Circulation 1999; 100: pp. 1992-2002.
2. Fieno D.S., Kim R.J., Chen E.L., et. al.: Contrast-enhanced magnetic resonance imaging of myocardium at risk: distinction between reversible and irreversible injury throughout infarct healing. J Am Coll Cardiol 2000; 36: pp. 1985-1991.
3. Pennel D.J., Sechtem U.P., Higgins C.B., et. al.: Clinical indications for cardiovascular magnetic resonance (MRI): Consensus Panel Report. Eur Heart J 2004; 25: pp. 1940-1965.
4. Sester R.M., Bexell D.G., O’Donnel T.P., et. al.: Quantitative assessment of myocardial scar in delayed enhancement magnetic resonance imaging. J Magn Reson Imaging 2003; 18: pp. 434-441.
5. Kolipaka A., Chatzimavroudis G.P., White R.D., et. al.: Segmentation of non-viable myocardium in delayed enhancement magnetic resonance images. Intern J Cardiovasc Imaging 2005; 21: pp. 303-311.
6. Tao Q., Milles J., Zeppenfeld K., et. al.: Automated segmentation of myocardial scar in late enhancement MRI using combined intensity and spatial resolution. Magnet Reson Medic 2010; 64: pp. 586-594.
7. Amado L.C., Gerber B.L., Gupta S.N., et. al.: Accurate and objective infarct sizing by contrast-enhanced magnetic resonance imaging in a canine myocardial infarction model. J Am Coll Cardiol 2004; 44: pp. 2383-2389.
8. Mahrholdt H., Wagner A., Holly T.A., et. al.: Reproducibility of chronic infarct size measurement by contrast-enhanced magnetic resonance imaging. Circulation 2002; 106: pp. 2322-2327.
9. Hsu Li-Yueh, Natazon A., Kellman P., et. al.: Quantitative myocardial infarction on delayed enhancement MRI. Part I: animal validation of an automated feature analysis and combined thresholding infarct sizing algorithm. J Magn Reson Imaging 2006; 23: pp. 298-308.
10. Baks T., Cademartiri F., Moelker A.D., et. al.: Multislice computed Tomography and magnetic resonance imaging for the assessment of reperfused acute myocardial infarction. J Am Coll Cardiol 2006; 48: pp. 144-152.
11. van Geuns R.J., Baks T., Gronenschild E.H., et. al.: Automatic quantitative left ventricular analysis of cine MR images by using three-dimensional information for contour detection. Radiology 2006; 240: pp. 215-221.
12. Ferguson G.A., Takane Y.: Statistical Analysis in Psychology and Education.2005.McGraw-Hill Ryerson LimitedMontréal-Quebec
13. Krouwer J.S., Monti K.L.: A simple graphical method to evaluate laboratory assays. Eur J Clin Chem Clin Biochem 1995; 33: pp. 525-527.
14. Bondarenko O., Beek A.M., Hofman M.B., et. al.: Standardizing the definition of hyperenhancement in the quantitative assessment of infarct size and myocardial viability using delayed contrast-enhanced CMR. J Cardiovasc Magn Reson 2005; 7: pp. 481-485.
15. Hsu L.Y., Ingkanisorn W.P., Kellman P., et. al.: Quantitative myocardial infarction on delayed enhancement MRI. Part II: clinical application of an automated feature analysis and combined thresholding infarct sizing algorithm. J Magn Reson Imaging 2006; 23: pp. 309-314.
16. Kim R.J., Wu E., Rafael A., et. al.: The use of contrast-enhanced magnetic resonance imaging to identify reversible myocardial dysfunction. N Engl J Med 2000; 343: pp. 1445-1453.