
Rationale and Objectives
Changes in the composition of body tissues are major aging phenotypes, but they have been difficult to study in depth. Here we describe age-related change in abdominal tissues observable in computed tomography (CT) scans. We used pattern recognition and machine learning to detect and quantify these changes in a model-agnostic fashion.
Materials and Methods
CT scans of abdominal L4 sections were obtained from Baltimore Longitudinal Study of Aging (BLSA) participants. Age-related change in the constituent tissues were determined by training machine classifiers to differentiate age groups within male and female strata (“Younger” at 50–70 years old vs “Older” at 80–99 years old). The accuracy achieved by the classifiers in differentiating the age cohorts was used as a surrogate measure of the aging signal in the different tissues.
Results
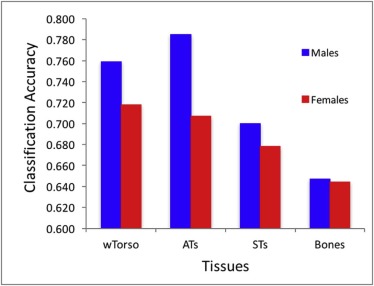
The highest accuracy for discriminating age differences was 0.76 and 0.72 for males and females, respectively. The classification accuracy was 0.79 and 0.71 for adipose tissue, 0.70 and 0.68 for soft tissue, and 0.65 and 0.64 for bone.
Conclusions
Using image data from a large sample of well-characterized pool of participants dispersed over a wide age range, we explored age-related differences in gross morphology and texture of abdominal tissues. This technology is advantageous for tracking effects of biological aging and predicting adverse outcomes when compared to the traditional use of specific molecular biomarkers. Application of pattern recognition and machine learning as a tool for analyzing medical images may provide much needed insight into tissue changes occurring with aging and, further, connect these changes with their metabolic and functional consequences.
Introduction
Changes in body composition, both in the relative quantities of different tissue and their cellular and matrix content, occur with aging in all living organisms. Humans undergo an overall decline in lean body mass, mostly represented by muscle, and an increase in fat mass that occurs even in individuals who maintain the same weight over long time periods. In addition to global, quantitative changes, there are also qualitative changes that affect the characteristics and regional distribution of fat and muscle. For example, aging men show fat accumulates preferentially within and around the abdomen rather than in the subcutaneous tissue of the limbs and chest. Computed tomography (CT) and magnetic resonance imaging (MRI) collected in large epidemiologic studies have described tissue-specific changes in density and texture that may be correlated with adverse physiological changes and predict disease outcomes . Based on these studies, researchers have suggested that measures of body composition should be included in any attempt to characterize phenotypic aging .
A problem with this approach found in CT and MRI images characterizing body composition is the large variability in overall fat content and its regional distribution between individuals. Indeed, no previous studies have used body images to identify characteristics from multiple tissues that in aggregate correlate with chronological age, nor has this approach been validated in independent samples or in subsamples randomly selected from the original study population. Several previous studies used CT and MRI to find age-related differences in brain , bone , kidney , and fat distribution in skeletal muscle . All these studies were able to find statistically significant differences in morphology correlated with age, but they involved relatively a small number of participants, and used manual steps or semimanual classification in the analysis pipeline. Thus, until now it remained unclear whether information from body images alone can be used to detect changes in body composition and discern phenotypic age in a fully objective and automated way.
Get Radiology Tree app to read full this article<
Get Radiology Tree app to read full this article<
Materials and Methods
Get Radiology Tree app to read full this article<
Study Population
Get Radiology Tree app to read full this article<
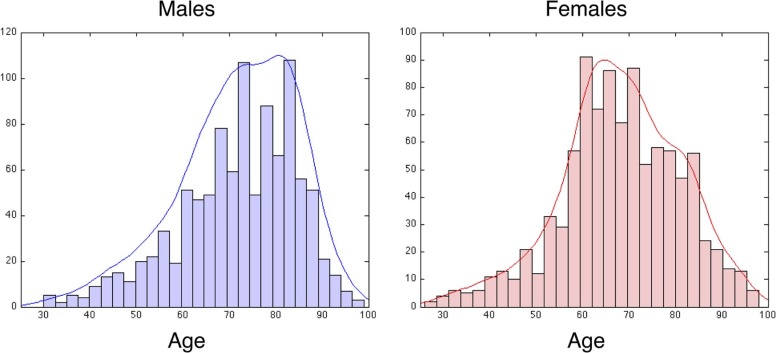
TABLE 1
Study Population
Males Females Younger Older Y + O Total Younger Older Y + O Total No. of subjects 220 124 344 544 293 75 368 548 No. of samples 350 323 673 1006 465 206 671 961 No. of visits per subject 1.48 ± 0.6 2.38 ± 1.5 1.81 ± 1.1 1.70 ± 1.0 1.48 ± 0.6 2.26 ± 1.5 1.66 ± 0.9 1.59 ± 0.9 Mean age 62.6 ± 5.5 84.9 ± 3.9 73.3 ± 12 71.8 ± 13 62.3 ± 5.2 85.5 ± 4.5 69.4 ± 12 68.5 ± 13
Number of subjects (row 1) and samples (row 2) are shown for each category (Younger or Older), all used categories (eg, Younger and Older combined), and all-total as well. Rows 3 and 4 in the table give number of patient visits and average age, respectively.
Get Radiology Tree app to read full this article<
From Raw Scans to Hounsfield Units
Get Radiology Tree app to read full this article<
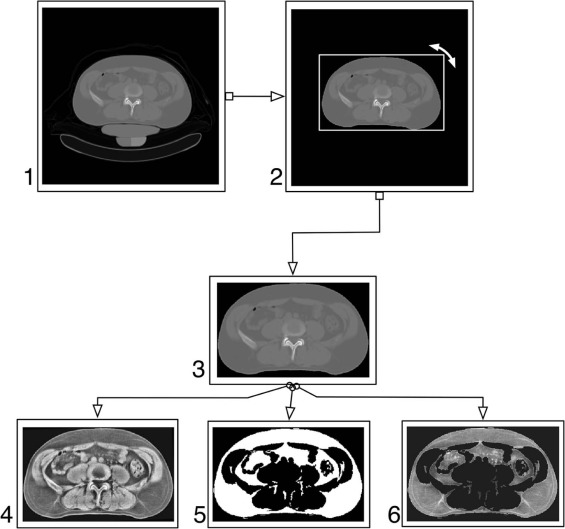
Automated Processing
Get Radiology Tree app to read full this article<
Get Radiology Tree app to read full this article<
Get Radiology Tree app to read full this article<
Get Radiology Tree app to read full this article<
Get Radiology Tree app to read full this article<
Get Radiology Tree app to read full this article<
Statistical Classifiers
Get Radiology Tree app to read full this article<
Get Radiology Tree app to read full this article<
Classifier Evaluation
Get Radiology Tree app to read full this article<
Get Radiology Tree app to read full this article<
Get Radiology Tree app to read full this article<
Results
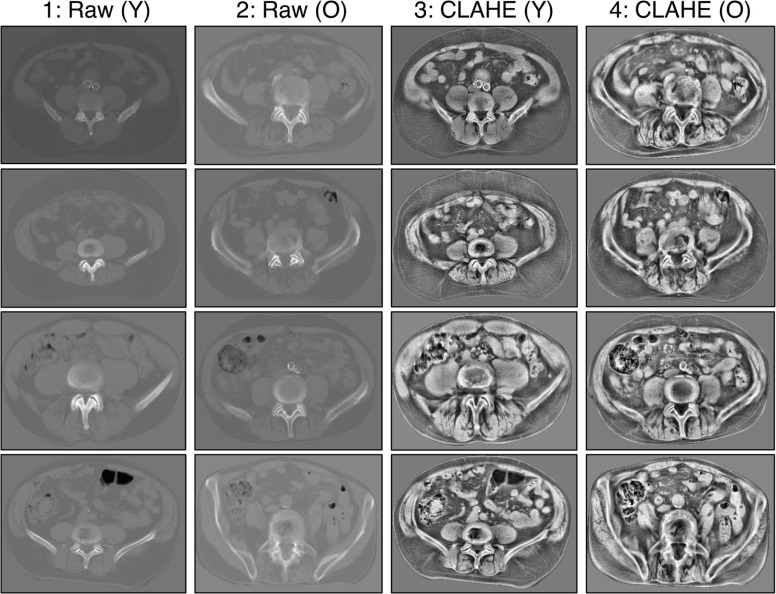
Aging Signal in Raw Scans and Signal Enhancement
Get Radiology Tree app to read full this article<
TABLE 2
Classification Accuracy Comparisons
Raw CLAHE Males: WND 0.655 0.718 Males: cmim + svm 0.677 0.762 Males: mrmr + svm 0.659 0.736 Males: ensemble0.6880.759 Females: WND 0.635 0.701 Females: cmim + svm 0.622 0.712 Females: mrmr + svm 0.595 0.698 Females: ensemble0.6350.718
CLAHE, contrast-limited adaptive histogram equalization; cmim, conditional mutual information minimization; mrmr, minimal-redundancy maximal relevance; svm, support vector machine.
Comparison of classification accuracy of Torso for two data types: (a) original (Raw) pixel intensity in the left column, and (b) CLAHE-enhanced images in the right column.
Get Radiology Tree app to read full this article<
Get Radiology Tree app to read full this article<
Get Radiology Tree app to read full this article<
Where Is the Aging Signal?
Get Radiology Tree app to read full this article<
Get Radiology Tree app to read full this article<
Get Radiology Tree app to read full this article<
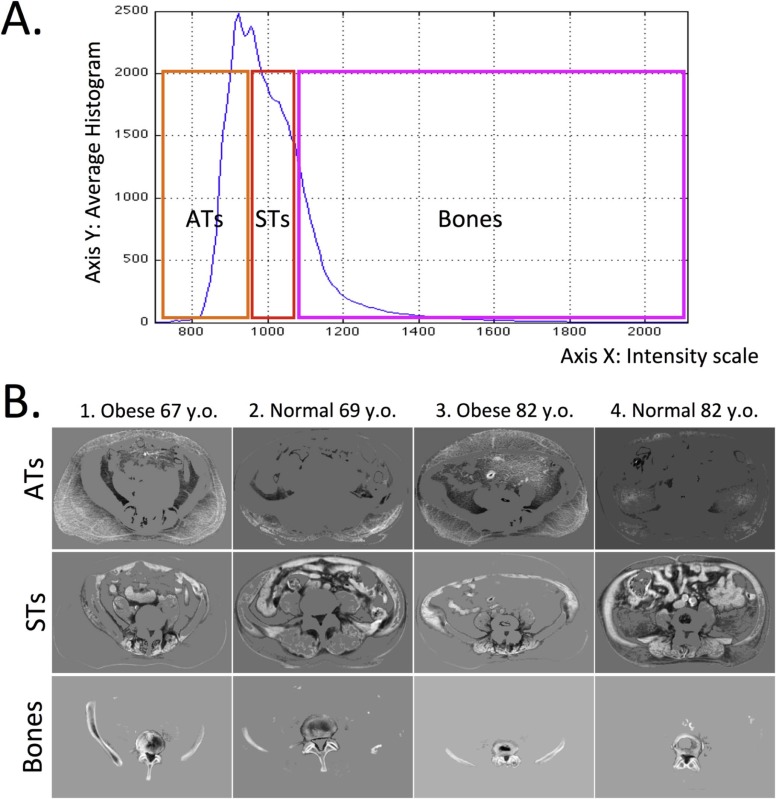
TABLE 3
Per-tissue Classification Accuracies (CAs) in Different Tissues
Torso ATs STs Bones Males: WND 0.718 0.787 0.677 0.650[0.772 0.665][0.749 0.825][0.757 0.597][0.591 0.709]_ Males: cmim + svm 0.762 0.770 0.691 0.622_[0.780 0.743][0.772 0.767][0.659 0.724][0.647 0.596] Males: mrmr + svm 0.736 0.753 0.670 0.609[0.705 0.767][0.766 0.741][0.616 0.723][0.665 0.553]_ Males: ensemble 0.759 0.785 0.700 0.647_[0.770 0.747][0.769 0.802][0.704 0.696][0.646 0.649] Females: WND 0.701 0.709 0.672 0.639[0.738 0.644][0.592 0.824][0.672 0.671][0.670 0.608]_ Females: cmim + svm 0.712 0.689 0.655 0.632_[0.823 0.601][0.763 0.614][0.761 0.549][0.609 0.654] Females: mrmr + svm 0.698 0.671 0.646 0.582[0.769 0.638][0.724 0.619][0.722 0.570][0.601 0.564]_ Females: ensemble 0.718 0.707 0.678 0.644_[0.798 0.638][0.705 0.710][0.738 0.617][0.654 0.634]
ATs, adipose tissues; cmim, conditional mutual information minimization; mrmr, minimal-redundancy maximal relevance; STs, soft tissues; svm, support vector machine.
Upper subcells show CA, and lower subcells show per-class CAs (for the Younger and Older classes, respectively).
Get Radiology Tree app to read full this article<
Get Radiology Tree app to read full this article<
Get Radiology Tree app to read full this article<
Get Radiology Tree app to read full this article<
Discussion
Get Radiology Tree app to read full this article<
Get Radiology Tree app to read full this article<
Adipose Tissue: Highest Aging Signal
Get Radiology Tree app to read full this article<
Get Radiology Tree app to read full this article<
Soft Tissue
Get Radiology Tree app to read full this article<
Bones: Smallest Aging Signal
Get Radiology Tree app to read full this article<
Get Radiology Tree app to read full this article<
Where Classification Errors Occur
Get Radiology Tree app to read full this article<
Conclusions
Get Radiology Tree app to read full this article<
Get Radiology Tree app to read full this article<
Get Radiology Tree app to read full this article<
References
1. Santanasto A.J., Goodpaster B.H., Kritchevsky S.B., et. al.: Body composition remodeling and mortality: the health aging and body composition study. J Gerontol A Biol Sci Med Sci 2017; 72: pp. 513-519.
2. Prado C.M., Siervo M., Mire E., et. al.: A population-based approach to define body-composition phenotypes. Am J Clin Nutr 2014; 99: pp. 1369-1377.
3. Doan N.T., van Rooden S., Versluis M.J., et. al.: An automated tool for cortical feature analysis: application to differences on 7 Tesla T2-weighted images between young and older healthy subjects. Magn Reson Med 2015; 74: pp. 240-248.
4. López-Alcaraz M., González P., Aguilera I., et. al.: Image analysis of pubic bone for age estimation in a computed tomography sample. Int J Legal Med 2015; 129: pp. 335-346.
5. Duan X., Rule A.D., Elsherbiny H., et. al.: Automated assessment of renal cortical surface roughness from computerized tomography images and its association with age. Acad Radiol 2014; 21: pp. 1441-1445.
6. Csapo R., Malis V., Sinha U., et. al.: Age-associated differences in triceps surae muscle composition and strength—an MRI-based cross-sectional comparison of contractile, adipose and connective tissue. BMC Musculoskelet Disord 2014; 15: pp. 209.
7. Shamir L., Delaney J., Orlov N., et. al.: Pattern recognition software and techniques for biological image analysis. PLoS Comput Biol 2010; 6: pp. e1000974.
8. Orlov N., Shamir L., Macura T., et. al.: WND-CHARM: multi-purpose image classification using compound image transforms. Pattern Recognit Lett 2008; 29: pp. 1684-1693.
9. Makrogiannis S., Caturegli G., Davatzikos C., et. al.: Computer-aided assessment of regional abdominal fat with food residue removal in CT. Acad Radiol 2013; 20: pp. 1413-1421.
10. Teague M.R.: Image analysis via the general theory of moments. J Opt Soc Am 1980; 70: pp. 920-930.
11. Pizer S., Johnston R., Rogers D., et. al.: Effective presentation of medical images on an electronic display station. Radiographics 1987; 7: pp. 1267-1274.
12. Orlov N.V., Weeraratna A.T., Hewitt S.M., et. al.: Automatic detection of melanoma progression by histological analysis of secondary sites. Cytometry A 2012; 81A: pp. 364-373.
13. Orlov N., Chen W., Eckley D.M., et. al.: Automatic classification of lymphoma images with transform-based global features. IEEE Trans Inf Technol Biomed 2010; 14: pp. 1003-1013.
14. Chang C.-C., Lin C.-J.: LIBSVM: a library for support vector machines. ACM Trans Intell Syst Technol 2011; 2: pp. 27.
15. Peng H., Long F., Ding C.: Feature selection based on mutual information: criteria of max-dependency, max-relevance, and min-redundancy. IEEE Trans Pattern Anal Mach Intell 2005; 27: pp. 1226-1238.
16. Fleuret F.: Fast binary feature selection with conditional mutual information. J Mach Learn Res 2004; 5: pp. 1531-1555.
17. Orlov N.V., Eckley D.M., Shamir L., et. al.: Improving class separability using extended pixel planes: a comparative study. Mach Vis Appl 2012; 23: pp. 1047-1058.
18. Schneider U., Pedroni E., Lomax A.: The calibration of CT Hounsfield units for radiotherapy treatment planning. Phys Med Biol 1996; 41: pp. 111-124.
19. Malo M., Rohrbach D., Isaksson H., et. al.: Longitudinal elastic properties and porosity of cortical bone tissue vary with age in human proximal femur. Bone 2013; 53: pp. 451-458.
20. Lee P., Brychta R., Collins M., et. al.: Cold-activated brown adipose tissue is an independent predictor of higher bone mineral density in women. Osteoporos Int 2013; 24: pp. 1513-1518.
21. Muruganandan S., Roman A., Sinal C.: Adipocyte differentiation of bone marrow-derived mesenchymal stem cells: cross talk with the osteoblastogenic program. Cell Mol Life Sci 2009; 66: pp. 236-253.
22. Meunier P., Aaron J., Edouard C., et. al.: Osteoporosis and the replacement of cell populations of the marrow by adipose tissue. A quantitative study of 84 iliac bone biopsies. Clin Orthop Relat Res 1971; 80: pp. 147-154.
23. Bredella M., Gill C., Gerweck A., et. al.: Ectopic and serum lipid levels are positively associated with bone marrow fat in obesity. Radiology 2013; 269: pp. 534-541.
24. Enzi G., Gasparo M., Biondetti P., et. al.: Subcutaneous and visceral fat distribution according to sex, age, and overweight, evaluated by computed tomography. Am J Clin Nutr 1986; 44: pp. 739-746.
25. Boutin R.D., Yao L., Canter R.J., et. al.: Sarcopenia: current concepts and imaging implications. AJR Am J Roentgenol 2015; 205: pp. 255-266.
26. Miljkovic I., Cauley J.A., Wang P.Y., et. al.: Abdominal myosteatosis is independently associated to hyperinsulinemia and insulin resistance among older men without diabetes. Obesity (Silver Spring) 2013; 21: pp. 2118-2125.
27. Nieves J.W., Formica C., Ruffing J., et. al.: Males have larger skeletal size and bone mass than females, despite comparable body size. J Bone Miner Res 2005; 20: pp. 529-535.
28. Avdagić S., Barić I., Keser I., et. al.: Differences in peak bone density between male and female students. Arh Hig Rada Toksikol 2009; 60: pp. 79-86.
29. Sheth N.P., Nelson C.L., Paprosky W.G.: Femoral bone loss in revision total hip arthroplasty: evaluation and management. J Am Acad Orthop Surg 2013; 21: pp. 601-612.
30. Thomas C., Mayhew P., Power J., et. al.: Femoral neck trabecular bone: loss with aging and role in preventing fracture. J Bone Miner Res 2009; 24: pp. 1808-1818.