
Rationale and Objectives
We sought to assess the ability of 18 F-fluoro-2-deoxy- d -glucose (FDG) PET/CT to distinguish adrenal adenomas from nonadenomas in patients with suspected malignancy.
Methods
Fifty-nine adrenal masses were evaluated with coregistered 18 F-FDG PET (PET/CT). Two reviewers independently graded uptake of 18 F-FDG by visual inspection of the adrenal mass in comparison to liver and background. CT attenuation value of the adrenal mass and the standardized uptake value (SUV) of the mass, liver, background, and primary neoplasm (when visible) were measured. Mean SUVs of the adrenal mass, liver, and background and ratios of the SUVs were calculated.
Results
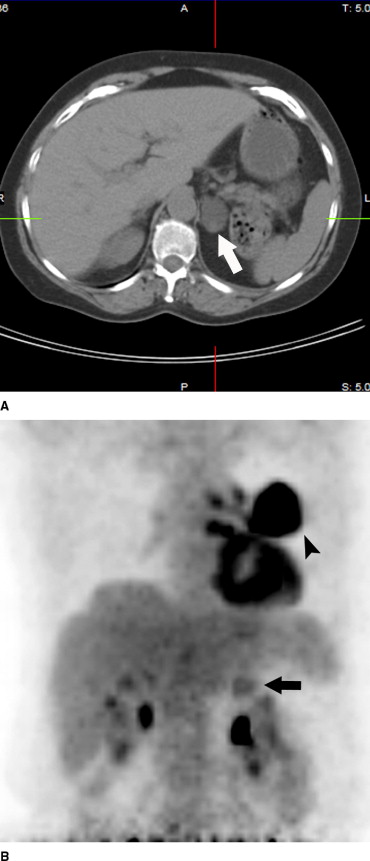
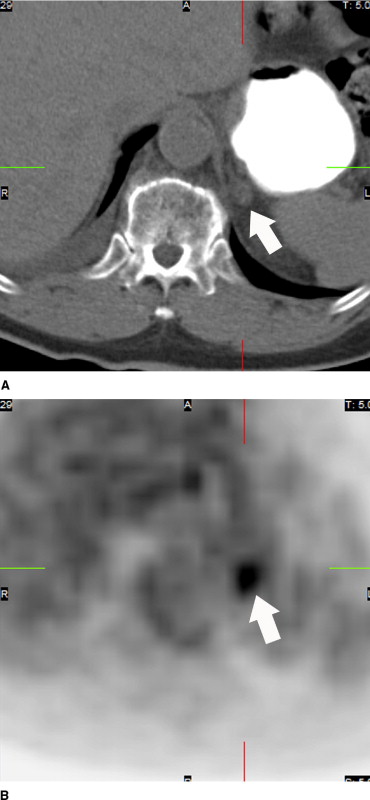
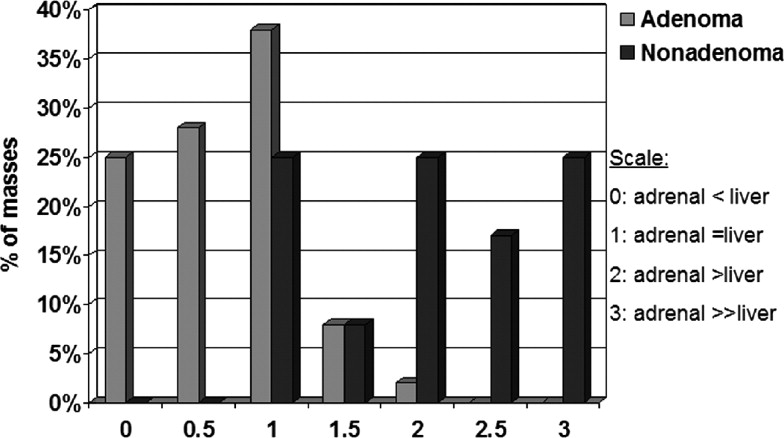
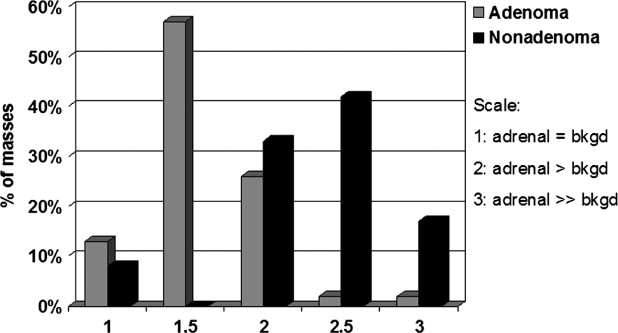
Of 47 adenomas, 43 measured <10 HU on unenhanced CT. Of 12, 12 nonadenomas measured >10 HU on unenhanced CT. Using qualitative assessment of FDG activity in the adrenal mass compared with liver, adenomas were less than, equal to, or more active than the liver in 51%, 38%, and 10%, respectively. Nonadenomas were less than, equal to, or more active than liver in 0%, 25%, and 75%, respectively. The mean SUV of adenomas (4.2) was significantly lower ( P = .002) than that of their primary malignancies (9.2) but not that of liver (4.3). The mean SUV of adenomas was not significantly different than that of nonadenomas (5.2), but the mean adrenal/liver ratio (1.0) for the adenomas was significantly lower ( P = .006) than that of the nonadenomas (2.1).
Conclusion
Adrenal adenomas were better differentiated from nonadenomas using unenhanced CT measurements in combination with ratios of the SUVs. Adrenal mass activity, which was visibly less than liver, was more specific for adenoma, whereas adrenal mass activity visibly greater than liver was more specific for malignancy.
Increasing experience with noninvasive imaging examinations such as CT and MR has led to the successful ability to characterize adrenal masses. Dedicated imaging protocols have been developed in order to distinguish adrenal adenomas from nonadenomas, particularly adrenal metastases. Prior investigations have shown that 18 F-fluoro-2-deoxy- d -glucose (FDG) PET is highly sensitive in detecting adrenal metastases revealing 19–34% additional metastatic foci compared with traditional imaging methods ( ). Recent literature has also suggested that 18 F-FDG PET may be effective in identifying benign adrenal lesions ( ); however, several investigators reported that benign adrenal adenomas demonstrated variable activity, which led to falsely positive diagnoses for malignancy ( ). In addition, different diagnostic criteria were used in these prior studies; activity in adrenal masses was compared with either background activity or liver activity.
Our objective was to determine the ability of 18 F-FDG PET/CT to differentiate adenomas from nonadenomas by comparing 18 F-FDG uptake in adrenal masses with both background and liver activity using subjective qualitative assessment of the adrenal mass, semiquantitative analysis with standardized uptake values (SUVs), and normalized or relative SUVs (RUVs). Our goal was not to compare CT and 18 F-FDG PET characterization of an adrenal mass as CT characterization of adrenal masses has been previously investigated ( ). We used previously published and widely accepted CT criteria to distinguish benign from malignant adrenal masses in patients in whom no histology was obtained. Furthermore, we sought to determine the incremental value of 18 F-FDG PET combined with the ability of unenhanced CT in the evaluation of an adrenal mass.
Materials and methods
Get Radiology Tree app to read full this article<
Get Radiology Tree app to read full this article<
Get Radiology Tree app to read full this article<
Get Radiology Tree app to read full this article<
Get Radiology Tree app to read full this article<
Get Radiology Tree app to read full this article<
Results
Get Radiology Tree app to read full this article<
Qualitative Assessment
Get Radiology Tree app to read full this article<
Get Radiology Tree app to read full this article<
Get Radiology Tree app to read full this article<
Get Radiology Tree app to read full this article<
Quantitative Assessment
Get Radiology Tree app to read full this article<
Table 1
Comparison of the mean attenuation values for adenoma and nonadenoma
Adenoma (n = 47) Nonadenoma (n = 12)P value Adrenal mass 1.3 ± 9.0 33.4 ± 6.6 <.0001 Liver 54.1 ± 13.5 57.2 ± 15.5 .5 Background −103.7 ± 17.6 −98.6 ± 24.3 .5
Table 2
Comparison of mean SUVs for adenoma and nonadenomas
Adenoma (n = 47) Nonadenoma (n = 12)P value Adrenal mass 4.0 ± 2.9 4.8 ± 3.1 .4 Background 2.3 ± 1.6 1.7 ± 1.1 .1 Liver 4.4 ± 2.4 3.0 ± 1.7 .1 Primary (adenoma, n = 34; nonadenoma, n = 9) 9.2 ± 8.7 5.7 ± 3.5 .1
Get Radiology Tree app to read full this article<
Get Radiology Tree app to read full this article<
Get Radiology Tree app to read full this article<
Get Radiology Tree app to read full this article<
Discussion
Get Radiology Tree app to read full this article<
Get Radiology Tree app to read full this article<
Get Radiology Tree app to read full this article<
Get Radiology Tree app to read full this article<
Get Radiology Tree app to read full this article<
Get Radiology Tree app to read full this article<
Get Radiology Tree app to read full this article<
Get Radiology Tree app to read full this article<
Get Radiology Tree app to read full this article<
Get Radiology Tree app to read full this article<
Get Radiology Tree app to read full this article<
Conclusion
Get Radiology Tree app to read full this article<
References
1. Boland G.W., Goldberg M.A., Lee M.J., Mayo-Smith W.W., Dixon J., McNichols M.M., et. al.: Indeterminate adrenal mass in patients with cancer: Evaluation at PET with 2-(F-18)-fluoro-2-deoxy-D-glucose. Radiology 1995; 194: pp. 131-134.
2. Erasmus J.J., Patz E.F., McAdams H.P., Murray J.G., Herndon J., Coleman R.E., et. al.: Evaluation of adrenal masses in patients with bronchogenic carcinoma using 18F-fluorodeoxyglucose positron emission tomography. AJR Am J Roentgenol 1997; 168: pp. 1357-1360.
3. MacManus M.P., Hicks R.J., Matthews J.P., Hogg A., McKenzie A.F., Wirth A., et. al.: High rate of unsuspected distant metastases by PET in apparent stage III non-small-cell cancer: Implication for radical radiation therapy. Int J Radiat Oncol Biol Phys 2001; 50: pp. 287-293.
4. Maurea S., Mainolfi C., Bazzicalupo L., Panico M.R., Imparato C., Alfano B., et. al.: Imaging of adrenal tumors using FDG PET: Comparison of benign and malignant lesions. AJR Am J Roentgenol 1999; 173: pp. 25-29.
5. Yun M., Kim W., Alnafisi N., Lacorte L., Jang S., Alavi A.: F-FDG PET in characterizing adrenal lesions detected on CT and MRI. J Nucl Med 2001; 42: pp. 1795-1799.
6. Kumar R., Xiu Y., Yu J.Q., Takalkar A., El-Haddad G., Poteneta S., et. al.: F-FDG PET in evaluation of adrenal lesions in patients with lung cancer. J Nucl Med 2004; 45: pp. 2058-2062.
7. Metser U., Miller E., Lerman H., Lievshitz G., Avital S., Even-Sapir E.: 18 F-FDG PET/CT in the evaluation of adrenal masses. J Nucl Med 2006; 45: pp. 32-37.
8. Boland G.W., Lee M.J., Gazelle G.S., Halpern E.F., McNicholas M.M.J., Mueller P.R.: Characterization of adrenal masses using unenhanced CT: an analysis of the CT literature. AJR Am J Roentgenol 1998; 171: pp. 201-204.
9. Caoili E.M., Korobkin M., Francis I.R., Cohan R.H., Dunnick N.R.: Delayed enhanced CT of lipid-poor adrenal adenomas. AJR Am J Roentgenol 2000; 175: pp. 1411-1415.
10. Caoili E.M., Korobkin M., Francis I.R., et. al.: Adrenal masses: Characterization with combined unenhanced and delayed enhanced CT. Radiology 2002; 222: pp. 629-633.
11. Korobkin M., Francis I.R., Kloos R.T., Dunnick N.R.: The incidental adrenal mass. Radiol Clin North Am 1996; 34: pp. 1037-1054.
12. Korobkin M., Brodeur F.J., Yutzy G.G., et. al.: Differentiation of adrenal adenomas from nonadenomas using CT attenuation values. AJR Am J Roentgenol 1996; 166: pp. 531-536.
13. Lee M.J., Hahn P.F., Papanicolau N., et. al.: Benign and malignant adrenal masses: CT distinction with attenuation coefficients, size, and observer analysis. Radiology 1991; 179: pp. 415-418.
14. Korobkin M., Giordano T.J., Brodeur F.J., et. al.: Adrenal adenomas: Relationship between histologic lipid and CT and MR findings. Radiology 1996; 200: pp. 743-747.
15. Abrams H.L., Spiro R., Goldstein N.: Metastases in carcinoma: Analysis of 1000 autopsied cases. Cancer 1950; 3: pp. 74-85.
16. Blake M.A., Slattery J.M.A., Kalra M.K., Halpern E.F., Fischman A.J., Mueller P.R., et. al.: Adrenal lesions: Characterization with fused PET/CT image in patients with proved or suspected malignancy-initial experience. Radiology 2006; 238: pp. 970-977.
17. Bagheri B., Maurer A.H., Cone L., Doss M., Adler L.: Characterization of the normal adrenal gland with 18 F-FDG PET/CT. J Nucl Med 2004; 45: pp. 1340-1343.
18. Boellard R., Krak N.C., Hoekstra O.S., Lammertsma A.A.: Effect of noise, resolution, and ROI definition of the accuracy of standard uptake values: A simulation study. J Nucl Med 2004; 45: pp. 1519-1527.
19. Jaskowiak C.J., Bianco J.A., Perlman S.B., Fine J.P.: Influence of reconstruction iterations on 18F-FDG PET/CT standardized uptake values. J Nucl Med 2005; 46: pp. 424-428.
20. Wong C.Y., Thie J., Parling-Lynch K.J., Zakalik D., Margolis J.H., Gaskill M., et. al.: Glucose-normalized standardized uptake value from (18)F-FDG PET in classifying lymphomas. J Nucl Med 2005; 46: pp. 1659-1663.
21. Huang S.C.: Anatomy of SUV. Nucl Med Biol 2000; 27: pp. 643-646.
22. Stahl A., Ott K., Schwaiger M., Weber W.A.: Comparison of different SUV-based methods for monitoring cytotoxic therapy with FDG PET. Eur J Nucl Med Mol Imaging 2004; 31: pp. 1471-1479.
23. Diederichs C.G., Staib L., Glatting G., Beger H.G., et. al.: Elevated plasma glucose reduces both uptake and detection rate of pancreatic malignancies. J Nucl Med 1998; 39: pp. 1030-1033.
24. Zasadny K.R., Wahl R.L.: Standardized uptake values of normal tissues at PET with 2-(fluorine-18)-fluoro-2-deoxy-D-glucose: Variations with body weight and a method for correction. Radiology 1993; 189: pp. 847-850.