
Rationale and Objectives
The aim of this study was to reveal the distinctive features of magnetic resonance imaging (MRI) for distinguishing brucellar spondylodiscitis (BSD) from tuberculous spondylodiscitis (TSD) in the acute and subacute stages.
Methods
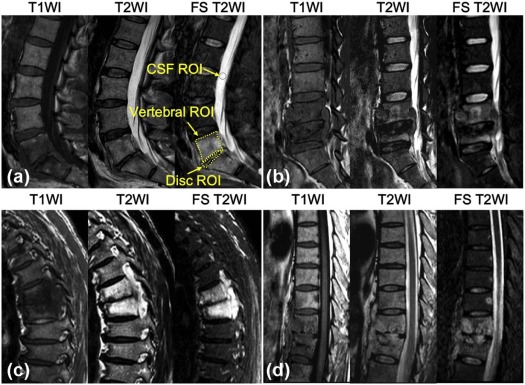
This study involved 14 patients with BSD and 18 patients with TSD from May 2011 to January 2015. BSD was diagnosed based on ≥1/160 titers of a Brucella agglutination test or isolation of Brucella spp. TSD was diagnosed based on the isolation of tuberculosis bacteria. All patients underwent T1- and T2-weight imaging (T1WI and T2WI) and fat suppression T2WI (FS T2WI). The height and the signal intensity (SI) of the vertebra and intervertebral disc were assessed. The distinctive MRI features were compared using the chi-square test. The SI of the vertebra between BSD and TSD was observed in terms of histogram characteristics of kurtosis, skewness, and percentile (75%–25%) on FS T2WI.
Results
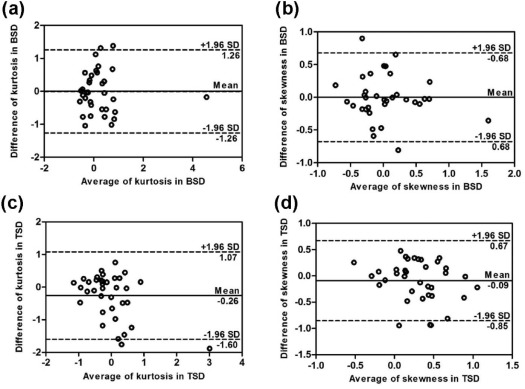
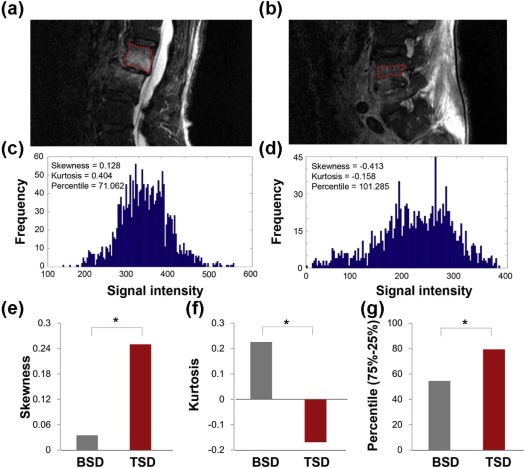
Twenty-nine (76.3%) vertebrae of BSD were infected throughout the whole vertebra, and 49 (90.7%) vertebrae of TSD were infected near the osseous end plate ( P < .001). Compared to TSD, the vertebral height of BSD was nearly intact ( P < .001), owing to the new bone formation in the end plate without vertebral collapse. Furthermore, significant differences in the SI of the vertebra were observed between patients with BSD and TSD in terms of homogeneous characteristics on FS T2WI, that is, kurtosis (BSD vs TSD, 0.107 vs −0.250, P = .023), skewness (BSD vs TSD, −0.021 vs 0.266, P = .017), and percentile (75%–25%) (BSD vs TSD, 54.498 vs 79.399, P = .00049).
Conclusions
The nearly intact vertebra with homogeneous high signal on FS T2WI was an important MRI feature for distinguishing BSD from TSD in the acute and subacute stages.
Introduction
Brucellosis is an important systemic zoonotic infection. Having a worldwide distribution, it mainly affects people in developing countries . It is endemic in areas such as the Mediterranean region, the Arabian Peninsula, the Indian subcontinent, Mexico, and parts of Central and South America. It is considered a public health problem in many countries. Brucellosis has variable and nonspecific clinical signs and symptoms. The majority of symptoms are fever, sweat, weakness, anorexia, headache, and backache. Its diagnosis may be difficult because brucellar spondylodiscitis (BSD) may resemble tuberculous spondylodiscitis (TSD) regarding similar clinical presentation and symptom in the acute (<3 months) and subacute (3–12 months) stages . BSD is easy to miss or may be misdiagnosed as TSD. A delayed diagnosis without appropriate treatment in the acute or subacute stages may lead to clinical morbidity and loss of productivity . The clinical differentiation of BSD and TSD is important because the medications used to manage these infections are notably different. Early diagnosis and prompt treatment with antibrucellar chemotherapy is known to be an effective treatment, whereas surgical decompression is rarely needed . Therefore, it is essential to screen first, relying on the imaging characteristics to determine whether it is brucellosis.
There are no previous studies differentiating BSD and TSD in the acute and subacute stages. The earliest response to vertebral osteomyelitis is the accumulation of water in the marrow. Early changes in the infected vertebral bodies have been previously observed on conventional T1- and T2-weighted images (T1WI and T2WI) . Fat suppression (FS) T2WI is more sensitive and reliable in the detection of water protons in contrast to T1WI and T2WI . Hence, the aim of our study was to compare the height and signal intensity (SI) of the vertebra and intervertebral disc to distinguish BSD from TSD in the acute and subacute stages using FS T2WI technique.
Materials and Methods
Patient Selection
Get Radiology Tree app to read full this article<
Get Radiology Tree app to read full this article<
MRI Protocols
Get Radiology Tree app to read full this article<
TABLE 1
Imaging Parameters of Magnetic Resonance Imaging Scan
Sequence TR/TE (ms) FOV (mm) Matrix ST (mm) NEX ETL SN TA T1WI 520/8 270 × 270 (cervical)
350 × 350 (thoracic)
300 × 300 (lumbar) 236 × 234 3 3 33 (cervical)
30 (thoracic)
26 (lumbar) 12 2 min 3 s (cervical)
2 min 31 s (thoracic)
1 min 43 s (lumbar) T2WI 3363/107 270 × 270 (cervical)
350 × 350 (thoracic)
300 × 300 (lumbar) 236 × 234 3 3 33 (cervical)
30 (thoracic)
26 (lumbar) 12 2 min 3 s (cervical)
3 min 36 s (thoracic)
2 min 7 s (lumbar) FS T2WI 3500/60 270 × 270 (cervical)
350 × 350 (thoracic)
300 × 300 (lumbar) 236 × 234 3 3 33 (cervical)
30 (thoracic)
26 (lumbar) 12 2 min 41 s (cervical)
2 min 18 s (thoracic)
3 min 32 s (lumbar)
ETL, echo-train length; FOV, field of view; NEX, number of excitations; SN, slice number; ST, section thickness; TA, time of acquisition, TE, echo time; TR, repetition time.
Get Radiology Tree app to read full this article<
Image Analysis
Assessment of Vertebra Signal Distribution and Height of the Vertebra and Disc
Get Radiology Tree app to read full this article<
Signal Intensity Measurement of the Vertebra and Disc
Get Radiology Tree app to read full this article<
Get Radiology Tree app to read full this article<
Get Radiology Tree app to read full this article<
Statistical Analysis
Get Radiology Tree app to read full this article<
Get Radiology Tree app to read full this article<
Get Radiology Tree app to read full this article<
skewness=σ−3∑N−1i=0(i−μ)3pi, skewness
=
σ
−
3
∑
i
=
0
N
−
1
(
i
−
μ
)
3
p
i
,
kurtosis=σ−4∑N−1i=0(i−μ)4pi−3. kurtosis
=
σ
−
4
∑
i
=
0
N
−
1
(
i
−
μ
)
4
p
i
−
3
.
Get Radiology Tree app to read full this article<
Get Radiology Tree app to read full this article<
Results
Clinical Baseline of Patients
Get Radiology Tree app to read full this article<
Get Radiology Tree app to read full this article<
TABLE 2
Patients’ Demographic, Clinical, and Hematological Data
Characteristics TSD Group BSD Group_P_ Value Age, y (mean ± SD) 39.44 ± 15.44 54.64 ± 9.77 .014 Gender (female/male) 7/11 5/9 .854 Duration of symptoms, mo (mean ± SD) 4.55 ± 2.11 3.77 ± 3.08 .725 Symptoms and signs Fever 13 (72.2%) 9 (64.3%) .712 Sweating 17 (94.4%) 7 (50%) .010 Back pain 18 (100%) 14 (100%) Not applicable Neurological deficiency 10 (55.6%) 1 (7%) .008 Laboratory findings (mean ± SD) ESR (mm/h) 43.27 ± 13.21 25.72 ± 13.81 .840 Level affected Cervical 0 2 (5.2%) .168 Thoracic 19 (35.2%) 10 (26.3%) .164 Lumbar 31 (57.4%) 25 (65.8%) .516 Sacral 4 (7.4%) 1 (2.6%) .400
BSD, brucellar spondylodiscitis; ESR, erythrocyte sedimentation rate, SD, standard deviation; TSD, tuberculous spondylodiscitis.
Get Radiology Tree app to read full this article<
Observer Agreement in the Interpretation of MRI Signs
Get Radiology Tree app to read full this article<
TABLE 3
Intraobserver and Interobserver Agreement for Vertebral and Disc Height
Observers Kappa Value Vertebral Height Disc Height Intraobserver A1-A2 0.907 0.702 B1-B2 0.726 0.833 Interobserver A1-B1 0.862 0.655 A1-B2 0.770 0.821 A2-B1 0.862 0.721 A2-B2 0.770 0.654
A1 and A2 were the first and the second assessment of the first observer, and B1 and B2 were the first and the second assessment of the second observer.
Get Radiology Tree app to read full this article<
Get Radiology Tree app to read full this article<
Get Radiology Tree app to read full this article<
MRI Characteristic Comparison Between BSD and TSD
Get Radiology Tree app to read full this article<
TABLE 4
Comparison of Signal Distribution Location of the Infected Vertebra, the Height of the Vertebra and Disc, the Signal Intensity of the Disc Between BSD and TSD
Classification BSD TSD_P_ Value Vertebra_n_ = 38n = 54 Distribution location of high SI <.001 Type A 29 (76.3%) 5 (9.3%) Type B 9 (23.7%) 49 (90.7%) Height of the vertebra <.001 Normal 34 (89.5%) 24 (44.4%) Flat 4 (10.5%) 30 (55.6%) Disc_n_ = 18n = 34 Height of the disc .395 Normal 5 (23.1%) 6 (17.6%) Flat 13 (76.9%) 28 (82.4%) Signal intensity of the disc SI disc /SI CSF 0%–30% 0 (0%) 10 (29.4%) .165 30%-60% 8 (44.4%) 15 (44.1%) .982 60%-100% 10 (55.6%) 9 (26.5%) .068
BSD, brucellar spondylodiscitis; CSF, cerebrospinal fluid; SI, signal intensity; TSD, tuberculous spondylodiscitis.
Get Radiology Tree app to read full this article<
Discussion
Get Radiology Tree app to read full this article<
Get Radiology Tree app to read full this article<
Get Radiology Tree app to read full this article<
Get Radiology Tree app to read full this article<
Get Radiology Tree app to read full this article<
Get Radiology Tree app to read full this article<
Get Radiology Tree app to read full this article<
Conclusions
Get Radiology Tree app to read full this article<
Acknowledgments
Get Radiology Tree app to read full this article<
Get Radiology Tree app to read full this article<
References
1. Doganay M., Aygen B.: Human brucellosis: an overview. Int J Infect Dis 2003; 7: pp. 173-182.
2. Pappas G., Papadimitriou P., Akritidis N.: The new global map of human brucellosis. Lancet Infect Dis 2006; 6: pp. 91-99.
3. Hashemi S.H., Keramat F., Ranjbar M., et. al.: Osteoarticular complications of brucellosis in Hamedan, an endemic area in the west of Iran. Int J Infect Dis 2007; 11: pp. 496-500.
4. Ariza J., Gudiol F., Valverde J., et. al.: Brucellar spondylitis: a detailed analysis based on current findings. Rev Infect Dis 1985; 7: pp. 656-664.
5. Lifeso R.M., Harder E., McCorkell S.J.: Spinal brucellosis. J Bone Joint Surg Br 1985; 67: pp. 345-351.
6. Rajapakse C.N., Al-Aska A.K., Al-Orainey I., et. al.: Spinal brucellosis. Br J Rheumatol 1987; 26: pp. 28-31.
7. Madkour M.M., Sharif H.S., Abed M.Y., et. al.: Osteoarticular brucellosis: results of bone scintigraphy in 140 patients. AJR Am J Roentgenol 1988; 150: pp. 1101-1105.
8. Yang X., Zhang Q., Guo X.: Value of magnetic resonance imaging in brucellar spondylodiscitis. Radiol Med 2014; 119: pp. 928-933.
9. Stabler A., Reiser M.F.: Imaging of spinal infection. Radiol Clin North Am 2001; 39: pp. 115-135.
10. Erdem H., Elaldi N., Batirel A., et. al.: Comparison of brucellar and tuberculous spondylodiscitis patients: results of the multicenter “Backbone-1 Study”. Spine J 2015; 15: pp. 2509-2517.
11. Genant H.K., Wu C.Y., van Kuijk C., et. al.: Vertebral fracture assessment using a semiquantitative technique. J Bone Miner Res 1993; 8: pp. 1137-1148.
12. Pfirrmann C.W., Metzdorf A., Zanetti M., et. al.: Magnetic resonance classification of lumbar intervertebral disc degeneration. Spine 2001; 26: pp. 1873-1878.
13. Glasgow M.M.: Brucellosis of the spine. Br J Surg 1976; 63: pp. 283-288.
14. Landis J.R., Koch G.G.: The measurement of observer agreement for categorical data. Biometrics 1977; 33: pp. 159-174.
15. Mostaço-Guidolin L.B., Ko A.C.T., Wang F., et. al.: Collagen morphology and texture analysis: from statistics to classification. Sci Rep 2013; 3: pp. 2190.
16. Sharif H.S., Aideyan O.A., Clark D.C., et. al.: Brucellar and tuberculous spondylitis: comparative imaging features. Radiology 1989; 171: pp. 419-425.
17. Sapico F.L., Montgomerie J.Z.: Pyogenic vertebral osteomyelitis: report of nine cases and review of the literature. Rev Infect Dis 1979; 1: pp. 754-776.
18. Hong S.H., Choi J.Y., Lee J.W., et. al.: MR imaging assessment of the spine: infection or an imitation?. Radiographics 2009; 29: pp. 599-612.
19. Dagirmanjian A., Schils J., McHenry M.C.: MR imaging of spinal infections. Magn Reson Imaging Clin N Am 1999; 7: pp. 525-538.
20. Kurtaran B., Sarpel T., Tasova Y., et. al.: Brucellar and tuberculous spondylitis in 87 adult patients. Infect Dis Clin Pract 2008; 16: pp. 166-173.
21. Park J.-H., Shin H.-S., Park J.T., et. al.: Differentiation between tuberculous spondylitis and pyogenic spondylitis on MR imaging. Korean J Spine 2011; 8: pp. 283-287.
22. Gouliamos A.D., Kehagias D.T., Lahanis S., et. al.: MR imaging of tuberculous vertebral osteomyelitis: pictorial review. Eur Radiol 2001; 11: pp. 575-579.
23. Sharif H.S., Clark D.C., Aabed M.Y., et. al.: Granulomatous spinal infections: MR imaging. Radiology 1990; 177: pp. 101-107.
24. Tali E.T., Koc A.M., Oner A.Y.: Spinal brucellosis. Neuroimaging Clin N Am 2015; 25: pp. 233-245.
25. Oztekin O., Calli C., Adibelli Z., et. al.: Brucellar spondylodiscitis: magnetic resonance imaging features with conventional sequences and diffusion-weighted imaging. Radiol Med 2010; 115: pp. 794-803.