
Rationale and Objectives
The study aimed to investigate whether intravoxel incoherent motion (IVIM) and dynamic contrast-enhanced (DCE) magnetic resonance imaging (MRI) can differentiate luminal-B from luminal-A breast cancer
Materials and Methods
Biexponential analyses of IVIM and DCE MRI were performed using a 3.0-T MRI scanner, involving 134 patients with 137 pathologically confirmed luminal-type invasive breast cancers. Luminal-type breast cancer was categorized as luminal-B breast cancer (LBBC, Ki-67 ≧ 14%) or luminal-A breast cancer (LABC, Ki-67 < 14%). Quantitative parameters from IVIM (pure diffusion coefficient [D], perfusion-related diffusion coefficient [D*], and fraction [f]) and DCE MRI (initial percentage of enhancement and signal enhancement ratio [SER]) were calculated. The apparent diffusion coefficient (ADC) was also calculated using monoexponential fitting. We correlated these data with the Ki-67 status.
Results
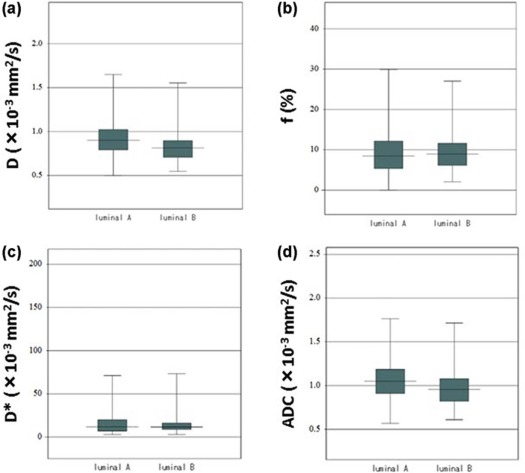
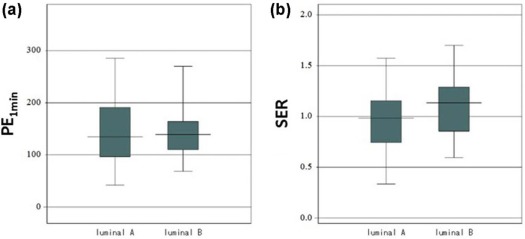
The D and ADC values of LBBC were significantly lower than those of LABC ( P = 0.028, P = 0.037). The SER of LBBC was significantly higher than that of LABC ( P = 0.004). A univariate analysis showed that a significantly lower D (<0.847 x 10 −3 mm 2 /s), lower ADC (<0.960 × 10 −3 mm 2 /s), and higher SER (>1.071) values were associated with LBBC (all P values <0.01), compared to LABC. In a multivariate analysis, a higher SER (>1.071; odds ratio: 3.0099, 95% confidence interval: 1.4246–6.3593; P = 0.003) value and a lower D (<0.847 × 10 −3 mm 2 /s; odds ratio: 2.6878, 95% confidence interval: 1.0445–6.9162; P = 0.040) value were significantly associated with LBBC, compared to LABC.
Conclusion
The SER derived from DCE MRI and the D derived from IVIM are associated independently with the Ki-67 status in patients with luminal-type breast cancer.
Introduction
Breast cancer is a group of heterogeneous diseases with various degrees of differentiation and gene expression of the cancer cell . Breast cancer is classified by genetic analysis into several intrinsic subtypes . Clinically, the three major subtypes categorized according to immunohistochemical methods are as follows: estrogen receptor (ER)-positive, human epidermal growth factor receptor 2 (HER2)-positive, and triple negative . The treatment strategy is anti-HER2 therapy for HER2-positive cancer and chemotherapy for triple negative cancer .
ER-positive and HER2-negative (luminal-type) breast cancer is the most frequent subtype. Clinically, the Ki-67 labeling index is used to categorize luminal-type breast cancer into luminal-A breast cancer (LABC, Ki-67 < 14%) and luminal-B breast cancer (LBBC, Ki67 ≧ 14%) . However, this measurement is not standardized, and there are many problems with quality control. The numerical value is expected to be different by the pathologist diagnosing the tumor. Unlike HER2-positive and triple negative cancer, the treatment strategy for luminal-type cancer is determined by the treating physician alone. For the patients with luminal-type cancer, physicians are often hesitant regarding which case to administer chemotherapy in addition to endocrine therapy . Ability to judge the grade of the malignancy of the whole tumor before the surgery or neoadjuvant chemotherapy is of major benefit to the physicians.
Get Radiology Tree app to read full this article<
Get Radiology Tree app to read full this article<
Get Radiology Tree app to read full this article<
Materials and Methods
Patients
Get Radiology Tree app to read full this article<
MR Imaging
Get Radiology Tree app to read full this article<
Diffusion Data Analysis
Get Radiology Tree app to read full this article<
Get Radiology Tree app to read full this article<
Sb/S0=exp(−bD) S
b
/
S
0
=
exp
(
−
bD
)
where D is the perfusion-independent diffusion coefficient. Subsequently, D was applied to the following equation (biexponential function). Thereafter, with the D fixed, perfusion-related diffusion coefficient (D*) and fraction (f) were derived using all the b-values:
Sb/S0=(1−f)exp(−bD)+fexp(−bD*) S
b
/
S
0
=
(
1
−
f
)
exp
(
−
bD
)
+
f
exp
(
−
bD
*
)
where S b is the signal intensity with diffusion gradient b and S 0 is the signal intensity without a diffusion gradient.
Get Radiology Tree app to read full this article<
Get Radiology Tree app to read full this article<
Sb/S0=exp(−b⋅ADC) S
b
/
S
0
=
exp
(
−
b
⋅
ADC
)
Get Radiology Tree app to read full this article<
Get Radiology Tree app to read full this article<
DCE MRI Data Analysis
Get Radiology Tree app to read full this article<
PE1min=(S1min−S0)/S0×100 PE
1
min
=
(
S
1
min
−
S
0
)
/
S
0
×
100
Get Radiology Tree app to read full this article<
Get Radiology Tree app to read full this article<
SER=(S1min−S0)/(S5min−S0) SER
=
(
S
1
min
−
S
0
)
/
(
S
5
min
−
S
0
)
Get Radiology Tree app to read full this article<
Immunohistochemical Analysis
Get Radiology Tree app to read full this article<
Statistical Analysis
Get Radiology Tree app to read full this article<
Results
Get Radiology Tree app to read full this article<
Get Radiology Tree app to read full this article<
Table 1
IVIM and DCE MRI Parameters and ADC Values in Luminal-Type Breast Cancer
Luminal-A Luminal-B_P_ D (×10 −3 mm 2 /s) 0.932 ± 0.260 0.838 ± 0.214 0.028 f (%) 9.695 ± 6.837 9.778 ± 5.799 0.941 D * (×10 −3 mm 2 /s) 18.567 ± 24.003 17.149 ± 22.382 0.728 ADC (×10 −3 mm 2 /s) 1.068 ± 0.272 0.974 ± 0.232 0.037 PE 1min 141.800 ± 61.123 145.576 ± 50.562 0.705 SER 0.949 ± 0.293 1.095 ± 0.283 0.004
ADC, apparent diffusion coefficient; D , perfusion-related diffusion coefficient; D, pure diffusion coefficient; DCE, dynamic contrast-enhanced; f, fraction; IVIM, intravoxel incoherent motion; MRI, magnetic resonance imaging; PE 1min , initial percentage of enhancement; SER, signal enhancement ratio.
Data are mean values ± standard deviations.
Get Radiology Tree app to read full this article<
Get Radiology Tree app to read full this article<
Get Radiology Tree app to read full this article<
Get Radiology Tree app to read full this article<
Get Radiology Tree app to read full this article<
Table 2
Logistic Regression Analysis of Factors Associated with Luminal-A Versus Luminal-B
Univariate Analysis Odds Ratio (95% CI)P Value Multivariate Analysis Odds Ratio (95% CI)P Value D 3.5648 (1.7406–7.3010) 0.0005 2.6878 (1.0445–6.9162) 0.0403 ADC 2.5846 (1.2762–5.2347) 0.0084 1.4727 (0.5663–3.8300) 0.4273 SER 3.0556 (1.5033–6.2108) 0.0020 3.0099 (1.4246–6.3593) 0.0039
ADC, apparent diffusion coefficient; CI, confidence interval; D, pure diffusion coefficient; SER, signal enhancement ratio.
Get Radiology Tree app to read full this article<
Get Radiology Tree app to read full this article<
Get Radiology Tree app to read full this article<
Discussion
Get Radiology Tree app to read full this article<
Get Radiology Tree app to read full this article<
Get Radiology Tree app to read full this article<
Get Radiology Tree app to read full this article<
Get Radiology Tree app to read full this article<
Get Radiology Tree app to read full this article<
Get Radiology Tree app to read full this article<
References
1. Sorlie T., Perou C.M., Tibshirani R., et. al.: Gene expression patterns of breast carcinomas distinguish tumor subclasses with clinical implications. Proc Natl Acad Sci USA 2001; 98: pp. 10869-10874.
2. Van de Vijver M.J., He Y.D., van’t Veer L.J., et. al.: A gene expression signature as a predictor of survival in breast cancer. N Engl J Med 2002; 347: pp. 1999-2009.
3. Desmedt C., Haibe-Kains B., Wirapati P., et. al.: Biological processes associated with breast cancer clinical outcome depend on the molecular subtypes. Clin Cancer Res 2008; 14: pp. 5158-5165.
4. Rouzier R., Perou C.M., Symmans W.F., et. al.: Breast cancer molecular subtypes respond differently to preoperative chemotherapy. Clin Cancer Res 2005; 11: pp. 5678-5685.
5. Montagna E., Bagnardi V., Rotmensz N., et. al.: Immunohistochemically defined subtypes and outcome in occult breast carcinoma with axillary presentation. Breast Cancer Res Treat 2011; 129: pp. 867-875.
6. Cheang M.C., Chia S.K., Voduc D., et. al.: Ki67 index, HER2 status, and prognosis of patients with luminal B breast cancer. J Natl Cancer Inst 2009; 101: pp. 736-750.
7. Sanchez-Munoz A., Garcia-Tapiador A.M., Martinez-Ortega E., et. al.: Tumour molecular subtyping according to hormone receptors and HER2 status defines different pathological complete response to neoadjuvant chemotherapy in patients with locally advanced breast cancer. Clin Transl Oncol 2008; 10: pp. 646-653.
8. Goldhirsch A., Wood W.C., Coates A.S., et. al.: Strategies for subtypes: dealing with the diversity of breast cancer—highlights of the St Gallen International Expert Consensus on the Primary Therapy of Early Breast Cancer. Ann Oncol 2011; 22: pp. 1736-1747.
9. Goldhirsch A., Winer E.P., Coates A.S., et. al.: Personalizing the treatment of woman with early breast cancer—highlights of the St Gallen International Expert Consensus on the Primary Therapy of Early Breast Cancer. Ann Oncol 2013; 24: pp. 2206-2223.
10. Kontzoglou K., Palla V., Karaolanis G., et. al.: Correlation between Ki67 and breast cancer prognosis. Oncology 2013; 84: pp. 219-225.
11. Colleoni M., Viale G., Zahrieh D., et. al.: Expression of ER, PgR, HER1, HER2, and response: a study of preoperative chemotherapy. Ann Oncol 2008; 19: pp. 465-472.
12. Yerushalmi R., Woods R., Ravdin P.M., et. al.: Ki67 in breast cancer: prognostic and predictive potential. Lancet Oncol 2010; 11: pp. 174-183.
13. Dowsett M., Nielsen T.O., A’Hern R., et. al.: Assessment of Ki67 in breast cancer: recommendations from the International Ki67 in Breast Cancer working group. J Natl Cancer Inst 2011; 103: pp. 1656-1664.
14. Guo Y., Cai Y.Q., Cai Z.L., et. al.: Differentiation of clinically benign and malignant breast lesions using diffusion-weighted imaging. J Magn Reson Imaging 2002; 16: pp. 172-178.
15. Kim S.H., Cha E.S., Kim H.S., et. al.: Diffusion-weighted imaging of breast cancer: correlation of the apparent diffusion coefficient value with prognostic factors. J Magn Reson Imaging 2009; 30: pp. 615-620.
16. Martincich L., Deantoni V., Bertotto I., et. al.: Correlations between diffusion-weighted imaging and breast cancer biomarkers. Eur Radiol 2012; 22: pp. 1519-1528.
17. Youk J.H., Son E.J., Chung J., et. al.: Triple-negative breast cancer on dynamic contrast-enhanced and diffusion-weighted MR imaging: comparison with other breast cancer subtypes. Eur Radiol 2012; 22: pp. 1724-1734.
18. Park S.H., Choi H.Y., Hahn S.Y.: Correlations between apparent diffusion coefficient values of invasive ductal carcinoma and pathologic factors on diffusion-weighted MRI at 3.0 tesla. J Magn Reson Imaging 2015; 41: pp. 175-182.
19. Mori N., Ota H., Mugikura S., et. al.: Luminal-type breast cancer: correlation of apparent diffusion coefficients with the Ki-67 labeling index. Radiology 2014; 274: pp. 66-73.
20. Le Bihan D., Breton E., Lallemand D., et. al.: MR imaging of intravoxel incoherent motions: application to diffusion and perfusion in neurologic disorders. Radiology 1986; 161: pp. 401-407.
21. Tamura T., Usui S., Murakami S., et. al.: Biexponential signal attenuation analysis of diffusion-weighted imaging of breast. Magn Reson Med Sci 2010; 9: pp. 195-207.
22. Sigmund E.E., Cho G.Y., Kim S., et. al.: Intravoxel incoherent motion imaging of tumor microenvironment in locally advanced breast cancer. Magn Reson Med 2011; 65: pp. 1437-1447.
23. Liu C., Liang C., Liu Z., et. al.: Intravoxel incoherent motion (IVIM) in evaluation of breast lesions: comparison with conventional DWI. Eur J Radiol 2013; 82: pp. e782-e789.
24. Bokacheva L., Kaplan J.B., Giri D.D., et. al.: Intravoxel incoherent motion diffusion-weighted MRI at 3.0 T differentiates malignant breast lesions from benign lesions and breast parenchyma. J Magn Reson Imaging 2014; 40: pp. 813-823.
25. Liu C., Wang K., Chan Q., et. al.: Intravoxel incoherent motion MR imaging for breast lesions: comparison and correlation with pharmacokinetic evaluation from dynamic contrast-enhanced MR imaging. Eur Radiol 2016; 26: pp. 3888-3898.
26. Ma D., Lu F., Zou X., et. al.: Intravoxel incoherent motion diffusion-weighted imaging as an adjunct to dynamic contrast-enhanced MRI to improve accuracy of the differential diagnosis of benign and malignant breast lesions. Magn Reson Imaging 2017; 36: pp. 175-179.
27. Lee Y.J., Kim S.H., Kang B.J., et. al.: Intravoxel incoherent motion (IVIM)-derived parameters in diffusion-weighted MRI: associations with prognostic factors in invasive ductal carcinoma. J Magn Reson Imaging 2017; 45: pp. 1394-1406.
28. Kim Y., Ko K., Kim D., et. al.: Intravoxel incoherent motion diffusion-weighted MR imaging of breast cancer: association with histopathological features and subtypes. Br J Radiol 2016; 89: pp. 20160140.
29. Cho G.Y., Moy L., Kim S.G., et. al.: Evaluation of breast cancer using intravoxel incoherent motion (IVIM) histogram analysis: comparison with malignant status, histological subtype, and molecular prognostic factors. Eur Radiol 2016; 26: pp. 2547-2558.
30. Patel J., Sigmund E.E., Rusinek H., et. al.: Diagnosis of cirrhosis with intravoxel incoherent motion diffusion MRI and dynamic contrast-enhanced MRI alone and in combination: preliminary experience. J Magn Reson Imaging 2010; 31: pp. 589-600.
31. Ohno N., Miyati T., Kobayashi S., et. al.: Modified triexponential analysis of intravoxel incoherent motion for brain perfusion and diffusion. J Magn Reson Imaging 2016; 43: pp. 818-823.
32. Partridge S.C., Heumann E.J., Hylton N.M.: Semi-automated analysis for MRI of breast tumors. Stud Health Technol Inform 1999; 62: pp. 259-260.
33. Kato F., Kudo K., Yamashita H., et. al.: Differences in morphological features and minimum apparent diffusion coefficient values among breast cancer subtypes using 3-tesla MRI. Eur J Radiol 2016; 85: pp. 96-102.
34. Shin J.K., Kim J.Y.: Dynamic contrast-enhanced and diffusion-weighted MRI of estrogen receptor-positive invasive breast cancers: associations between quantitative MR parameters and Ki-67 proliferation status. J Magn Reson Imaging 2016; 45: pp. 94-102.
35. Stomper P.C., Herman S., Klippenstein D.L., et. al.: Suspect breast lesions: findings at dynamic gadolinium-enhanced MR imaging correlated with mammographic and pathologic features. Radiology 1995; 197: pp. 387-395.
36. Fischer U., Kopka L., Brinck U., et. al.: Prognostic value of contrast-enhanced MR mammography in patients with breast cancer. Eur Radiol 1997; 7: pp. 1002-1005.
37. Lee S., Cho N., Kim S., et. al.: Correlation between high resolution dynamic MR features and prognostic factors in breast cancer. Korean J Radiol 2008; 9: pp. 10-18.
38. Koo H.R., Cho N., Song I.C., et. al.: Correlation of perfusion parameters on dynamic contrast-enhanced MRI with prognostic factors and subtypes of breast cancers. J Magn Reson Imaging 2012; 36: pp. 145-151.
39. Kim J.Y., Kim S.H., Kim Y.J., et. al.: Enhancement parameters on dynamic contrast enhanced breast MRI: do they correlate with prognostic factors and subtypes of breast cancers?. Magn Reson Imaging 2015; 33: pp. 72-80.
40. Lee H.S., Kim S.H., Kang B.J., et. al.: Perfusion parameters in dynamic contrast-enhanced MRI and apparent diffusion coefficient value in diffusion-weighted: association with prognostic factors in breast cancer. Acad Radiol 2016; 23: pp. 446-456.