
Rationale and Objectives
Low specificity of traditional ultrasound in differentiating benign from malignant thyroid nodules leads to a great number of unnecessary (ie, benign) fine-needle aspiration biopsies that causes a significant financial and physical burden to the patients. Ultrasound shear wave elastography is a technology capable of providing additional information related to the stiffness of tissues. In this study, quantitative stiffness values acquired by ultrasound shear wave elastography in two different imaging planes were evaluated for the prediction of malignancy in thyroid nodules. In addition, the association of elasticity measurements with sonographic characteristics of thyroid gland and nodules is presented.
Materials and Methods
A total number of 155 patients (106 female and 49 male) (average age 57.48 ± 14.44 years) with 173 thyroid nodules (average size 24.89 ± 15.41 mm, range 5–68 mm) scheduled for fine-needle aspiration biopsy were recruited from March 2015 to May 2017. Comb-push shear elastography imaging was performed at longitudinal and transverse anatomic planes. Mean (E mean ) and maximum (E max ) elasticity values were obtained.
Results
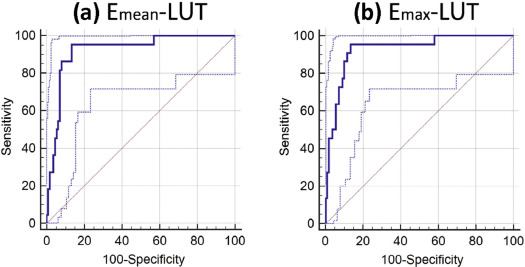
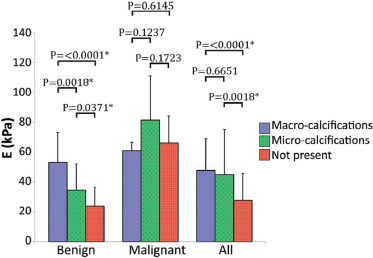
Measurements at longitudinal view were statistically significantly higher than measurements at transverse view. Nodules with calcifications were associated with increased elasticity, and nodules with a vascular component or within an enlarged thyroid gland (goiter) were associated with a lower elasticity value. Receiver operating characteristic curve analysis was performed for E mean and E max at each imaging plane and for the average of both planes. Sensitivity of 95.45%, specificity of 86.61%, 0.58 positive predictive value, and 0.99 negative predictive value were achieved by the average of the two planes for each E mean and E max parameters, with area under the curve of 92% and 93%, and a cutoff value of 49.09 kPa and 105.61 kPa, respectively.
Conclusions
The elastic properties of thyroid nodules showed promise to be a good discriminator between malignant and benign nodules ( P < .0001). However, probe orientation and internal features such as calcifications, vascular component, and goiter may influence the final elastography measurements. A larger number of malignant nodules need to be studied to further validate our results.
Introduction
Thyroid nodules commonly grow inside the thyroid gland and are mostly benign. Only 4%–6.5% of all thyroid nodules are cancerous . The majority of individuals with thyroid nodules have no symptoms. The nodules are usually found during routine physical examination with some incidental findings seen on diagnostic imaging (eg, ultrasound [US], computed tomography, magnetic resonance imaging, or positron emission tomography) performed for other indications . The current first line of evaluation of thyroid nodules encompasses thyroid hormone and thyroid-stimulating hormone laboratory tests, and ultrasonography of the thyroid gland. Ultrasonography is noninvasive and reveals many features relevant to the pathology of nodules. For example, an increased risk of malignancy has been associated with the presence of microcalcifications, irregular or spiculated margins with no halo, marked hypoechogenicity, mostly solid composition, and taller than wider shape. Although increased intranodular vascularity itself is not useful for differentiation of malignant from benign nodules , disordered central hypervascularity is more specific to US features of malignancy . On the other hand, presence of peripheral vascularity, round shape, isoechogenicity, spongiform appearance, smooth margins, and cystic composition are associated with benignancy .
Many studies have concluded that US features alone suffer from low accuracy. As such, fine-needle aspiration (FNA) biopsy is often used to rule out cancer in thyroid nodules . Although FNA is a safe and widely used procedure, complications such as discomfort or local pain and self-limited small hematomas may occur . Approximately 60%–80% of FNAs result in benign findings .
Get Radiology Tree app to read full this article<
Get Radiology Tree app to read full this article<
Materials and Methods
Study Population
Get Radiology Tree app to read full this article<
US Shear Wave Elastography
Get Radiology Tree app to read full this article<
Get Radiology Tree app to read full this article<
Statistical Analysis
Get Radiology Tree app to read full this article<
Results
Pathology
Get Radiology Tree app to read full this article<
Get Radiology Tree app to read full this article<
Repeatability Analysis
Get Radiology Tree app to read full this article<
SWE Results Compared to Sonographic Pattern and FNA Cytology
Get Radiology Tree app to read full this article<
TABLE 1
Comb-push Shear Elastography Results Compared to Sonographic Pattern Classification and Bethesda Diagnostic Category for Thyroid Nodules
Classification of ThyroidNodules Based onSonographic and FNAFindings Estimated Risk of Malignancy (%) Sonographic Pattern ( N ) Benign (0) Very Low Suspicion (42) Low Suspicion (66) Intermediate Suspicion (37) High Suspicion (28) <1 <3 5–10 10–20 >70–90 E mean ± SD (kPa) Bethesda DiagnosticCategory ( N ) I (15) 1–4 — 17 ± 7 (6) 17 ± 10 (2) 25 ± 6 (2) 24 ± 12 (5) II (112) 0–3 — 29 ± 17 (32) 30 ± 18 (53) 26 ± 18 (20) 40 ± 19 (7) III (1) 5–15 — — — 12 (1) — IV (20) 15–30 — 20 ± 14 (4) 26 ± 13 (8) 19 ± 3 (4) 15 ± 4 (4) V (3) 60–75 — — 35 ± 8 (2) 63 (1) — VI (22) 97–99 — — 59 (1) 62 ± 22 (9) 73 ± 17 (12) E max ± SD (kPa) Bethesda DiagnosticCategory ( N ) I (15) 1–4 — 44 ± 31 (6) 40 ± 30 (2) 47 ± 10 (2) 60 ± 31 (5) II (112) 0–3 — 58 ± 35 (32) 60 ± 36 (53) 57 ± 54 (20) 94 ± 48 (7) III (1) 5–15 — — — 23 (1) — IV (20) 15–30 — 35 ± 24 (4) 43 ± 18 (8) 46 ± 28 (4) 27 ± 4 (4) V (3) 60–75 — — 73 ± 29 (2) 145 (1) — VI (22) 97–99 — — 114 (1) 147 ± 49 (9) 164 ± 31 (12)
( N ) indicates statistical frequency; E mean , mean elasticity; E max , maximum elasticity.
I—Nondiagnostic or Unsatisfactory.
II—Benign.
III—Atypia of Undetermined Significance or Follicular Lesion of Undetermined Significance.
IV—Follicular Neoplasm or Suspicious for a Follicular Neoplasm.
V—Suspicious for Malignancy.
VI—Malignant.
Get Radiology Tree app to read full this article<
Get Radiology Tree app to read full this article<
SWE and Probe Orientation
Get Radiology Tree app to read full this article<
Get Radiology Tree app to read full this article<
Get Radiology Tree app to read full this article<
Get Radiology Tree app to read full this article<
TABLE 2
Comparison of Benign and Malignant Elasticity Measurements (Mean ± Standard Deviation) at Longitudinal, Transverse, and Combination of Views
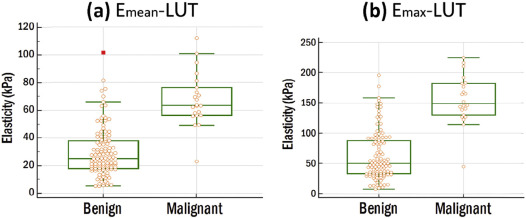
L ( N = 130) T ( N = 126) L∩T ( N = 122) L∪T ( N = 134)E mean ± SD (kPa) Benign 33.09 ± 22.28 (108) 25.41 ± 16.37 (109) 28.92 ± 17.48 (105) 29.53 ± 17.89 (112) Malignant 72.64 ± 21.81 (22) 57.94 ± 17.22 (17) 64.26 ± 16.04 (17) 67.76 ± 19.21 (22)P value <.0001 \* <.0001 \* <.0001 \* <.0001 \* E max ± SD (kPa) Benign 66.87 ± 44.37 (108) 56.01 ± 41.38 (109) 60.23 ± 37.42 (105) 62.53 ± 40.57 (112) Malignant 161.29 ± 42.08 (22) 139.05 ± 52.68 (17) 147.12 ± 39.52 (17) 155.05 ± 39.75 (22)P value <.0001 \* <.0001 \* <.0001 \* <.0001 \*
N indicates statistical frequency; E mean , mean elasticity; E max , maximum elasticity; L, longitudinal; T, transverse; L∩T, group of nodules with transverse and longitudinal measurements; L∪T, group of nodules with transverse and/or longitudinal measurements.
Get Radiology Tree app to read full this article<
Get Radiology Tree app to read full this article<
Receiver Operating Characteristic Analysis
Get Radiology Tree app to read full this article<
TABLE 3
Comparison of CUSE Diagnostic Performance Respect to Elasticity Parameters and Transducer Orientation for Bethesda Category II and VI
Cutoff (kPa) AUC (95% CI) Sensitivity (95% CI) Specificity (95% CI) E mean -L 48.40 0.91 (0.851–0.955) 95.45% (77.2–99.9) 83.33% (74.9–89.8) E mean -T 40.63 0.91 (0.840–0.950) 94.12% (71.3–99.9) 84.04% (76.2–90.6) E max -L 108.48 0.92 (0.864–0.963) 95.45% (77.2–99.9) 84.04% (79.2–92.7) E max -T 82.69 0.90 (0.829–0.943) 94.12% (71.3–99.9) 78.90% (70.0–86.1) E mean -L∩T 49.09 0.92(0.857–0.962) 94.12% (71.3–99.9) 86.67% (78.6–92.5) E max -L∩T 103.72 0.93(0.864–0.966) 94.12% (71.3–99.9) 87.62% (79.8–93.2) E mean -L∪T 49.09 0.92 (0.864–0.962) 95.45% (77.2–99.9) 86.61% (78.9–92.3) E max -L∪T 105.61 0.93 (0.872–0.966) 95.45% (72.2–99.9) 86.61% (78.9–92.3)
AUC, area under the curve; CI, confidence interval; E max , maximum elasticity; E mean , mean elasticity; L, longitudinal; L∩T,: group of nodules with transverse and longitudinal measurements; L∪T, group of nodules with transverse and/or longitudinal measurements.; T, transverse.
Get Radiology Tree app to read full this article<
Get Radiology Tree app to read full this article<
Ultrasound Features
Get Radiology Tree app to read full this article<
TABLE 4
Comparison of Mean Elasticity Measurements (in kPa) With Respect to Goiter, Graves’ Disease, and Heterogeneous Thyroid Gland
Thyroid Gland Pathologies Yes (kPa)N No (kPa)N__P Value NA (kPa)N Goiter Benign 23.22 ± 13.82 (30) 31.84 ± 18.71 (82) .0125 \* — (0) Malignant 94.34 (1) 65.64 ± 19.51 (19) .1572 74.66 ± 2.46 (2) All 23.41 ± 16.89 (41) 35.39 ± 21.79 (129) .0018 \* 51.99 ± 39.29 (3) Graves’ disease Benign 31.12 ± 11.76 (3) 29.49 ± 18.06 (109) .6459 — (0) Malignant — (0) 67.07 ± 20.05 (20) — 74.66 ± 2.46 (2) All 31.12 ± 11.76 (3) 33.02 ± 21.45 (167) .8798 51.99 ± 39.29 (3) Heterogeneous thyroid gland Benign 34.22 ± 24.37 (15) 29.00 ± 16.58 (92) .2982 25.30 ± 20.80 (5) Malignant — (0) 67.07 ± 20.05 (20) — 74.66 ± 2.46 (2) All 31.23 ± 23.29 (18) 32.90 ± 21.16 (147) .7355 25.30 ± 20.80
51.99 ± 39.29 (5)
(3)
N indicates statistical frequency; NA, not apply (results excluded from t test); All includes Bethesda categories I, II, III, IV, V, and VI.
Get Radiology Tree app to read full this article<
Get Radiology Tree app to read full this article<
Get Radiology Tree app to read full this article<
Get Radiology Tree app to read full this article<
Get Radiology Tree app to read full this article<
Get Radiology Tree app to read full this article<
Get Radiology Tree app to read full this article<
TABLE 5
Comparison of Mean Elasticity Measurements (in kPa) With Respect to Nodule Size, and Presence of Cystic and Vascular Components
Nodule Features <25 mm_N_ ≥25 mm_N__P_ Value Nodule size Benign 33.91 ± 19.13 (62) 24.11 ± 14.66 (50) .0035 \* Malignant 67.26 ± 20.02 (17) 69.47 ± 18.10 (5) .8278 All 37.49 ± 22.57 (103) 25.98 ± 18.40 (70) .0005 \*
Yes (kPa)N No (kPa)N__P Value Cystic component Benign 28.82 ± 18.07 (61) 30.39 ± 17.81 (51) .5338 Malignant 62.20 (1) 68.03 ± 19.64 (21) .6935 All 27.23 ± 17.99 (72) 36.83 ± 23.24 (101) .0039 \* Vascularity Benign 23.86 ± 14.55 (27) 31.33 ± 18.54 (85) .0403 \* Malignant 54.90 ± 18.89 (5) 71.55 ± 18.11 (17) .2246 All 27.12 ± 17.12 (44) 34.79 ± 22.77 (129) .0489 \*
N indicates statistical frequency; All includes Bethesda categories I, II, III, IV, V, and VI.
Get Radiology Tree app to read full this article<
Get Radiology Tree app to read full this article<
Discussion
Get Radiology Tree app to read full this article<
Get Radiology Tree app to read full this article<
Get Radiology Tree app to read full this article<
Conclusions
Get Radiology Tree app to read full this article<
Acknowledgments
Get Radiology Tree app to read full this article<
Get Radiology Tree app to read full this article<
Get Radiology Tree app to read full this article<
References
1. Lin J.-D., Chao T.-C., Huang B.-Y., et. al.: Thyroid cancer in the thyroid nodules evaluated by ultrasonography and fine-needle aspiration cytology. Thyroid 2005; 15: pp. 708-717.
2. Mandel S.J.: A 64-year-old woman with a thyroid nodule. JAMA 2004; 292: pp. 2632-2642.
3. Khadra H., Bakeer M., Hu T., et. al.: Vascular flow a predictor of malignant thyroid nodules: a meta-analysis. J Am Coll Surg 2014; 219: pp. e87-e88.
4. Moon H.J., Kwak J.Y., Kim M.J., et. al.: Can vascularity at power Doppler US help predict thyroid malignancy?. Radiology 2010; 255: pp. 260-269.
5. Haugen B.R., Alexander E.K., Bible K.C., et. al.: 2015 American Thyroid Association management guidelines for adult patients with thyroid nodules and differentiated thyroid cancer: the American Thyroid Association guidelines task force on thyroid nodules and differentiated thyroid cancer. Thyroid 2016; 26: pp. 1-133.
6. Anil G., Hegde A., Chong F.V.: Thyroid nodules: risk stratification for malignancy with ultrasound and guided biopsy. Cancer Imaging 2011; 11: pp. 209.
7. Hershman J.M.: Malignancy of a thyroid nodule can be predicted by ultrasonography if it has microcalcifications and is solid and larger than 2 cm. JAMA 2013;
8. Lyshchik A., Moses R., Barnes S.L., et. al.: Quantitative analysis of tumor vascularity in benign and malignant solid thyroid nodules. J Ultrasound Med 2007; 26: pp. 837-846.
9. Moon W.-J., Jung S.L., Lee J.H., et. al.: Benign and malignant thyroid nodules: US differentiation—multicenter retrospective study 1. Radiology 2008; 247: pp. 762-770.
10. Frates M.C., Benson C.B., Charboneau J.W., et. al.: Management of thyroid nodules detected at US: Society of Radiologists in Ultrasound Consensus Conference Statement 1. Radiology 2005; 237: pp. 794-800.
11. Brito J.P., Gionfriddo M.R., Al Nofal A., et. al.: The accuracy of thyroid nodule ultrasound to predict thyroid cancer: systematic review and meta-analysis. J Clin Endocrinol Metab 2013; 99: pp. 1253-1263.
12. Nikiforov Y.E., Ohori N.P., Hodak S.P., et. al.: Impact of mutational testing on the diagnosis and management of patients with cytologically indeterminate thyroid nodules: a prospective analysis of 1056 FNA samples. J Clin Endocrinol Metab 2011; 96: pp. 3390-3397.
13. Polyzos S.A., Anastasilakis A.D.: Clinical complications following thyroid fine-needle biopsy: a systematic review. Clin Endocrinol (Oxf) 2009; 71: pp. 157-165.
14. Cibas E.S., Ali S.Z.: The Bethesda system for reporting thyroid cytopathology. Am J Clin Pathol 2009; 132: pp. 658-665.
15. Bessey L.J., Lai N.B.K., Coorough N.E., et. al.: The incidence of thyroid cancer by FNA varies by age and gender. J Surg Res 2013; 184: pp. 761-765.
16. Yang J., Schnadig V., Logrono R., et. al.: Fine-needle aspiration of thyroid nodules: a study of 4703 patients with histologic and clinical correlations. Cancer 2007; 111: pp. 306-315.
17. Sarvazyan A.P., Rudenko O.V., Swanson S.D., et. al.: Shear wave elasticity imaging: a new ultrasonic technology of medical diagnostics. Ultrasound Med Biol 1998; 24: pp. 1419-1435.
18. Berg W.A., Cosgrove D.O., Doré C.J., et. al.: Shear-wave elastography improves the specificity of breast US: the BE1 multinational study of 939 masses. Radiology 2012; 262: pp. 435-449.
19. Bayat M., Denis M., Gregory A., et. al.: Diagnostic features of quantitative comb-push shear elastography for breast lesion differentiation. PLoS ONE 2017; 12: e0172801
20. Ferraioli G., Tinelli C., Dal Bello B., et. al.: Accuracy of real-time shear wave elastography for assessing liver fibrosis in chronic hepatitis C: a pilot study. Hepatology 2012; 56: pp. 2125-2133.
21. Palmeri M.L., Wang M.H., Rouze N.C., et. al.: Noninvasive evaluation of hepatic fibrosis using acoustic radiation force-based shear stiffness in patients with nonalcoholic fatty liver disease. J Hepatol 2011; 55: pp. 666-672.
22. Sebag F., Vaillant-Lombard J., Berbis J., et. al.: Shear wave elastography: a new ultrasound imaging mode for the differential diagnosis of benign and malignant thyroid nodules. J Clin Endocrinol Metab 2010; 95: pp. 5281-5288.
23. Bhatia K.S., Tong C.S., Cho C.C., et. al.: Shear wave elastography of thyroid nodules in routine clinical practice: preliminary observations and utility for detecting malignancy. Eur Radiol 2012; 22: pp. 2397-2406.
24. Veyrieres J.-B., Albarel F., Lombard J.V., et. al.: A threshold value in shear wave elastography to rule out malignant thyroid nodules: a reality?. Eur J Radiol 2012; 81: pp. 3965-3972.
25. Kim H., Kim J.-A., Son E.J., et. al.: Quantitative assessment of shear-wave ultrasound elastography in thyroid nodules: diagnostic performance for predicting malignancy. Eur Radiol 2013; 23: pp. 2532-2537.
26. Zhang B., Ma X., Wu N., et. al.: Shear wave elastography for differentiation of benign and malignant thyroid nodules. J Ultrasound Med 2013; 32: pp. 2163-2169.
27. Mehrmohammadi M., Denis M., Song P., et. al.: Comb-Push Ultrasound Shear Elastography of thyroid: Preliminary in vivo human study. Ultrasonics Symposium (IUS), 2014 IEEE International2014. IEEE
28. Song P., Urban M.W., Manduca A., et. al.: Comb-push ultrasound shear elastography (CUSE) with various ultrasound push beams. IEEE Trans Med Imaging 2013; 32: pp. 1435-1447.
29. Song P., Macdonald M.C., Behler R.H., et. al.: Two-dimensional shear-wave elastography on conventional ultrasound scanners with time-aligned sequential tracking (TAST) and comb-push ultrasound shear elastography (CUSE). IEEE Trans Ultrason Ferroelectr Freq Control 2015; 62: pp. 290-302.
30. Cosgrove D., Barr R., Bojunga J., et. al.: WFUMB guidelines and recommendations on the clinical use of ultrasound elastography: part 4. Thyroid. Ultrasound Med Biol 2017; 43: pp. 4-26.
31. Gregory A., Mehrmohammadi M., Denis M., et. al.: Effect of calcifications on breast ultrasound shear wave elastography: an investigational study. PLoS ONE 2015; 10: e0137898
32. Gangadhar K., Hippe D.S., Thiel J., et. al.: Impact of image orientation on measurements of thyroid nodule stiffness using shear wave elastography. J Ultrasound Med 2016; 35: pp. 1661-1667.
33. Gennisson J.-L., Deffieux T., Macé E., et. al.: Viscoelastic and anisotropic mechanical properties of in vivo muscle tissue assessed by supersonic shear imaging. Ultrasound Med Biol 2010; 36: pp. 789-801.
34. Eby S.F., Song P., Chen S., et. al.: Validation of shear wave elastography in skeletal muscle. J Biomech 2013; 46: pp. 2381-2387.
35. Kim M.-H., Luo S., Ko S.H., et. al.: Thyroid nodule parameters influencing performance of ultrasound elastography using intrinsic compression. Ultrasound Med Biol 2015; 41: pp. 2333-2339.
36. Cho Y.J., Ha E.J., Han M., et. al.: US elastography using carotid artery pulsation may increase the diagnostic accuracy for thyroid nodules with US-pathology discordance. Ultrasound Med Biol 2017; 43: pp. 1587-1595.
37. Park A.Y., Son E.J., Han K., et. al.: Shear wave elastography of thyroid nodules for the prediction of malignancy in a large scale study. Eur J Radiol 2015; 84: pp. 407-412.
38. Samir A.E., Dhyani M., Anvari A., et. al.: Shear-wave elastography for the preoperative risk stratification of follicular-patterned lesions of the thyroid: diagnostic accuracy and optimal measurement plane. Radiology 2015; 277: pp. 565-573.
39. Cosgrove D.O., Berg W.A., Doré C.J., et. al.: Shear wave elastography for breast masses is highly reproducible. Eur Radiol 2012; 22: pp. 1023-1032.