
Rationale and Objectives
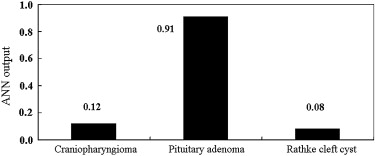
When pituitary adenoma, craniopharyngioma, and Rathke’s cleft cyst grow in the sellar and suprasellar region, it is often difficult to differentiate among these three lesions on magnetic resonance (MR) images. The purpose of this study was to apply an artificial neural network (ANN) for differential diagnosis among these three lesions with MR images and retrospectively evaluate the effect of ANN output on radiologists’ performance.
Materials and Methods
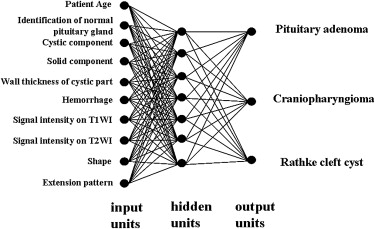
Forty-three patients with sellar-suprasellar masses were studied. The ANN was designed to differentiate among pituitary adenoma, craniopharyngioma, and Rathke’s cleft cyst by using patients’ ages and nine MR image findings obtained by three neuroradiologists using a subjective rating scale. In the observer performance test, MR images were viewed by nine radiologists, including four neuroradiologists and five general radiologists, first without and then with ANN output. The radiologists’ performance was evaluated using receiver-operating characteristic analysis with a continuous rating scale.
Results
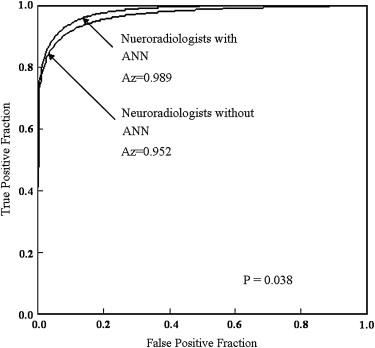
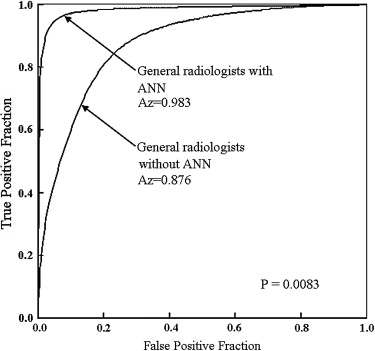
The ANN showed high performance in differentiation among the three lesions (area under the receiver-operating characteristic curve, 0.990). The average area under the curve for all radiologists for differentiation among the three lesions increased significantly from 0.910 to 0.985 ( P = .0024) when they used the computer output. Areas under the curves for the general radiologists and neuroradiologists increased from 0.876 to 0.983 ( P = .0083) and from 0.952 to 0.989 ( P = .038), respectively.
Conclusion
In diagnostic performance for differentiation among pituitary macroadenoma, craniopharyngioma, and Rathke’s cleft cyst with MR imaging, the ANN resulted in parity between neuroradiologists and general radiologists.
Pituitary adenoma is a common lesion in the sellar-suprasellar region and the third most common intracranial tumor after meningiomas and gliomas . Although most pituitary adenomas are histologically benign, they sometimes extend to adjacent structures. In addition, intratumoral hemorrhage and cystic change frequently accompany tumor growth . Rathke’s cleft cyst and craniopharyngioma are also common lesions in the sellar-suprasellar region . When they grow in the sellar and suprasellar region, it is often difficult to differentiate among the three lesions . Because the surgical approach or treatment is different for each of these diseases, it is important to diagnose these lesions accurately. A trans-sphenoidal approach is usually selected in cases of pituitary macroadenomas, whereas a trans-sphenoidal or transcranial approach is selected in cases of craniopharyngiomas. Asymptomatic Rathke’s cleft cysts are usually only observed, without any intervention.
With regard to other organs, the concept of computer-aided diagnosis for screening breast cancer with mammography and for screening lung cancer with chest radiography and/or computed tomography has been applied . The artificial neural network (ANN) is an important tool for computer-aided diagnostic systems, and the usefulness of ANN systems for the differentiation of diseases in many different organs has been reported . To our knowledge, however, an ANN scheme has not been applied to the differentiation among intracranial masses with magnetic resonance (MR) imaging. Our purpose in this study was to evaluate retrospectively the effect of an ANN on radiologists’ performance in differentiation among pituitary adenoma, Rathke’s cleft cyst, and craniopharyngioma on MR images.
Materials and methods
Database and MR Imaging
Get Radiology Tree app to read full this article<
Get Radiology Tree app to read full this article<
ANN Scheme
Get Radiology Tree app to read full this article<
Get Radiology Tree app to read full this article<
Get Radiology Tree app to read full this article<
Get Radiology Tree app to read full this article<
Get Radiology Tree app to read full this article<
Determination of Input Data for the ANN Scheme
Get Radiology Tree app to read full this article<
Evaluation of ANN Performance
Get Radiology Tree app to read full this article<
Get Radiology Tree app to read full this article<
Observer Performance Test
Get Radiology Tree app to read full this article<
Get Radiology Tree app to read full this article<
Get Radiology Tree app to read full this article<
Get Radiology Tree app to read full this article<
Statistical Analysis
Get Radiology Tree app to read full this article<
Results
ANN Performance and Observer Performance
Get Radiology Tree app to read full this article<
Table 1
Example of One Radiologist’s Subjective Ratings for Magnetic Resonance Imaging Findings as the Artificial Neural Network Input on a Magnetic Resonance Image of a Patient with Pituitary Macroadenoma
Input Ratings Patient age (y) 48 Normal pituitary gland 0.21 Cystic component 0.84 Solid component 1.0 Wall thickness of cystic part 0.81 Hemorrhage 0 Signal intensity on T1WI 0.64 Signal intensity on T2WI 0.09 Shape 0.63 Extension pattern 0.86
T1WI, T 1 -weighted imaging; T2WI, T 2 -weighted imaging.
![Figure 3, Four magnetic resonance (MR) images of a patient with pituitary macroadenoma for radiologists' subjective ratings of MR imaging findings as the artificial neural network input. (a) Sagittal T 2 -weighted image (repetition time [TR], 3600 ms; echo time [TE], 96 ms; number of signals, 1). (b) Sagittal T 1 -weighted image (TR, 400 ms; TE, 14 ms; number of signals, 1). (c) Sagittal postcontrast T 1 -weighted image (TR, 400 ms; TE, 14 ms; number of signals, 1). (d) Coronal postcontrast T 1 -weighted image (TR, 400 ms; TE, 14 ms; number of signals, 1). A pituitary macroadenoma with cystic degeneration extends to the suprasellar region.](https://storage.googleapis.com/dl.dentistrykey.com/clinical/DifferentiationofCommonLargeSellarSuprasellarMasses/2_1s20S1076633208005746.jpg)
Get Radiology Tree app to read full this article<
Get Radiology Tree app to read full this article<
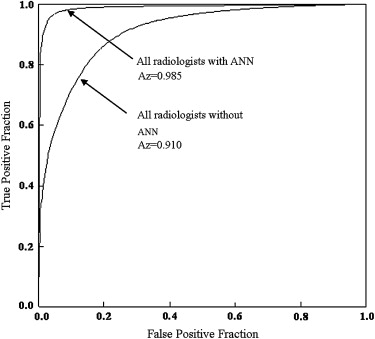
Table 2
Areas Under the Receiver-Operating Characteristic Curves for Radiologists in Differentiation Among Pituitary Adenoma, Craniopharyngioma, and Rathke’s Cleft Cyst
Observers Without ANN With ANN_P_ Value Neuroradiologists 1 0.949 0.996 2 0.941 1.000 3 0.989 0.999 4 0.929 0.962 Mean 0.952 0.989 .038 General radiologists 5 0.872 0.995 6 0.883 0.995 7 0.809 0.979 8 0.961 0.997 9 0.857 0.949 Mean 0.876 0.983 .0083 Overall 0.910 0.985 .0024
ANN, artificial neural network.
Get Radiology Tree app to read full this article<
Effect of ANN on Confidence Ratings
Get Radiology Tree app to read full this article<
![Figure 8, Number of cases (>20%) affected in confidence level by the artificial neural network output. Observers a to e were general radiologists; observers f to i were neuroradiologists. The average number of cases that were affected beneficially was significantly larger than that of cases that were affected detrimentally (mean number of cases, 3.2 [13%] vs 0.8 [3.7%]; ∗ P = .025).](https://storage.googleapis.com/dl.dentistrykey.com/clinical/DifferentiationofCommonLargeSellarSuprasellarMasses/7_1s20S1076633208005746.jpg)
Table 3
Summary of Cases Affected Beneficially and Detrimentally by the Artificial Neural Network
Observers and Diagnosis Cases Affected Beneficially Cases Affected Detrimentally Neuroradiologists Pituitary macroadenoma 0 0 Craniopharyngioma 0 1 Rathke’s cleft cyst 5 1 General radiologists Pituitary macroadenoma 4 0 Craniopharyngioma 3 1 Rathke’s cleft cyst 7 1
Get Radiology Tree app to read full this article<
Discussion
Get Radiology Tree app to read full this article<
Get Radiology Tree app to read full this article<
Get Radiology Tree app to read full this article<
Get Radiology Tree app to read full this article<
Acknowledgments
Get Radiology Tree app to read full this article<
References
1. Osborn A.G.: Sella and pituitary.Osborn A.G.Hedlund G.L.Blaser S.I. et. al.Diagnostic imaging: brain.2004.AMIRSYSSalt Lake City, UT: II-2-16–II-2-32
2. Osborn A.G.: Miscellaneous tumors, cysts, and metastases.Osborn A.G.Diagnostic neuroradiology.1994.MosbySt Louis, MO:pp. 639-654.
3. Choi S.H., Kwon B.J., Na D.G., Kin J.H., Han M.H., Chang K.H.: Pituitary adenoma, craniopharyngioma, and Rathke cleft cysts involving both intrasellar and suprasellar regions: differentiation using MRI. Clin Radiol 2007; 62: pp. 453-462.
4. Poussaint T.Y., Barnes P.D., Anthony D.C., et. al.: Hemorrhagic pituitary adenomas of adolescence. AJNR Am J Neuroradiol 1996; 17: pp. 1907-1912.
5. Kurihara N., Takahashi S., Higano S., et. al.: Hemorrhage in pituitary adenoma: correlation of MR imaging with operative findings. Eur Radiol 1998; 8: pp. 971-976.
6. Majos C., Coll S., Aguilera C., et. al.: Imaging of giant pituitary adenomas. Neuroradiology 1998; 40: pp. 651-655.
7. Hagiwara A., Inoue Y., Wakasa K., et. al.: Comparison of growth hormone-producing and non-growth hormone-producing pituitary adenomas: imaging characteristics and pathologic correlation. Radiology 2003; 228: pp. 533-538.
8. Bonneville F., Cattin F., Marsot-Dupuch K., Dormont D., Bonneville J.F., Chiras J.: T1 signal hyperintensity in the sellar region: spectrum of findings. RadioGraphics 2006; 26: pp. 93-113.
9. Sumida M., Uozumi T., Mukada K., et. al.: Rathke cleft cysts: correlation of enhanced MR and surgical findings. AJNR Am J Neuroradiol 1994; 15: pp. 525-532.
10. Freer T.W., Ulissey M.J.: Screening mammography with computer-aided detection: prospective study of 12,860 patients in a community breast center. Radiology 2001; 220: pp. 781-786.
11. Destounis S.V., DiNitto P., Logan-Young W., Bonaccio E., Zuley M.L., Willison K.M.: Can computer-aided detection with double reading of screening mammograms help decrease the false-negative rate? initial experience. Radiology 2004; 232: pp. 578-584.
12. MacMahon H., Engelmann R., Behlen F.M., et. al.: Computer-aided diagnosis of pulmonary nodules: results of a large-scale observer test. Radiology 1999; 213: pp. 723-726.
13. Awai K., Murao K., Ozawa A., et. al.: Pulmonary nodules at chest CT: effect of computer-aided diagnosis on radiologists’ detection performance. Radiology 2004; 230: pp. 347-352.
14. Chen C.M., Chou Y.H., Han K.C., et. al.: Breast lesions on sonograms: computer-aided diagnosis with nearly setting-independent features and artificial neural networks. Radiology 2003; 226: pp. 504-514.
15. Matsuki Y., Nakamura K., Watanabe H., et. al.: Usefulness of an artificial neyral network for differentiating from malignant nodules on high-resolution CT: Evaluation with receiver operating characteristics. AJR Am J Roentgenol 2002; 178: pp. 657-663.
16. Nakamura K., Yoshida H., Nakamura K., et. al.: Computerized analysis of the likelihood of malignancy in solitary pulmonary nodules with use of artificial neural networks. Radiology 2000; 214: pp. 823-830.
17. Matake K., Yoshimitsu K., Kumazawa S., et. al.: Usefulness of artificial neural network for differential diagnosis of hepatic masses on CT images. Acad Radiol 2006; 13: pp. 951-962.
18. Ashizawa K., MacMahon H., Ishida T., et. al.: Effect of an artificial neural network on radiologists’ performance in the differential diagnosis of interstitial lung disease using chest radiographs. AJR Am J Roentgenol 1999; 172: pp. 1311-1315.
19. Ashizawa K., Ishida T., MacMahon H., et. al.: Artificial neural networks in chest radiography: application to the differential diagnosis of interstitial lung disease. Acad Radiol 1999; 6: pp. 2-9.
20. Abe H., Ashizawa K., Katsuragawa S., MacMahon H., Doi K.: Use of artificial neural network to determine the diagnostic value of specific clinical and radiologic parameters in the diagnosis of interstitial lung disease on chest radiographs. Acad Radiol 2002; 9: pp. 13-17.
21. Gross G.W., Boone J.M., Greco-Hunt V., Greenberg B.: Neural networks in radiologic diagnosis. 2. Interpretation of neonatal chest radiographs. Invest Radiol 1990; 25: pp. 1017-1023.
22. Fukushima A., Ashizawa K., Doi K., et. al.: Application of an artificial neural network to high-resolution CT: usefulness in differential diagnosis of diffuse lung disease. AJR Am J Roentgenol 2004; 183: pp. 297-305.
23. Metz C.E.: ROC methodology in radiologic imaging. Invest Radiol 1986; 21: pp. 720-733.
24. Metz C.E., Herman B.A., Shen J.H.: Maximum-likelihood estimation of receiver operating (ROC) curves from continuously distributed data. Stat Med 1998; 17: pp. 1033-1053.
25. Metz C.E.: Some practical issues of experimental design and data analysis in radiological ROC studies. Invest Radiol 1989; 24: pp. 234-245.