
Rational and Objectives
Diffuse large B-cell lymphoma (DLBCL) represents the most common type of aggressive non-Hodgkin lymphoma (NHL); follicular lymphoma (FL) is the most frequent indolent NHL. The aim of this study was to investigate whether texture-based analysis of conventional magnetic resonance imaging (MRI) allows discrimination of DLBCL from FL, and further, to correlate the MRI texture features with diffusion-weighted imaging apparent diffusion coefficient (ADC) value and tumor tissue cellularity.
Materials and Methods
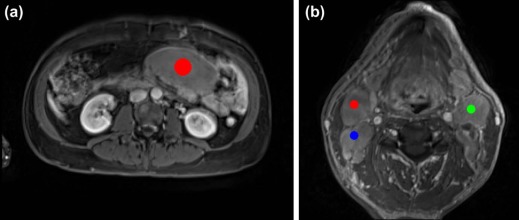
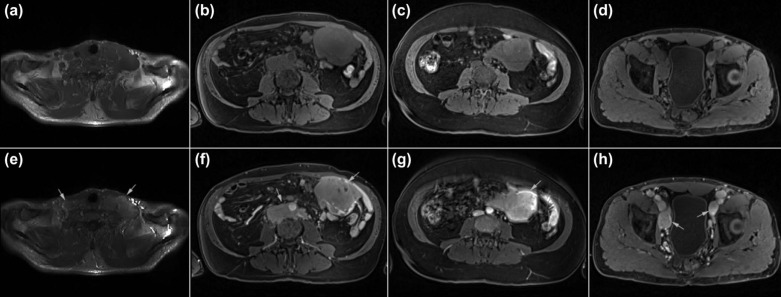
Forty-one patients with histologically proven NHL (30 DLBCL and 11 FL) underwent conventional MRI and diffusion-weighted imaging examination before treatment. Based on regions of interest, texture analysis was performed on T1-weighted images pre- and postcontrast enhancement and on T2-weighted images with and without fat suppression, and features derived from the run-length matrix- and co-occurrence matrix-based methods were analyzed. Receiver operating characteristic curves were performed for the three most discriminative texture features for the differentiation of the two most common types of lymphoma. The analyzed MRI texture features were correlated with the ADC value and the tumor tissue cellularity.
Results
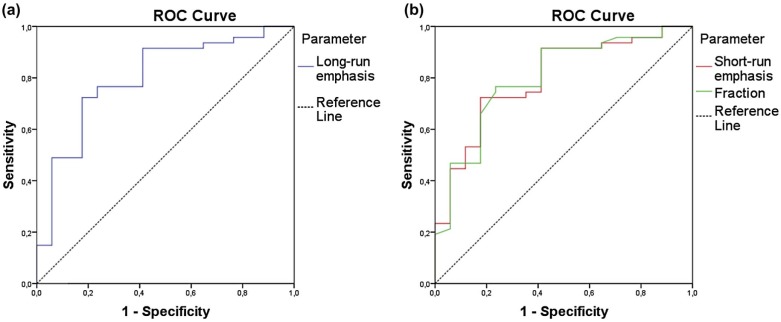
We found that on T1-weighted images postcontrast enhancement, run-length matrix-based texture analysis for lesion classification differentiated DLBCL from FL, with specificity and sensitivity of 76.6% and 76.5%, respectively. There was no correlation between the texture features and the ADC value or tumor tissue cellularity.
Conclusions
DLBCL and FL can be differentiated by means of texture analysis on T1-weighted MRI postcontrast enhancement. These results could serve as a basis for the use of the texture features on conventional MRI as adjunct to clinical examination to distinguish DLBCL from FL.
Introduction
Non-Hodgkin lymphoma (NHL) is a diverse group of malignant lymphoid neoplasms with variable clinical behavior and prognosis; it can be divided into an indolent group and an aggressive lymphoma group in clinical practice. The correct characterization of the tumor histology is essential for appropriate treatment planning, because the treatment strategies are different for aggressive and indolent lymphomas. Imaging studies have played an important role in the early diagnosis, accurate staging, and treatment response evaluation of lymphomas. Contrast-enhanced computed tomography (CT) and conventional magnetic resonance imaging (MRI) are commonly used in detecting the sites of the disease and in monitoring morphological changes after treatment. However, they rely on size criteria and could not differentiate between malignant and benign lesions. Diffusion-weighted imaging (DWI) allows quantification of the random motion of water molecules in tissue by means of apparent diffusion coefficient (ADC) measurements. Recently, DWI has been introduced as a new imaging modality that provides both morphological and functional information regarding characterization of lymphomas, and it has been used in detecting and staging malignant lymphomas, as well as in monitoring the response to therapy . However, it could not distinguish between diffuse large B-cell lymphoma (DLBCL) and follicular lymphoma (FL) . Positron emission tomography with the use of 2-deoxy-2-[ 18 F]fluoro-d-glucose tracer could differentiate aggressive from indolent lymphoma and guide biopsies in the detection of histological transformation of indolent lymphoma . However, it is relatively expensive, time-consuming, and involves exposure to ionizing radiation.
DLBCL represents the most common type of aggressive NHL; FL is the most frequent indolent NHL, and it accounts for more than 50% of NHL cases . About 40% of patients with an indolent lymphoma eventually experience a relapse with a more aggressive histology . Histological transformation of FL to a more aggressive NHL, most commonly DLBCL, is a pivotal event in the natural history of FL and is associated with poor outcome . If transformation from indolent to aggressive lymphoma is clinically suspected, it is mandatory to perform a biopsy for the histological confirmation. However, the lymphomatous site that contains the tumor cells with the highest malignancy grade can be missed by biopsy; as a result, multiple or repeated biopsies may sometimes be needed. Texture analysis is an image postprocessing approach that extracts quantitative information from a digital image based on mathematical analysis. It evaluates inter-pixel relationships that generate characteristic organizational patterns in an image, many of which, such as coarseness and regularity, are beyond the ability of visual perception . Many promising studies have been reported with MRI texture analysis in the classification of pathological tissues from normal tissues in liver , muscles , and brain , and in the classification of different pathological tissue types in breast cancer and liver tumor , as well as in monitoring lymphoma pathological changes after treatment . We hypothesize that the textural gray-level patterns on conventional MR images may indirectly reflect tumor histopathological heterogeneity, because microscopic level differences can be expected to manifest at a more macroscopic level by imaging analysis. The purpose of this study was to investigate whether MRI texture analysis allows discrimination of DLBCL from FL before treatment, and further, to correlate the MRI texture features with ADC value and tumor tissue cellularity.
Materials and Methods
Patients
Get Radiology Tree app to read full this article<
Get Radiology Tree app to read full this article<
Tumor Cellularity Analysis
Get Radiology Tree app to read full this article<
MR Image Acquisition
Get Radiology Tree app to read full this article<
TABLE 1
MR Parameters of the Analyzed Axial T1- and T2-weighted Images
MR Sequence Target Region FOV (mm 2 ) Matrix Slice (mm) Gap (mm) Number of Slices TR (ms) TE (ms) ETL (Number) Flip Angle (°) Acq.T (s) T1-weighted GE VIBE Neck 180 × 180 384 × 384 1 0 160 6.19 2.45 1 12 161 T2-weighted TSE Neck 280 × 280 384 × 384 3 0.6 47 9170 75 14 120 140 T2-weighted TSE with fs Neck 280 × 262.5 448 × 420 3 0.6 47 4340 67 13 140 140 T1-weighted GE VIBE Other regions \* 380 × 285 256 × 192 2 0 104 3.37 1.23 1 10 133 T2-weighted TSE Other regions 380 × 304 320 × 256 3 0 60 5061 81 11 140 131 T2-weighted TSE with fs Other regions 380 × 304 320 × 256 3 0 60 4595 82 11 140 132
Acq.T, acquisition time; ETL, echo train length; fs, fat suppression; FOV, field of view; GE, gradient echo; IR, inversion recovery; MR, magnetic resonance; ms, milliseconds; TSE, turbo spin-echo; VIBE, volumetric interpolated breath-hold examination.
Get Radiology Tree app to read full this article<
Get Radiology Tree app to read full this article<
Get Radiology Tree app to read full this article<
Texture Analysis
Get Radiology Tree app to read full this article<
Get Radiology Tree app to read full this article<
Get Radiology Tree app to read full this article<
ADC Value Measurement
Get Radiology Tree app to read full this article<
Statistical Analysis
Get Radiology Tree app to read full this article<
Results
Patient Characteristics
Get Radiology Tree app to read full this article<
TABLE 2
Demographic Characteristics (mean ± SD) and Clinical Staging of the 41 Patients with DLBCL or FL
Characteristics DLBCL FL Total ( n = 30) ( n = 11) ( n = 41) Age (years) Mean ± SD 66 ± 13 60 ± 8 64 ± 12 Range 32–86 50–77 32–86 Gender Female 12 8 20 Male 18 3 21 Ann Arbor stage I 3 0 3 II 6 1 7 III 8 7 15 IV 13 3 16 IPI or FLIPI \* 0–1 9 0 9 2 8 5 13 3 9 4 13 4 4 2 6
DLBCL, diffuse large B-cell lymphoma; FL, follicular lymphoma; FLIPI, Follicular Lymphoma International Prognostic Index; IPI, International Prognostic Index; SD, standard deviation.
Get Radiology Tree app to read full this article<
Get Radiology Tree app to read full this article<
Contrast-enhanced MRI
Get Radiology Tree app to read full this article<
Get Radiology Tree app to read full this article<
Texture Parameters and Texture-based Classification
Get Radiology Tree app to read full this article<
TABLE 3
Mean, Standard Deviation, and P values From Mann-Whitney U Test When Comparing Texture Parameters Between DLBCL and FL Groups on T1-weighted Images Postcontrast Enhancement
Parameters DLBCL (Mean ± SD) FL (Mean ± SD)P Value Co-occurrence matrix Angular second moment (*10 3 ) 3.68 ± 0.40 3.48 ± 0.350.003 Inverse difference moment (*10 2 ) 6.99 ± 2.25 5.68 ± 1.31 0.023 Entropy 2.46 ± 0.04 2.47 ± 0.04 0.312 Sum entropy 2.01 ± 0.05 2.03 ± 0.050.002 Difference entropy 1.53 ± 0.10 1.61 ± 0.08 0.028 Run-length matrix RL nonuniformity (*10 −2 ) 1.62 ± 0.09 1.64 ± 0.120.002 GL nonuniformity 2.82 ± 0.86 2.28 ± 0.280.005 Long-run emphasis 1.09 ± 0.04 1.06 ± 0.02<0.001 Short-run emphasis (*10) 9.79 ± 0.09 9.86 ± 0.04<0.001 Fraction (*10) 9.71 ± 0.12 9.81 ± 0.05<0.001
DLBCL, diffuse large B-cell lymphoma; FL, follicular lymphoma; SD, standard deviation; RL, run-length; GL, grey-level.
Bold means P < 0.005.
Get Radiology Tree app to read full this article<
ADC Value
Get Radiology Tree app to read full this article<
Cellularity
Get Radiology Tree app to read full this article<
Get Radiology Tree app to read full this article<
Discussion
Get Radiology Tree app to read full this article<
Get Radiology Tree app to read full this article<
Get Radiology Tree app to read full this article<
Get Radiology Tree app to read full this article<
Get Radiology Tree app to read full this article<
Get Radiology Tree app to read full this article<
Get Radiology Tree app to read full this article<
Acknowledgments
Get Radiology Tree app to read full this article<
Appendix
Supplementary material
Get Radiology Tree app to read full this article<
Appendix S1
Get Radiology Tree app to read full this article<
Get Radiology Tree app to read full this article<
References
1. Wu X., Kellokumpu-Lehtinen P.L., Pertovaara H., et. al.: Diffusion-weighted MRI in early chemotherapy response evaluation of patients with diffuse large B-cell lymphoma—a pilot study: comparison with 2-deoxy-2-fluoro-D-glucose-positron emission tomography/computed tomography. NMR Biomed 2011; 24: pp. 1181-1190.
2. Lin C., Luciani A., Itti E., et. al.: Whole-body diffusion-weighted magnetic resonance imaging with apparent diffusion coefficient mapping for staging patients with diffuse large B-cell lymphoma. Eur Radiol 2010; 20: pp. 2027-2038.
3. Wu X., Pertovaara H., Dastidar P., et. al.: ADC measurements in diffuse large B-cell lymphoma and follicular lymphoma: a DWI and cellularity study. Eur J Radiol 2013; 82: pp. e158-e164.
4. Kwee T.C., Ludwig I., Uiterwaal C.S., et. al.: ADC measurements in the evaluation of lymph nodes in patients with non-Hodgkin lymphoma: feasibility study. MAGMA 2011; 24: pp. 1-8.
5. Schoder H., Noy A., Gonen M., et. al.: Intensity of 18fluorodeoxyglucose uptake in positron emission tomography distinguishes between indolent and aggressive non-Hodgkin’s lymphoma. J Clin Oncol 2005; 23: pp. 4643-4651.
6. Bodet-Milin C., Kraeber-Bodere F., Moreau P., et. al.: Investigation of FDG-PET/CT imaging to guide biopsies in the detection of histological transformation of indolent lymphoma. Haematologica 2008; 93: pp. 471-472.
7. A clinical evaluation of the International Lymphoma Study Group classification of non-Hodgkin’s lymphoma. The Non-Hodgkin’s Lymphoma Classification Project. Blood 1997; 89: pp. 3909-3918.
8. Montoto S., Davies A.J., Matthews J., et. al.: Risk and clinical implications of transformation of follicular lymphoma to diffuse large B-cell lymphoma. J Clin Oncol 2007; 25: pp. 2426-2433.
9. Lossos I.S., Gascoyne R.D.: Transformation of follicular lymphoma. Best Pract Res Clin Haematol 2011; 24: pp. 147-163.
10. Castellano G., Bonilha L., Li L.M., et. al.: Texture analysis of medical images. Clin Radiol 2004; 59: pp. 1061-1069.
11. Jirak D., Dezortova M., Taimr P., et. al.: Texture analysis of human liver. J Magn Reson Imaging 2002; 15: pp. 68-74.
12. Herlidou S., Rolland Y., Bansard J.Y., et. al.: Comparison of automated and visual texture analysis in MRI: characterization of normal and diseased skeletal muscle. Magn Reson Imaging 1999; 17: pp. 1393-1397.
13. Herlidou-Meme S., Constans J.M., Carsin B., et. al.: MRI texture analysis on texture test objects, normal brain and intracranial tumors. Magn Reson Imaging 2003; 21: pp. 989-993.
14. Schad L.R., Bluml S., Zuna I.: MR tissue characterization of intracranial tumors by means of texture analysis. Magn Reson Imaging 1993; 11: pp. 889-896.
15. Bonilha L., Kobayashi E., Castellano G., et. al.: Texture analysis of hippocampal sclerosis. Epilepsia 2003; 44: pp. 1546-1550.
16. Holli K., Laaperi A.L., Harrison L., et. al.: Characterization of breast cancer types by texture analysis of magnetic resonance images. Acad Radiol 2010; 17: pp. 135-141.
17. Gibbs P., Turnbull L.W.: Textural analysis of contrast-enhanced MR images of the breast. Magn Reson Med 2003; 50: pp. 92-98.
18. Mayerhoefer M.E., Schima W., Trattnig S., et. al.: Texture-based classification of focal liver lesions on MRI at 3.0 Tesla: a feasibility study in cysts and hemangiomas. J Magn Reson Imaging 2010; 32: pp. 352-359.
19. Harrison L., Dastidar P., Eskola H., et. al.: Texture analysis on MRI images of non-Hodgkin lymphoma. Comput Biol Med 2008; 38: pp. 519-524.
20. Harris N.L., Jaffe E.S., Stein H., et. al.: A revised European-American classification of lymphoid neoplasms: a proposal from the International Lymphoma Study Group. Blood 1994; 84: pp. 1361-1392.
21. Kankaanpaa P., Paavolainen L., Tiitta S., et. al.: BioImageXD: an open, general-purpose and high-throughput image-processing platform. Nat Methods 2012; 9: pp. 683-689.
22. Szczypinski P.M., Strzelecki M., Materka A., et. al.: MaZda—a software package for image texture analysis. Comput Methods Programs Biomed 2009; 94: pp. 66-76.
23. Sabo E., Beck A.H., Montgomery E.A., et. al.: Computerized morphometry as an aid in determining the grade of dysplasia and progression to adenocarcinoma in Barrett’s esophagus. Lab Invest 2006; 86: pp. 1261-1271.
24. Li T.G., Wang S.P., Zhao N.: Gray-scale edge detection for gastric tumor pathologic cell images by morphological analysis. Comput Biol Med 2009; 39: pp. 947-952.
25. Weyn B., Jacob W., da Silva V.D., et. al.: Data representation and reduction for chromatin texture in nuclei from premalignant prostatic, esophageal, and colonic lesions. Cytometry 2000; 41: pp. 133-138.
26. Vacca A., Ribatti D., Roncali L., et. al.: Angiogenesis in B cell lymphoproliferative diseases. Biological and clinical studies. Leuk Lymphoma 1995; 20: pp. 27-38.
27. Vacca A., Ribatti D., Ruco L., et. al.: Angiogenesis extent and macrophage density increase simultaneously with pathological progression in B-cell non-Hodgkin’s lymphomas. Br J Cancer 1999; 79: pp. 965-970.
28. Wang J., Takashima S., Takayama F., et. al.: Head and neck lesions: characterization with diffusion-weighted echo-planar MR imaging. Radiology 2001; 220: pp. 621-630.
29. Perrone A., Guerrisi P., Izzo L., et. al.: Diffusion-weighted MRI in cervical lymph nodes: differentiation between benign and malignant lesions. Eur J Radiol 2011; 77: pp. 281-286.
30. Padhani A.R., Liu G., Koh D.M., et. al.: Diffusion-weighted magnetic resonance imaging as a cancer biomarker: consensus and recommendations. Neoplasia 2009; 11: pp. 102-125.
31. Patterson D.M., Padhani A.R., Collins D.J.: Technology insight: water diffusion MRI—a potential new biomarker of response to cancer therapy. Nat Clin Pract Oncol 2008; 5: pp. 220-233.
32. Guo A.C., Cummings T.J., Dash R.C., et. al.: Lymphomas and high-grade astrocytomas: comparison of water diffusibility and histologic characteristics. Radiology 2002; 224: pp. 177-183.