
Rationale and Objectives
This study aimed to investigate the potential of contrast-enhanced magnetic resonance imaging features to differentiate between mass-forming intrahepatic cholangiocellular carcinoma (ICC) and hepatocellular carcinoma (HCC) in cirrhotic livers.
Materials and Methods
This study, performed between 2001 and 2013, included 64 baseline magnetic resonance imaging examinations with pathohistologically proven liver cirrhosis, presenting with either ICC ( n = 32) or HCC ( n = 32) tumors. To distinguish ICC form HCC tumors, 20 qualitative single-lesion descriptors were evaluated by two readers, in consensus, and statistically classified using the chi-square automatic interaction detection (CHAID) methodology. Diagnostic performance was assessed by a receiver operating characteristic analysis.
Results
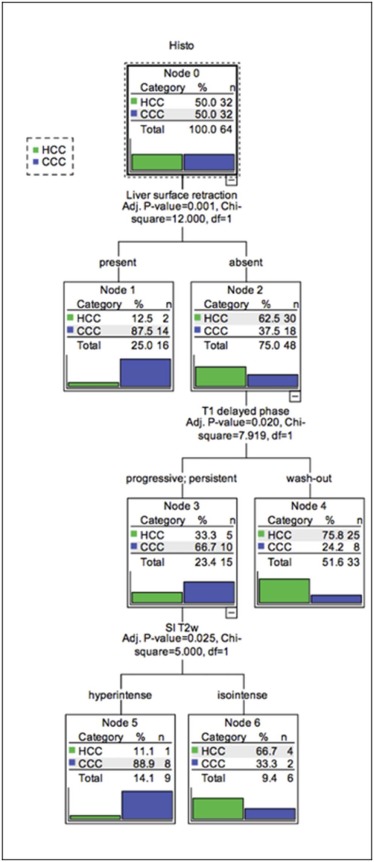
The CHAID algorithm identified three independent categorical lesion descriptors, including (1) liver capsular retraction; (2) progressive or persistent enhancement pattern or wash-out on the T1-weighted delayed phase; and (3) signal intensity appearance on T2-weighted images that could help to reliably differentiate ICC from HCC, which resulted in an AUC of 0.807, and a sensitivity and specificity of 68.8 and 90.6 (95% confidence interval 75.0–98.0), respectively.
Conclusions
The proposed CHAID algorithm provides a simple and robust step-by-step classification tool for a reliable and solid differentiation between ICC and HCC tumors in cirrhotic livers.
Introduction
Liver cirrhosis is one of the major risk factors for the development of primary hepatic malignancies . It is a relatively common disease, with an estimated prevalence of 0.3% among adults in the industrialized world . Moreover, liver malignancies rank, depending on gender and geographic region, as the fifth most common cancer . The treatment options are varied, depending on the number and location of the lesions, stage of cirrhosis, presence or absence of portal hypertension, and the general functional status of the patient. These options may include surgical resection, interventional procedures, liver transplantation and systemic therapy, or supportive care in advanced stages . The correct diagnosis of these entities affects the treatment, because therapy of intrahepatic cholangiocellular carcinoma (ICC) or combined hepatocellular-cholangiocellular carcinoma (cHCC-CC) is vastly different from the more common form of hepatocellular carcinoma (HCC) in nonsurgical cases. Thus, considering the frequent incidence of liver cirrhosis and the prevalence of the resultant liver cancer, there is great urgency to improve our methods of exact characterization of these different types in the setting of liver cirrhosis.
In up to 85% of cases, HCC usually develops in patients with liver cirrhosis . In addition, ICC is also associated with the abovementioned risk factors and may occur in cirrhotic livers due to long-standing chronic inflammation as the second most common primary liver tumor . The common associations with regard to cell lineage have yet to be fully elucidated, but it has been suggested that there is a common origin for HCC and ICC tumors. Based on the transformation of hepatic stem cells, it was shown that hepatic progenitor cells are able to transform into HCC, ICC, or mixed types in cirrhotic livers .
Get Radiology Tree app to read full this article<
Get Radiology Tree app to read full this article<
Materials and Methods
Study Design
Get Radiology Tree app to read full this article<
Imaging Techniques
Get Radiology Tree app to read full this article<
Image Analysis
Get Radiology Tree app to read full this article<
TABLE 1
Simplified Illustration of Morphological and Kinetic Imaging Features
Descriptor SI T1w/T2w lesion internal structure


 Hypointense Hyperintense Isointense Homogeneous Heterogeneous T1w arterial


 Homogeneous hyperintense Heterogeneous hyperintense Rim enhancement Isointense Hypointense T1w portal venous, delayed phase, HBP
 Wash-out Decrease in SI compared to the previous dynamic phase
 Persistent No further increase or decrease in SI compared to the previous dynamic phase
 Progressive Progressive in SI compared to the previous dynamic phase Target sign
 DWI HBP
DWI, diffusion-weighted imaging; HBP, hepatobiliary phase; SI, signal intensity; T1w, T1-weighted; T2w, T2-weighted.
Get Radiology Tree app to read full this article<
Get Radiology Tree app to read full this article<
Get Radiology Tree app to read full this article<
Statistical Analysis
Get Radiology Tree app to read full this article<
Get Radiology Tree app to read full this article<
TABLE 2
Descriptive results for each tumor category
Descriptor Category HCC ( N = 32) Percent ICC ( N = 32) Percent_P_ Value Lesion shape Lobulated 3 9.4% 8 25.0% .158 Round 16 50.0% 10 31.3% Unsharp 13 40.6% 14 43.8% Capsule Absent 19 59.4% 26 81.3% .055 Present 13 40.6% 6 18.8% Vascular invasion Absent 22 68.8% 21 65.6% 1.000 Present 10 31.3% 11 34.4% Affected vessels Absent 23 71.9% 21 65.6% .960 Portal vein 8 25.0% 8 25.0% Liver vein 1 3.1% 3 9.4% Liver surface retraction Absent 30 93.8% 19 59.4% .001 Present 2 6.3% 13 40.6% Bile duct dilatation Absent 29 90.6% 24 75.0% .098 Present 3 9.4% 8 25.0% Central scar Absent 30 93.8% 31 96.9% .554 Present 2 6.3% 1 3.1% Lesion internal structure Homogeneous 21 65.6% 18 56.3% .442 Inhomogeneous 11 34.4% 14 43.8% Intralesional fat Absent 17 53.1% 29 90.6% .001 Present 15 46.9% 3 9.4% Target sign DWI Absent 21 65.6% 9 28.1% .001 Present — — 9 28.1% Missing 11 34.4% 14 43.8% Target sign HBP Absent 21 65.6% 6 18.8% .001 Present — — 7 21.9% Missing 11 34.4% 19 59.4% SI T1w Hypointense 12 37.5% 23 71.9% .010 Hyperintense 7 21.9% 1 3.1% Isointense 13 40.6% 8 25.0% SI T2w Hypointense 1 3.1% — — .088 Hyperintense 17 53.1% 25 78.1% Isointense 14 43.8% 7 21.9% SI DWI Hyperintense 18 56.3% 17 53.1% .157 Isointense 3 9.4% 1 3.1% Missing 11 34.4% 14 43.8% T1w arterial Homogenous hyperintense 15 46.9% 8 25.0% .027 Heterogenous hyperintense 14 43.8% 10 31.3% Rim enhancement 2 6.3% 12 37.5% Isointense 1 3.1% 1 3.1% Hypointense — — 1 3.1% T1w portal venous Wash-out 18 56.3% 5 15.6% .002 Persistent 10 31.3% 14 43.8% Progressive 4 12.5% 13 40.6% T1w delayed phase Wash-out 26 81.3% 13 40.6% .004 Persistent 4 12.5% 11 34.4% Progressive 2 6.3% 8 25.0% T1w HBP Wash-out 16 50.0% 11 34.4% .181 Persistent 4 12.5% 2 6.3% Progressive 1 3.1% — — Missing 11 34.4% 19 59.4% Ascites Absent 9 28.1% 10 31.3% .784 Present 23 71.9% 22 68.8% PV thrombosis Absent 22 68.8% 23 71.9% .784 Present 10 31.3% 9 28.1%
DWI, diffusion-weighted imaging; HBP, hepatobiliary phase; N, number of cases; PV, portal vein; SI, signal intensity; T1w, T1-weighted; T2w, T2-weighted.
Get Radiology Tree app to read full this article<
Results
Get Radiology Tree app to read full this article<
Get Radiology Tree app to read full this article<
Get Radiology Tree app to read full this article<
Get Radiology Tree app to read full this article<
TABLE 3
Areas under the ROC curves (AUC) for all three readers and for the tree flowchart with corresponding standard errors and 95% confidence intervals
Test Result Variable(s) Area Std. Error 95% Confidence Interval Lower Bound Upper Bound Reader 1 0.836 0.046 0.722 0.917 Reader 2 0.797 0.050 0.678 0.887 Reader 3 0.707 0.053 0.580 0.814 Reader 4 0.703 0.058 0.576 0.811 Tree 0.807 0.052 0.690 0.896
AUC, area under the curve; ROC, receiver operating characteristics; Std. Error, standard error.
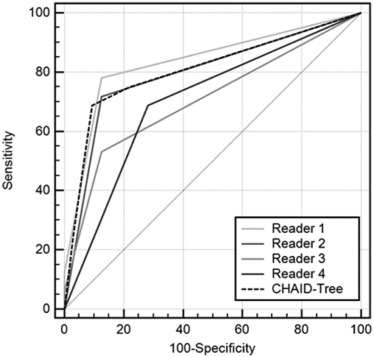
TABLE 4
Diagnostic parameters derived from ROC analysis
Criterion HCC (TP/TP+FN) 95% CI ICC (TN/TN+FP) 95% CI +LR −LR Accuracy (TP+TN/Total) Reader 1 78.1 (25/32) 60.0–90.7 87.5 (28/32) 71.0–96.5 6.25 0.25 82.8 (53/64) Reader 2 71.9 (23/32) 53.3–86.3 87.5 (28/32) 71.0–96.5 5.75 0.32 80.7 (51/64) Reader 3 53.1 (17/32) 34.7–70.9 87.5 (28/32) 71.0–96.5 4.25 0.54 70.3 (45/64) Reader 4 68.8 (22/32) 50.0–83.9 71.9 (23/32) 53.3–86.3 2.44 0.43 70.3 (45/64) Tree 68.8 (22/32) 50.0–83.9 90.6 (29/32) 75.0–98.0 7.33 0.34 80.7 (51/64)
CI, confidence interval; FN, false negative; FP, false positive; +LR, positive likelihood ratio; −LR, negative likelihood ratio; ROC, receiver operating characteristics; TN, true negative; TP, true positive.
Get Radiology Tree app to read full this article<
Get Radiology Tree app to read full this article<
Discussion
Get Radiology Tree app to read full this article<
Get Radiology Tree app to read full this article<
Get Radiology Tree app to read full this article<
Get Radiology Tree app to read full this article<
Get Radiology Tree app to read full this article<
Get Radiology Tree app to read full this article<
Get Radiology Tree app to read full this article<
Get Radiology Tree app to read full this article<
Get Radiology Tree app to read full this article<
Get Radiology Tree app to read full this article<
References
1. Khan S.A., Toledano M.B., Taylor-Robinson S.D.: Epidemiology, risk factors, and pathogenesis of cholangiocarcinoma. HPB (Oxford) 2008; 10: pp. 77-82.
2. Scaglione S., Kliethermes S., Cao G., et. al.: The epidemiology of cirrhosis in the United States: a population-based study. J Clin Gastroenterol 2015; 49: pp. 690-696.
3. Poynard T., Lebray P., Ingiliz P., et. al.: Prevalence of liver fibrosis and risk factors in a general population using non-invasive biomarkers (FibroTest). BMC Gastroenterol 2010; 10: pp. 40.
4. Ferlay J., Soerjomataram I., Dikshit R., et. al.: Cancer incidence and mortality worldwide: sources, methods and major patterns in GLOBOCAN 2012. Int J Cancer 2015; 136: pp. E359-E386.
5. Bruix J., Sherman M., American Association for the Study of Liver D: Management of hepatocellular carcinoma: an update. Hepatology 2011; 53: pp. 1020-1022.
6. Weber S.M., Ribero D., O’Reilly E.M., et. al.: Intrahepatic cholangiocarcinoma: expert consensus statement. HPB (Oxford) 2015; 17: pp. 669-680.
7. Yang J.D., Kim W.R., Coelho R., et. al.: Cirrhosis is present in most patients with hepatitis B and hepatocellular carcinoma. Clin Gastroenterol Hepatol 2011; 9: pp. 64-70.
8. Palmer W.C., Patel T.: Are common factors involved in the pathogenesis of primary liver cancers? A meta-analysis of risk factors for intrahepatic cholangiocarcinoma. J Hepatol 2012; 57: pp. 69-76.
9. Shaib Y., El-Serag H.B.: The epidemiology of cholangiocarcinoma. Semin Liver Dis 2004; 24: pp. 115-125.
10. de Jong M.C., Nathan H., Sotiropoulos G.C., et. al.: Intrahepatic cholangiocarcinoma: an international multi-institutional analysis of prognostic factors and lymph node assessment. J Clin Oncol 2011; 29: pp. 3140-3145.
11. Fan B., Malato Y., Calvisi D.F., et. al.: Cholangiocarcinomas can originate from hepatocytes in mice. J Clin Invest 2012; 122: pp. 2911-2915.
12. Kokuryo T., Yokoyama Y., Nagino M.: Recent advances in cancer stem cell research for cholangiocarcinoma. J Hepatobiliary Pancreat Sci 2012; 19: pp. 606-613.
13. Kumar M., Zhao X., Wang X.W.: Molecular carcinogenesis of hepatocellular carcinoma and intrahepatic cholangiocarcinoma: one step closer to personalized medicine?. Cell Biosci 2011; 1: pp. 5.
14. Sekiya S., Suzuki A.: Intrahepatic cholangiocarcinoma can arise from Notch-mediated conversion of hepatocytes. J Clin Invest 2012; 122: pp. 3914-3918.
15. Lee Y.J., Lee J.M., Lee J.S., et. al.: Hepatocellular carcinoma: diagnostic performance of multidetector CT and MR imaging—a systematic review and meta-analysis. Radiology 2015; 275: pp. 97-109.
16. Dhanasekaran R., Limaye A., Cabrera R.: Hepatocellular carcinoma: current trends in worldwide epidemiology, risk factors, diagnosis, and therapeutics. Hepat Med 2012; 4: pp. 19-37.
17. Gaba R.C., Kallwitz E.R., Parvinian A., et. al.: Imaging surveillance and multidisciplinary review improves curative therapy access and survival in HCC patients. Ann Hepatol 2013; 12: pp. 766-773.
18. Razumilava N., Gores G.J.: Cholangiocarcinoma. Lancet 2014; 383: pp. 2168-2179.
19. Fowler K.J., Sheybani A., Parker R.A., et. al.: Combined hepatocellular and cholangiocarcinoma (biphenotypic) tumors: imaging features and diagnostic accuracy of contrast-enhanced CT and MRI. AJR Am J Roentgenol 2013; 201: pp. 332-339.
20. McGee S.: Simplifying likelihood ratios. J Gen Intern Med 2002; 17: pp. 646-649.
21. Viera A.J., Garrett J.M.: Understanding interobserver agreement: the kappa statistic. Fam Med 2005; 37: pp. 360-363.
22. Kang Y., Lee J.M., Kim S.H., et. al.: Intrahepatic mass-forming cholangiocarcinoma: enhancement patterns on gadoxetic acid-enhanced MR images. Radiology 2012; 264: pp. 751-760.
23. Chong Y.S., Kim Y.K., Lee M.W., et. al.: Differentiating mass-forming intrahepatic cholangiocarcinoma from atypical hepatocellular carcinoma using gadoxetic acid-enhanced MRI. Clin Radiol 2012; 67: pp. 766-773.
24. Tada T., Kumada T., Toyoda H., et. al.: Diagnostic accuracy for macroscopic classification of nodular hepatocellular carcinoma: comparison of gadolinium ethoxybenzyl diethylenetriamine pentaacetic acid-enhanced magnetic resonance imaging and angiography-assisted computed tomography. J Gastroenterol 2015; 50: pp. 85-94.
25. Sheng R.F., Zeng M.S., Rao S.X., et. al.: MRI of small intrahepatic mass-forming cholangiocarcinoma and atypical small hepatocellular carcinoma (</=3 cm) with cirrhosis and chronic viral hepatitis: a comparative study. Clin Imaging 2014; 38: pp. 265-272.
26. Xu J., Igarashi S., Sasaki M., et. al.: Intrahepatic cholangiocarcinomas in cirrhosis are hypervascular in comparison with those in normal livers. Liver Int 2012; 32: pp. 1156-1164.
27. Attwa M.H., El-Etreby S.A.: Guide for diagnosis and treatment of hepatocellular carcinoma. World J Hepatol 2015; 7: pp. 1632-1651.
28. Kim S.H., Lee C.H., Kim B.H., et. al.: Typical and atypical imaging findings of intrahepatic cholangiocarcinoma using gadolinium ethoxybenzyl diethylenetriamine pentaacetic acid-enhanced magnetic resonance imaging. J Comput Assist Tomogr 2012; 36: pp. 704-709.
29. Peporte A.R., Sommer W.H., Nikolaou K., et. al.: Imaging features of intrahepatic cholangiocarcinoma in Gd-EOB-DTPA-enhanced MRI. Eur J Radiol 2013; 82: pp. e101-e106.
30. Rimola J., Forner A., Reig M., et. al.: Cholangiocarcinoma in cirrhosis: absence of contrast washout in delayed phases by magnetic resonance imaging avoids misdiagnosis of hepatocellular carcinoma. Hepatology 2009; 50: pp. 791-798.
31. Jeong H.T., Kim M.J., Chung Y.E., et. al.: Gadoxetate disodium-enhanced MRI of mass-forming intrahepatic cholangiocarcinomas: imaging-histologic correlation. AJR Am J Roentgenol 2013; 201: pp. W603-W611.
32. Kim R., Lee J.M., Shin C.I., et. al.: Differentiation of intrahepatic mass-forming cholangiocarcinoma from hepatocellular carcinoma on gadoxetic acid-enhanced liver MR imaging. Eur Radiol 2016; 26: pp. 1808-1817.
33. Park H.J., Jang K.M., Kang T.W., et. al.: Identification of imaging predictors discriminating different primary liver tumours in patients with chronic liver disease on gadoxetic acid-enhanced MRI: a classification tree analysis. Eur Radiol 2016; 26: pp. 3102-3111.
34. Park H.J., Kim Y.K., Park M.J., et. al.: Small intrahepatic mass-forming cholangiocarcinoma: target sign on diffusion-weighted imaging for differentiation from hepatocellular carcinoma. Abdom Imaging 2013; 38: pp. 793-801.