
Rationale and Objectives
To investigate the value of dual-energy spectral computed tomography (DESCT) in the quantitative differentiation between pulmonary malignant masses and inflammatory masses.
Materials and Methods
This study was an institutional review board–approved study, and written informed consent was obtained from all patients. Sixty patients with 35 lung cancers and 25 inflammatory masses underwent DESCT scan during arterial phase (AP) and venous phase (VP). CT numbers of net enhancement in 70 keV monochromatic images in central and peripheral regions of masses and their differences (dCT) were measured. Iodine concentrations in the two regions were measured and normalized to the aorta as normalized iodine concentrations (NICs). The slopes of spectral attenuation curves (λHU) in the two regions were also calculated. The two-sample t test was used to compare quantitative parameters. Receiver operating characteristic (ROC) curves were generated to calculate sensitivity and specificity.
Results
CT numbers of net enhancement and NICs in central regions, and λHU values both in the central and peripheral region of lung cancers were significantly lower than those of inflammatory masses during AP and VP. On the other hand, the dCT values of lung cancers were higher than that of inflammatory masses. NIC value in the central regions in VP had the highest sensitivity (86%) and specificity (100%) in differentiating malignant masses from inflammatory masses.
Conclusions
DESCT imaging with quantitative parameters such as CT numbers of 70 keV monochromatic images, NIC, and λHU may be a new method for differentiating lung cancers from inflammatory masses.
Primary lung cancer is one of the most common cancers worldwide, comprising 17% of the total new cancer cases and 23% of the total cancer deaths. Early surgery and chemotherapy have been shown to be highly effective treatment techniques in most patients with lung cancer . However, some inflammatory masses with benign nature such as granulomatous inflammation, focal organizing pneumonia, and lung abscess are also very common in lung. The treatment options for inflammatory masses vary and consist of high-dose steroids, irradiation, and antibiotics, and the unnecessary pulmonary resection should be avoided. The differentiation between lung cancer and inflammatory masses is thus essential because of the different therapeutic approaches. The availability of multidetector-row computed tomography (MDCT) plays an important role in characterizing pulmonary masses noninvasively according to the morphology, interfaces, inner densities, and enhancement of masses . However, the nonspecific CT image appearance and the high degree of enhancement of inflammatory masses are similar to lung cancers, making it difficult to differentiate between the two common lesions in lungs by conventional scanning methods.
Recently a new dual-energy spectral computed tomography (DESCT) imaging mode based on the rapid switching between high- and low-energy data sets from view to view during a single rotation on the high-definition GE Discovery CT750 HD scanner was introduced, which could produce both the monochromatic spectral images at energy levels ranging from 40 to 140 keV and the material decomposition images for quantitative iodine concentration measurement . This spectral CT imaging mode was also named Gemstone Spectral Imaging (GSI) mode by the manufacturer. The DESCT has found its multiple clinical uses in diagnosing pulmonary embolism , staging gastric cancer , and differentiating small hepatocellular carcinoma from small hepatic hemangioma . The purpose of our study was to investigate the clinical utility of DESCT in quantitatively differentiating pulmonary malignant masses from inflammatory masses.
Materials and methods
Patients
Get Radiology Tree app to read full this article<
Reference Standards
Get Radiology Tree app to read full this article<
CT Examinations
Get Radiology Tree app to read full this article<
Quantitative Analysis
Get Radiology Tree app to read full this article<
Statistical Analysis
Get Radiology Tree app to read full this article<
Get Radiology Tree app to read full this article<
Results
Get Radiology Tree app to read full this article<
Table 1
Quantitative Assessment of the CT Number of Net Enhancement in 70-keV Monochromatic Image, NIC, and λ HU in the Central Region of Lung Cancers and Inflammatory Masses in AP and VP
Group CT Number (HU) NIC λ HU AP Lung cancers 14.80 ± 8.08 0.04 ± 0.02 1.1 ± 0.65 Inflammatory masses 35.89 ± 18.60 0.14 ± 0.08 2.59 ± 1.01t 4.83 4.63 5.34P value .001 <.001 <.001 VP Lung cancers 32.45 ± 18.19 0.12 ± 0.10 1.69 ± 0.57 Inflammatory masses 56.27 ± 20.76 0.40 ± 0.19 3.40 ± 1.10t 6.79 4.40 5.25P value <.001 .001 <.001
AP, arterial phase; CT, computed tomography; HU, Hounsfield unit; λHU, slope of spectral CT curve; NIC, normalized iodine concentration; VP, venous phase.
Values are mean ± standard deviation (95% confidence interval).
Table 2
Quantitative Assessment of the CT Number of Net Enhancement in 70-keV Monochromatic Image, NIC, and λ HU in the Peripheral Region of Lung Cancers and Inflammatory Masses in AP and VP
Group CT Number (HU) NIC λ HU AP Lung cancers 45.18 ± 20.83 0.11 ± 0.06 1.32 ± 0.40 Inflammatory masses 60.19 ± 26.23 0.16 ± 0.09 2.57 ± 0.10t 0.49 1.80 −5.4P value .63 .09 <.001 VP Lung cancers 76.95 ± 26.64 0.45 ± 0.40 1.24 ± 0.60 Inflammatory masses 85.54 ± 24.67 0.42 ± 0.10 3.04 ± 1.21t 0.81 0.28 −6.16P value .43 .78 <.001
AP, arterial phase; CT, computed tomography; HU, Hounsfield unit; λHU, slope of spectral CT curve; NIC, normalized iodine concentration; VP, venous phase.
Values are mean ± standard deviation (95% confidence interval).
Get Radiology Tree app to read full this article<
Get Radiology Tree app to read full this article<
Table 3
Quantitative Assessment of the dCT Values in the 70-keV Monochromatic Images for Lung Cancers and Inflammatory Masses in AP and VP
AP VP Lung cancers 34.11 ± 10.83 HU 33.91 ± 12.05 HU Inflammatory masses 17.96 ± 5.62 HU 15.13 ± 7.40HU_t_ −3.90 −3.64P value <.001 <.001
AP, arterial phase; dCT, the computed tomography value difference between the central and peripheral regions in lung masses in 70-keV images; HU, Hounsfield unit; VP, venous phase.
Values are mean ± standard deviation (95% confidence interval).
Get Radiology Tree app to read full this article<
Get Radiology Tree app to read full this article<
![Figure 3, The λ HU of organizing pneumonia in an 80-year-old man (a) and the λ HU of adenocarcinoma in a 62-year-old man (b) . λ HU is calculated from the spectral computed tomography curve of the lesion (Hounsfield units [HU] in the y-axis, and photon energies in the x-axis), as λ HU = (HU measured at 40 keV − HU measured at 100 keV)/60.](https://storage.googleapis.com/dl.dentistrykey.com/clinical/DifferentiationofLungCancersFromInflammatoryMasseswithDualEnergySpectralCTImaging/2_1s20S1076633214003870.jpg)
Get Radiology Tree app to read full this article<
Get Radiology Tree app to read full this article<
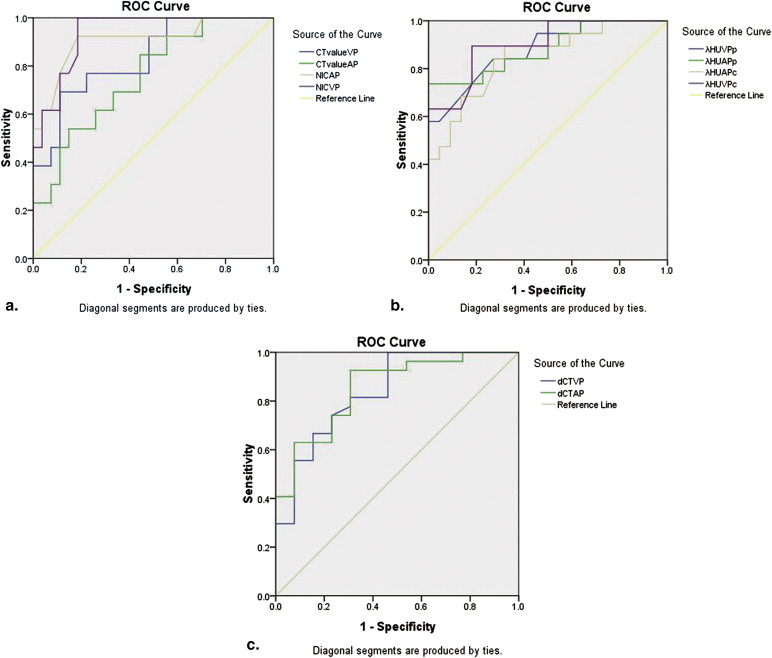
Table 4
Quantitative Assessment of the AUC, Thresholds, Sensitivities, and Specificities of the CT Values of Net Enhancement in the 70-keV Monochromatic Images, dCT Values, NIC, and λHU for Distinguishing Lung Cancers From Inflammatory Masses During AP and VP
AUC Thresholds Sensitivities (%) ∗ Specificities (%) † CT value (AP) 0.82 30.60 68 (24) 95 (24) CT value (VP) 0.83 51.95 73 (25) 95 (24) NIC (AP) 0.94 0.15 77 (27) 100 (25) NIC (VP) 0.96 0.34 86 (30) 100 (25) dCT (AP) 0.82 26.05 74 (26) 92 (23) dCT (VP) 0.84 34.16 67 (23) 92 (23) λ HU (central AP) 0.89 1.09 100 (35) 59 (15) λ HU (central VP) 0.94 2.29 85 (30) 85 (21) λ HU (peripheral AP) 0.88 1.91 73 (25) 95 (24) λ HU (peripheral VP) 0.90 2.12 82 (29) 90 (22)
AP, arterial phase; AUC, area under the ROC; CT, computed tomography; dCT, the computed tomography value difference between the central and peripheral regions in lung masses in 70-keV images; HU, Hounsfield unit; λ HU , slope of spectral CT curve; λ HU (peripheral AP), the slope of spectral CT curve in the peripheral regions of lesion during AP; λ HU (peripheral VP), the slope of spectral CT curve in the peripheral regions of lesion during VP; λ HU (central AP), the slope of spectral CT curve in the central regions of lesion during AP; λ HU (central VP), the slope of spectral CT curve in the central regions of lesion during VP; λ HU (peripheral VP), the slope of spectral CT curve in the peripheral regions of lesion during VP; NIC, normalized iodine concentration; VP, venous phase.
Get Radiology Tree app to read full this article<
Get Radiology Tree app to read full this article<
Get Radiology Tree app to read full this article<
Discussion
Get Radiology Tree app to read full this article<
Get Radiology Tree app to read full this article<
Get Radiology Tree app to read full this article<
Get Radiology Tree app to read full this article<
Get Radiology Tree app to read full this article<
Get Radiology Tree app to read full this article<
Acknowledgments
Get Radiology Tree app to read full this article<
Get Radiology Tree app to read full this article<
References
1. Jemal A., Bray F., Center M.M., et. al.: Global cancer statistics. CA Cancer J Clin 2011; 61: pp. 69-90.
2. MacMahon H., Austin J.H., Gamsu G., et. al.: Guidelines for management of small pulmonary nodules detected on CT scans: a statement from the Fleischner society. Radiology 2005; 237: pp. 395-400.
3. Zhang D., Li X., Liu B.: Objective characterization of GE discovery CT750 HD scanner: gemstone spectral imaging mode. Med Phys 2011; 38: pp. 1178-1188.
4. Wu H.W., Cheng J.J., Li J.Y.: Pulmonary embolism detection and characterization through quantitative iodine-based material decomposition images with spectral computed tomography imaging. Invest Radiol 2012; 47: pp. 85-91.
5. Fuchs T.A., Stehli J., Fiechter M., et. al.: First experience with monochromatic coronary computed tomography angiography from a 64-slice CT scanner with Gemstone Spectral Imaging (GSI). J Cardiovasc Comput Tomogr 2013; 7: pp. 25-31.
6. Geyer L.L., Scherr M., Körner M., et. al.: Imaging of acute pulmonary embolism using a dual energy CT system with rapid kVp switching: initial results. Eur J Radiol 2012; 81: pp. 3711-3718.
7. Pan Z., Pang L., Ding B., et. al.: Gastric cancer staging with dual energy spectral CT imaging. PLoS One 2013; 8: pp. e53651.
8. Lv P., Lin X.Z., Li J., et. al.: Differentiation of small hepatic hemangioma from small hepatocellular carcinoma: recently introduced spectral CT method. Radiology 2011; 259: pp. 720-729.
9. Kim T.S., Han J., Kim G.Y., et. al.: Pulmonary inflammatory pseudotumor (inflammatory myofibroblastic tumor): CT features with pathologic correlation. J Comput Assist Tomogr 2005; 29: pp. 633-639.
10. Swensen S.J., Viggiano R.W., Midthun D.E., et. al.: Lung nodule enhancement at CT: multicenter study. Radiology 2000; 214: pp. 73-80.
11. Maldonado F., Daniels C.E., Hoffman E.A.: Focal organizing pneumonia on surgical lung biopsy: causes, clinicoradiologic features, and outcomes. Chest 2007; 132: pp. 1579-1583.
12. Zhang M., Kono M.: Solitary pulmonary nodule: evaluation of blood flow patterns with dynamic CT. Radiology 1997; 205: pp. 471-478.
13. Matsumoto K., Jinzaki M., Tanami Y., et. al.: Virtual monochromatic spectral imaging with fast kilovoltage switching: improved image quality as compared with that obtained with conventional 120-kVp CT. Radiology 2011; 259: pp. 257-262.
14. Diederich S., Theegarten D., Stamatis G., et. al.: Solitary pulmonary nodule with growth and contrast enhancement at CT: inflammatory pseudotumour as an unusual benign cause. Br J Radiol 2006; 79: pp. 76-78.
15. Xie M.: Value of radiodensity determined by enhanced computed tomography for the differential diagnosis of lung masses. Iran J Radiol 2011; 8: pp. 145-149.
16. Prasad M.V., Thankachen R., Parihar B., et. al.: Inflammatory pseudotumour of the lung. Interact Cardiovasc Thorac Surg 2004; 3: pp. 323-325.
17. Yang P.S., Lee K.S., Han J., et. al.: Focal organizing pneumonia: CT and pathologic findings. J Korean Med Sci 2001; 16: pp. 573-578.
18. Greenberg-Wolff I., Konen E., Ben Dov I., et. al.: Cryptogenic organizing pneumonia: variety of radiologic findings. Isr Med Assoc 2005; 7: pp. 568-570.
19. Yi C.A., Lee K.S., Kim E.A., et. al.: Solitary pulmonary nodules: dynamic enhanced multidetector row CT study and comparison with vascular endothelial growth factor and microvessel density. Radiology 2004; 233: pp. 191-199.
20. Zhao F., Yan S.X., Wang G.F., et. al.: CT features of focal organizing pneumonia: an analysis of consecutive histopathologically confirmed 45 cases. Eur J Radiol 2014; 83: pp. 73-78. S0720_048X(13)00213_1. doi:10.1016
21. Yazdani S., Miki Y., Tamaki K., et. al.: Proliferation and maturation of intratumoral blood vessels in non–small cell lung cancer. Hum Pathol 2013; 44: pp. 1586-1596.
22. Brunese L., Greco B., Setola F.R., et. al.: Non–small cell lung cancer evaluated with quantitative contrast-enhanced CT and PET-CT: net enhancement and standardized uptake values are related to tumour size and histology. Med Sci Monit 2013; 19: pp. 95-101.
23. Miles K.A., Griffiths M.R., Keith C.J., et. al.: Blood flow-metabolic relationships are dependent on tumour size in non–small cell lung cancer: a study using quantitative contrast-enhanced computer tomography and positron emission tomography. Eur J Nucl Med Mol Imaging 2006; 33: pp. 22-28.
24. Fletcher J.G., Takahashi N., Hartman R., et. al.: Dual-energy and dual-source CT: is there a role in the abdomen and pelvis?. Radiol Clin North Am 2009; 47: pp. 41-57.
25. Boll D.T., Neil A.P., Erik K.P., et. al.: Focal cystic high-attenuation lesion: characterization in renal phantom by using photon-counting spectral CT: improved differentiation of lesion composition. Radiology 2010; 254: pp. 270-276.
26. Li M., Zheng X., Li J., et. al.: Dual-energy computed tomography imaging of thyroid nodule specimens. Invest Radiol 2012; 47: pp. 58-64.
27. Patel B.N., Thomas J.V., Lockhart M.E., et. al.: Single-source dual-energy spectral multidetector CT of pancreatic adenocarcinoma: optimization of energy level viewing significantly increases lesion contrast. Clin Radiol 2013; 68: pp. 148-154.