
Rationale and Objectives
To assess the activity and clinical course of Graves’ disease with diffusion-weighted magnetic resonance (MR) imaging.
Materials and Methods
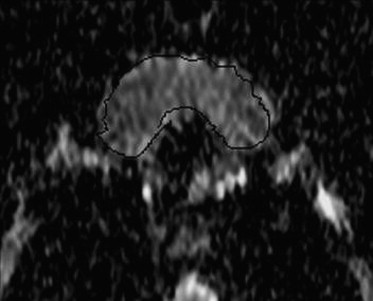
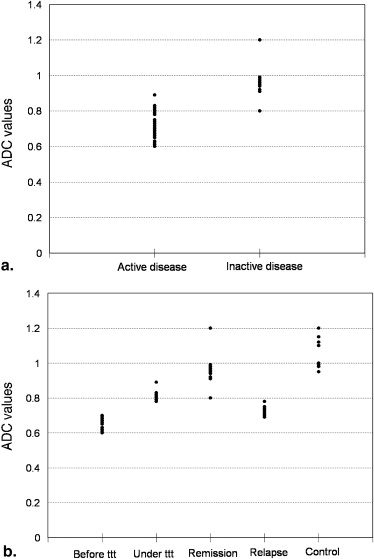
Fifty-one patients with Graves’ disease and 25 volunteers underwent diffusion MR imaging of the thyroid gland using a single shot echo-planar imaging with b-factor of 0, 300 and 600 second/mm 2 . The apparent diffusion coefficient (ADC) values of the thyroid gland were calculated. Patients with active Graves’ disease included untreated patients at initial diagnosis ( n = 12), patients under antithyroid drugs ( n = 11), and patients in relapse after withdrawal of therapy ( n = 13). Patients with inactive disease had a remission of hyperthyroidism ( n = 15).
Results
The mean ADC values of thyroid gland with active Graves’ disease was 0.65 ± 0.03 × 10 −3 mm 2 /second in patients at initial diagnosis, 0.81 ± 0.02 × 10 −3 mm 2 /second in patients undergoing antithyroid drug and 0.72 ± 0.07 × 10 −3 mm 2 /second in patients with relapse of hyperthyroidism. The mean ADC of patients with remission was 0.94 ± 0.03 × 10 −3 mm 2 /second and for normal volunteer was 1.06 ± 0.08 × 10 −3 mm 2 /second. There was significant difference in the ADC value of patients with active disease and remission ( P = .001). The cutoff ADC value used for differentiating patients with active disease from patients with remission was 0.82 × 10 −3 mm 2 /second. The mean ADC value of thyroid gland had positive correlation with thyroid-stimulating hormone ( r = 0.87, P = .001) and negative correlation with serum T4 ( r = −0.82, P = .001) and serum T3 ( r = −0.71, P = .001).
Conclusions
The ADC value of the thyroid gland is a promising non invasive parameter for diagnosis of different clinical stages of Graves’ disease. Hence it can be used to assess the activity and predict the outcome of patients during and after medical treatment.
Graves’ disease is a chronic autoimmune disorder characterized by a variable clinical course. In patients with Graves’ disease, hyperthyroidism can present a stable state after medical treatment or shows a relapsing or remitting course. This represents a diagnostic challenge to the clinician and radiologist. Accurate determination the clinical course of Graves’ disease, whether remission or relapse is mandatory for the effectiveness of medical treatment or surgical decision making after failure of medical treatment .
The need for an accurate noninvasive easily repeatable diagnostic modality is warranted. Ultrasound with color and power Doppler examination is commonly used for evaluation the activity of Graves’ disease, but there are operator dependence and overlap in the parameters of spectral analysis . Radionuclide scintigraphy is the gold standard for diagnosis of Graves’ disease, but it is associated with radiation exposure . Standard clinical magnetic resonance (MR) imaging has a limited role in thyroid disease because there is no correlation between the signal intensity and the activity of Graves’ disease .
Get Radiology Tree app to read full this article<
Get Radiology Tree app to read full this article<
Materials and Methods
Get Radiology Tree app to read full this article<
Get Radiology Tree app to read full this article<
Get Radiology Tree app to read full this article<
Get Radiology Tree app to read full this article<
Get Radiology Tree app to read full this article<
Get Radiology Tree app to read full this article<
Get Radiology Tree app to read full this article<
Get Radiology Tree app to read full this article<
Results
Get Radiology Tree app to read full this article<
Table 1
The Mean, Minimum, and Maximum Apparent Diffusion Coefficient Values (10 −3 mm 2 /second) of the Thyroid Gland in the Different Stages of Graves’ Disease and in Volunteers
Patient Group No. Mean ± SD Minimum Maximum Patient at initial diagnosis 12 0.65 ± 0.03 0.60 0.70 Patient under treatment 11 0.81 ± 0.02 0.78 0.89 Patient with relapse 13 0.72 ± 0.02 0.69 0.78 Patient with remission 15 0.94 ± 0.03 0.80 1.20 Volunteers 25 1.06 ± 0.08 0.95 1.20
Get Radiology Tree app to read full this article<
Get Radiology Tree app to read full this article<
Get Radiology Tree app to read full this article<
Table 2
The ADC Values and Thyroid Function Tests in Different Stages of Patients with Graves’ Disease and in Volunteers
Patient Group No. ADC Value TSH T3 T4 Patient at initial diagnosis 12 0.65 ± 0.03 2.5 ± 0.4 314.4 ± 64 21.4 ± 2.5 Patient under treatment 11 0.81 ± 0.02 1.4 ± 0.5 202.6 ± 32 11.2 ± 2.9 Patient with relapse 13 0.72 ± 0.02 3.3 ± 0.9 136.4 ± 29 6.97 ± 1.8 Patient with remission 15 0.94 ± 0.03 2.9 ± 0.3 277.7 ± 74 17.8 ± 2.5 Volunteers 25 1.06 ± 0.08 3.1 ± 1.0 132.4 ± 23 6.93 ± 1.7
ADC, apparent diffusion coefficient; TSH, thyroid-stimulating hormone.
Get Radiology Tree app to read full this article<
Discussion
Get Radiology Tree app to read full this article<
Get Radiology Tree app to read full this article<
Get Radiology Tree app to read full this article<
Get Radiology Tree app to read full this article<
Get Radiology Tree app to read full this article<
Get Radiology Tree app to read full this article<
Get Radiology Tree app to read full this article<
Get Radiology Tree app to read full this article<
Get Radiology Tree app to read full this article<
Get Radiology Tree app to read full this article<
Conclusion
Get Radiology Tree app to read full this article<
References
1. Weetman A.P.: Graves’ disease. N Engl J Med 2004; 343: pp. 1236-1248.
2. McIver B., Morris J.C.: The pathogenesis of Graves’ disease. Endocrinol Metab Clin North Am 1998; 27: pp. 73-89.
3. Franklyn J.A.: The management of hyperthyroidism. N Engl J Med 2002; 330: pp. 1731-1738.
4. Solomon B., Glinoer D., Lagasse R.: Current trends in the management of Graves’ disease. J Clin Endocrinol Metab 2005; 70: pp. 1518-1524.
5. Vitti P.: Grey scale thyroid ultrasonography in the evaluation of patients with Graves’ disease. Eur J Endocrinol 2000; 142: pp. 22-24.
6. Baldini M., Orsatti A., Bonfanti M., et. al.: Relationship between the sonographic appearance of the thyroid and the clinical course and autoimmune activity of Graves’ disease. J Clin Ultrasound 2005; 33: pp. 381-385.
7. Castagnone D., Rivolta R., Rescalli S., et. al.: Color Doppler sonography in Graves’ disease: value in assessing activity of disease and predicting outcome. AJR Am J Roentgenol 1996; 166: pp. 203-207.
8. Nagasaki T., Inaba M., Kumeda Y., et. al.: Significance of thyroid blood flow as a predictor of methimazole sensitivity in untreated hyperthyroid patients with Graves’ disease. Biomed Pharmacother 2007; 61: pp. 472-476.
9. Baldini M., Castagnone D., Rivolta R., et. al.: Thyroid vascularization by color Doppler ultrasonography in Graves’ disease. Changes related to different phases and to the long-term outcome of the disease. Thyroid 1997; 7: pp. 823-828.
10. Sponza M., Fabris B., Bertolotto M., et. al.: Role of Doppler color ultrasonography and flowmetric analysis in the diagnosis and follow-up of Graves’ disease. Radiol Med 1997; 93: pp. 405-409.
11. Saleh A., Cohnen M., Furst G., et. al.: Prediction of relapse after antithyroid drug therapy of Graves’ disease: value of color Doppler sonography. Exp Clin Endocrinol Diabetes 2004; 112: pp. 510-513.
12. Arslan H., Unal O., Algun E., et. al.: Power Doppler sonography in the diagnosis of Graves’ disease. Eur J Ultrasound 2000; 11: pp. 117-122.
13. Meller J., Becker W.: The continuing importance of thyroid scintigraphy in the era of high-resolution ultrasound. Eur J Nucl Med 2002; 29: pp. S425-S438.
14. Kabala J.E.: Computed tomography and magnetic resonance imaging in diseases of the thyroid and parathyroid. Eur J Radiol 2008; 66: pp. 480-492.
15. Charkes N.D., Maurer A.H., Siegel J.A., et. al.: MR imaging in thyroid disorders: correlation of signal intensity with Graves disease activity. Radiology 1987; 164: pp. 491-494.
16. Takashima S., Fukuda H., Tomiyama N., et. al.: Hashimoto thyroiditis: correlation of MR imaging signal intensity with histopathologic findings and thyroid function test results. Radiology 1995; 197: pp. 213-219.
17. Mountz J.M., Glazer G.M., Dmuchowski C., et. al.: MR imaging of the thyroid: comparison with scintigraphy in the normal and diseased gland. J Comput Assist Tomogr 1987; 11: pp. 612-619.
18. Tezuka M., Murata Y., Ishida R., et. al.: MR imaging of the thyroid: correlation between apparent diffusion coefficient and thyroid gland scintigraphy. J Magn Reson Imag 2003; 17: pp. 163-169.
19. Abdel Razek A.K., Sadek A., Ombar O., et. al.: Role of apparent diffusion coefficient value in differentiation between malignant and benign solitary thyroid nodule. AJNR Am J Neuroradiol 2008; 29: pp. 563-568.
20. Schueller-Weidekamm C., Kaserer K., Schueller G., et. al.: Can quantitative diffusion-weighted MR imaging differentiate benign and malignant cold thyroid nodules? Initial results in 25 patients. AJNR Am J Neuroradiol 2009; 30: pp. 417-422.
21. Bozgeyik Z., Coskun S., Dagli A.F., et. al.: Diffusion-weighted MR imaging of thyroid nodules. Neuroradiology 2009; 51: pp. 193-198.
22. Patel R., Carlos R., Midia M., et. al.: Apparent diffusion coefficient mapping of the Normal parotid gland and parotid Involvement in patients with systemic connective tissue disorders. AJNR Am J Neuroradiol 2004; 25: pp. 16-20.
23. Regier M., Ries T., Arndt C., et. al.: Sjögren’s syndrome of the parotid gland: value of diffusion-weighted echo-planar MRI for diagnosis at an early stage based on MR sialography grading in comparison with healthy volunteers. Rofo 2009; 181: pp. 242-248.
24. Kawai Y., Sumi M., Kitamori H., et. al.: Diffusion-weighted MR microimaging of the lacrimal glands in patients with Sjögren’s syndrome. AJR Am J Roentgenol 2005; 184: pp. 1320-1325.
25. Thoeny H., De Keyzer F., Oyen R., et. al.: Diffusion-weighted MR imaging of kidneys in healthy volunteers and patients with parenchymal diseases: initial experience. Radiology 2005; 235: pp. 911-917.
26. Morosini P., Simonella G., Mancini V., et. al.: Color Doppler sonography patterns related to histological findings in Graves’ disease. Thyroid 1998; 8: pp. 577-582.
27. Fountoulakis S., Vartholomatos G., Kolaitis N., et. al.: Differential expression of Fast system apoptotic molecules in peripheral lymphocytes from patients with Graves’ disease and Hashimoto’s thyroiditis. Eur J Endocrinol 2008; 158: pp. 853-859.
28. Garrity J.A., Bahn R.S.: Perspective pathogenesis of graves ophthalmopathy: implications for prediction, prevention, and treatment. Am J Ophthalmol 2006; 142: pp. 147-153.
29. Jameson J.L., Weetman A.P., Daag A.S.: Disorders of the thyroid gland.Fauci A.S.Braunwald E.B.Kasper D.L. et. al.Harrison’s principles of internal medicine.2008.McGraw-HillNew York:pp. 2224-2247.