
Rationale and Objectives
When evaluating ischemic stroke on diffusion-weighted magnetic resonance imaging (DWI), the display method has not been investigated. The purpose of this study was to determine whether standardization of the display method for DWI affects observers’ diagnostic performance in detecting ischemic stroke on DWI.
Materials and Methods
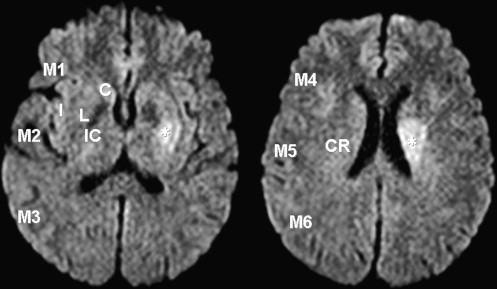
Twenty-six observers evaluated 40 DWI studies in 20 patients with acute (<6 hours) middle cerebral arterial strokes and 20 controls for the presence of hyperintense lesions in 10 areas using the Alberta Stroke Programme Early CT Score (ASPECTS) system and one area in the corona radiata using a modified version of the ASPECTS system (ASPECTS-DWI). The images were reviewed using a standardized display method (SDM) and a conventional display method (CDM). The reading time was recorded for each session. The observers’ performance was evaluated with receiver-operating characteristic analysis.
Results
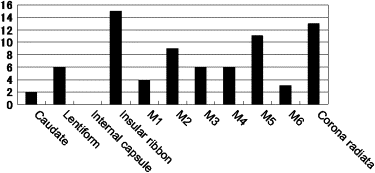
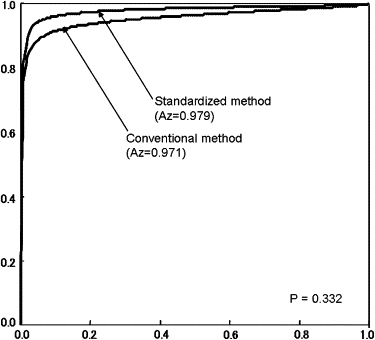
In all observers with ASPECTS-DWI scores of ≤8 points, the value of the mean average area under the receiver-operating characteristic curve was slightly higher for the SDM than the CDM, but the difference was not statistically significant. In the insular ribbon, diagnostic accuracy was significantly higher with the SDM than the CDM ( P = .036). In the other locations, there were no significant differences. With the SDM, the mean reading time was reduced by 7.5 seconds ( P = .024).
Conclusion
The SDM improved diagnostic accuracy for the insular ribbon and shortened the reading time, although it did not improve observers’ performance with the ASPECTS-DWI system.
With respect to the detection and localization of ischemic stroke, diffusion-weighted magnetic resonance imaging (DWI) yields good interrater homogeneity and better sensitivity and accuracy than computed tomography, even among raters with limited experience . In patients with ischemic strokes, tissue plasminogen activator improves outcomes and yields benefits, as long as administration is begun within 9 hours of the insult . Perfusion-DWI mismatch and clinical-DWI mismatch have been used as diagnostic criteria for thrombolytic therapy . In the evaluation of the extent of ischemic areas, the Alberta Stroke Programme Early CT Score (ASPECTS) system has been applied to DWI . The interpretation of the extent of acute ischemic lesions on DWI is crucial for estimating tissues at risk and for determining treatment.
Because DWI display conditions such as the window width and level vary among subjects, operators, and magnetic resonance scanners , there is a risk for missing acute ischemic lesions and misinterpreting normal brain regions as infarcted. To our knowledge, the possible effect of the display method on the diagnostic performance of raters evaluating DWI in patients with ischemic strokes has not been studied in detail.
Get Radiology Tree app to read full this article<
Materials and methods
Selection of Patients and Controls
Get Radiology Tree app to read full this article<
Get Radiology Tree app to read full this article<
MRI
Get Radiology Tree app to read full this article<
Scoring System of DWI Abnormalities for the Observer Performance Study
Get Radiology Tree app to read full this article<
Get Radiology Tree app to read full this article<
Get Radiology Tree app to read full this article<
Get Radiology Tree app to read full this article<
Display Methods
Get Radiology Tree app to read full this article<
window width=SIb0, window width
=
SI
b
0
,
and
window level=(SIb0)/2, window level
=
(
SI
b
0
)
/
2
,
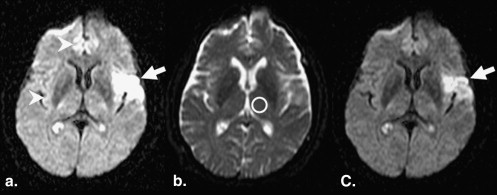
where SI b0 is the SI in the normal-appearing thalamus on b0 images . For the SDM, one neuroradiologist (T. Hirai) manually measured the SI of the normal-appearing thalamus on b0 images with a circular region of interest (ROI); on each scan, one 60-mm 2 ROI was placed within the thalamus ( Fig 3 ). The measured window width and level were applied to all DWI studies for the SDM.
Get Radiology Tree app to read full this article<
Observer Performance Study
Get Radiology Tree app to read full this article<
Get Radiology Tree app to read full this article<
Get Radiology Tree app to read full this article<
Get Radiology Tree app to read full this article<
Statistical Analyses
Get Radiology Tree app to read full this article<
Get Radiology Tree app to read full this article<
Get Radiology Tree app to read full this article<
Get Radiology Tree app to read full this article<
Results
Diagnostic Performance
Get Radiology Tree app to read full this article<
Table 1
Comparison of Mean A z Values Obtained with the CDM and the SDM
Method Neuroradiologists General Radiologists Neurologists Neurosurgeons All Observers CDM 0.996 ± 0.005 ∗ 0.961 ± 0.047 0.975 ± 0.020 ∗ 0.947 ± 0.045 0.971 ± 0.037 SDM 0.990 ± 0.012 † 0.979 ± 0.036 0.966 ± 0.027 † 0.974 ± 0.018 0.979 ± 0.026P value .226 .196 .560 .385 .332
A z , area under the receiver-operating characteristic curve; CDM, conventional display method; SDM, standardized display method.
Data are expressed as mean ± standard deviation.
Get Radiology Tree app to read full this article<
Get Radiology Tree app to read full this article<
Get Radiology Tree app to read full this article<
Get Radiology Tree app to read full this article<
Table 2
Diagnostic Accuracy According to the Location of the Brain for All Observers
Caudate Lentiform Internal Capsule Insular Ribbon M1 M2 Right Left Right Left Right Left Right Left Right Left Right Left Variable CDM SDM CDM SDM CDM SDM CDM SDM CDM SDM CDM SDM CDM SDM CDM SDM CDM SDM CDM SDM CDM SDM CDM SDM No. of FP cases per session 0.62 0.65 0.65 0.23 0.31 0.58 0.23 0.31 1.38 1.22 0.92 0.85 1.58 0.92 1.04 0.73 1.08 0.96 1.00 0.92 1.12 1.04 0.85 0.73 No. of FN cases per session 0.31 0.46 0.12 0 1.65 1.38 1.38 1.19 NA NA NA NA 0.77 0.42 1.35 1.27 0.19 0.12 0.27 0.19 2.35 1.81 1.00 0.96 Accuracy (%) 97.7 97.2 98.1 99.4 95.1 95.1 96.0 96.3 NA NA NA NA 94.1 ∗ 96.6 ∗ 94.0 95.0 96.8 97.3 96.8 97.2 91.3 92.9 95.4 95.8 M3 M4 M5 M6 Corona Radiata Right Left Right Left Right Left Right Left Right Left CDM SDM CDM SDM CDM SDM CDM SDM CDM SDM CDM SDM CDM SDM CDM SDM CDM SDM CDM SDM No. of FP cases per session 0.42 0.92 0.50 0.65 0.77 0.42 0.46 0.49 0.69 0.65 0.46 0.15 1.19 1.35 0.92 0.50 1.42 1.08 1.57 1.35 No. of FN cases per session 1.77 1.50 0.04 0.08 1.38 1.38 0 0 2.23 1.85 0.69 0.50 0.58 0.35 0.62 0.73 2.46 2.27 1.69 1.65 Accuracy (%) 94.5 93.9 98.7 98.2 94.6 95.5 98.8 98.3 92.7 93.8 97.1 98.4 95.6 95.8 96.2 96.9 90.3 91.6 91.3 92.5
CDM, conventional display method; FN, false negative; FP, false positive; M1, anterior portion of the middle cerebral artery (MCA) cortex; M2, MCA cortex lateral to insular ribbon; M3, posterior MCA cortex; M4, M5, and M6, anterior, lateral, and posterior MCA territories immediately superior to M1, M2, and M3, rostral to the basal ganglia; NA, not available; SDM, standardized display method.
Get Radiology Tree app to read full this article<
Get Radiology Tree app to read full this article<
Reading Times
Get Radiology Tree app to read full this article<
Table 3
Comparison of Mean Reading Times per Case with the CDM and the SDM
Method Neuroradiologists General Radiologists Neurologists Neurosurgeons All Observers CDM (seconds) 82.1 ± 12 60.8 ± 14 66.6 ± 11 68.7 ± 12 68.5 ± 13 ∗ SDM (seconds) 71.8 ± 8 54.5 ± 9 60.3 ± 7 54.6 ± 7 61.0 ± 10 ∗
CDM, conventional display method; SDM, standardized display method.
Data are expressed as mean ± standard deviation.
Get Radiology Tree app to read full this article<
Get Radiology Tree app to read full this article<
Discussion
Get Radiology Tree app to read full this article<
Get Radiology Tree app to read full this article<
Get Radiology Tree app to read full this article<
Get Radiology Tree app to read full this article<
Get Radiology Tree app to read full this article<
Get Radiology Tree app to read full this article<
Get Radiology Tree app to read full this article<
Get Radiology Tree app to read full this article<
Get Radiology Tree app to read full this article<
Get Radiology Tree app to read full this article<
Acknowledgments
Get Radiology Tree app to read full this article<
Get Radiology Tree app to read full this article<
References
1. Lansberg M.G., Albers G.W., Beaulieu C., Marks M.P.: Comparison of diffusion-weighted MRI and CT in acute stroke. Neurology 2000; 54: pp. 1557-1561.
2. Fiebach J.B., Schellinger P.D., Jansen O., et. al.: CT and diffusion-weighted MR imaging in randomized order: diffusion-weighted imaging results in higher accuracy and lower interrater variability in the diagnosis of hyperacute ischemic stroke. Stroke 2002; 33: pp. 2206-2210.
3. Saur D., Kucinski T., Grzyska U., et. al.: Sensitivity and interrater agreement of CT and diffusion-weighted MR imaging in hyperacute stroke. AJNR Am J Neuroradiol 2003; 24: pp. 878-885.
4. Hacke W., Donnan G., Fieschi C., et. al.: Association of outcome with early stroke treatment: pooled analysis of ATLANTIS, ECASS, and NINDS rt-PA stroke trials. Lancet 2004; 363: pp. 768-774.
5. Hacke W., Albers G., Al-Rawi Y., et. al.: The Desmoteplase in Acute Ischemic Stroke Trial (DIAS): a phase II MRI-based 9-hour window acute stroke thrombolysis trial with intravenous desmoteplase. Stroke 2005; 36: pp. 66-73.
6. Furlan A.J., Eyding D., Albers G.W., et. al.: Dose Escalation of Desmoteplase for Acute Ischemic Stroke (DEDAS): evidence of safety and efficacy 3 to 9 hours after stroke onset. Stroke 2006; 37: pp. 1227-1231.
7. Dávalos A., Blanco M., Pedraza S., et. al.: The clinical-DWI mismatch. A new diagnostic approach to the brain tissue at risk of infarction. Neurology 2004; 62: pp. 2187-2192.
8. Prosser J., Butcher K., Allport L., et. al.: Clinical-diffusion mismatch predicts the putative penumbra with high specificity. Stroke 2005; 36: pp. 1700-1704.
9. Tei H., Uchiyama S., Usai T.: Clinical-diffusion mismatch defined by NIHSS and ASPECTS in non-lacunar anterior circulation infarction. J Neurol 2007; 254: pp. 340-346.
10. Sasaki M., Ida M., Yamada K., Watanabe Y., Matsui M.: Standardizing display conditions of diffusion-weighted images using concurrent b0 images: a multi-vendor multi-institutional study. Magn Reson Med Sci 2007; 6: pp. 133-137.
11. Brott T., Adams H.P., Olinger C.P., et. al.: Measurements of acute cerebral infarction: a clinical examination scale. Stroke 1989; 20: pp. 864-870.
12. Barber P.A., Demchuk A.M., Zhang J., et. al., ASPECTS Study Group: Validity and reliability of a quantitative computed tomography score in predicting outcome of hyperacute stroke before thrombolytic therapy. Lancet 2000; 355: pp. 1670-1674.
13. Kobayashi T., Xu X.W., MacMahon H., Metz C.E., Doi K.: Effect of a computer-aided diagnosis scheme on radiologists’ performance in detection of lung nodules on radiographs. Radiology 1996; 199: pp. 843-848.
14. Kakeda S., Kamada K., Hatakeyama Y., et. al.: Effect of temporal subtraction technique on interpretation time and diagnostic accuracy of chest radiography. AJR Am J Roentgenol 2006; 187: pp. 1253-1259.
15. Hirai T., Korogi Y., Arimura H., et. al.: Intracranial aneurysms at MR angiography: effect of computer-aided diagnosis on radiologists’ detection performance. Radiology 2005; 237: pp. 605-610.
16. Metz C.E., Herman B.A., Shen J.H.: Maximum-likelihood estimation of receiver operating (ROC) characteristic curves from continuously-distributed data. Stat Med 1998; 17: pp. 1033-1053.
17. Asao C., Hirai T., Yoshimatsu S., et. al.: Human cerebral cortices: signal variation on diffusion-weighted MR imaging. Neuroradiology 2008; 50: pp. 205-211.
18. Hofmann E., Ochs G., Pelzl A., Warmuth-Metz M.: The corticospinal tract in amyotrophic lateral sclerosis: an MRI study. Neuroradiology 1998; 40: pp. 71-75.
19. Schaefer P.W., Grant P.E., Gonzalez R.G.: Diffusion-weighted MR imaging of the brain. Radiology 2000; 217: pp. 331-345.
20. Desmond P.M., Lovell A.C., Rawlinson A.A., et. al.: The value of apparent diffusion coefficient maps in early cerebral ischemia. AJNR Am J Neuroradiol 2001; 22: pp. 1260-1267.
21. Loh P.S., Butcher K.S., Parsons M.W., et. al.: Apparent diffusion coefficient thresholds do not predict the response to acute stroke thrombolysis. Stroke 2005; 36: pp. 2626-2631.