
Rationale and Objectives
The study goal was to evaluate the ability of diffusion-weighted imaging (DWI) in assessing the viability of rabbit liver VX-2 tumor after transcatheter arterial chemoembolization (TACE).
Materials and Methods
VX-2 tumors were grown in the livers of 19 rabbits, and chemoembolization was performed. MR imaging was acquired 1 week after TACE. The rabbits were killed for histologic investigation immediately after MR imaging, and the proportion of viable tumor was calculated based on histopathologic examination. Apparent diffusion coefficient (ADC) values were measured in viable and necrotic tumor portion, and were compared using the paired Student’s t test.
Results
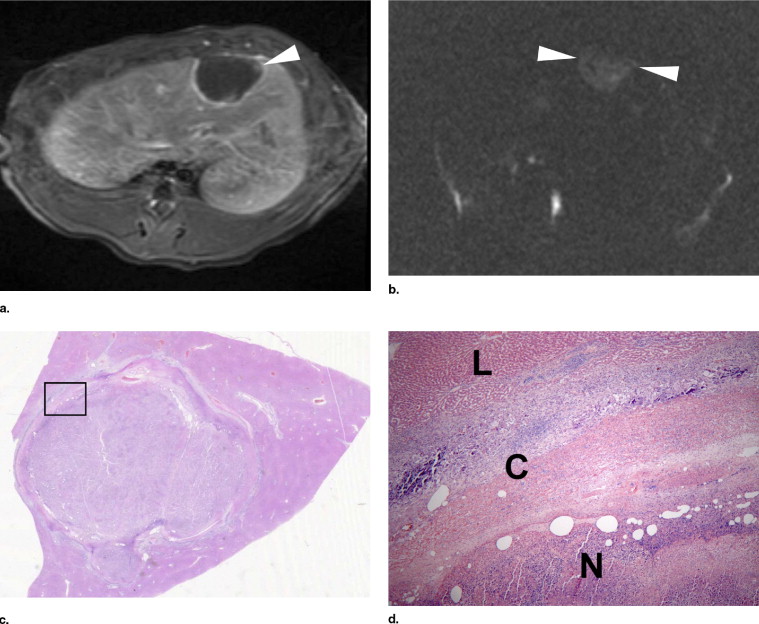
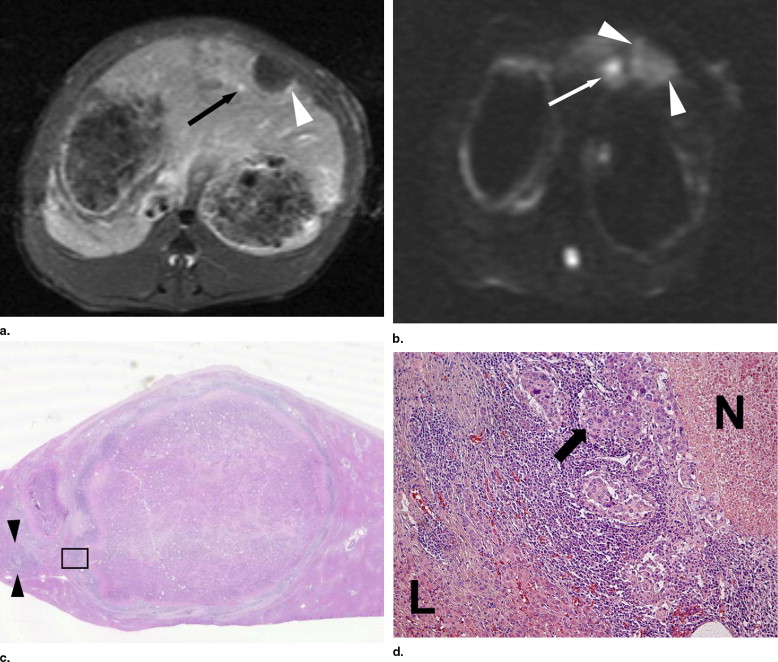
Viable tumors were absent (n = 3), less than 5% (n = 6), and 5% or more (n = 10) at pathology examination. On DWI, three tumors with no viable portion were interpreted as having no viable portion, but three of six tumors with a viable portion of less than 5% were considered as having no viable portion. The mean ADC values of necrotic and viable tumor were 1.653 ± 0.126 mm 2 /sec and 0.883 ± 0.407 mm 2 /sec ( b = 1000 sec/mm 2 ), respectively, and the ADC values of necrotic tumors were significantly greater than those in viable tumors ( p < .01).
Conclusion
Although DWI is a useful tool for assessing tumor viability, viable tumor may not be detected on DWI when it is too small.
Hepatocellular carcinoma (HCC) is one of the most frequent malignant tumors ( ). Because of an advanced disease stage and associated liver cirrhosis at its initial presentation, the treatment options are limited and transcatheter arterial chemoembolization (TACE) has been widely performed as a palliative treatment for HCC ( ).
Computed tomography (CT) and conventional magnetic resonance imaging (MRI) do not provide exact information about the extent of tumor cell death and the amount of viable tumor tissue after treatment ( ). Hyperattenuating Lipiodol impairs the assessment of residual tumor enhancement on contrast-enhanced CT ( ). On gadolinium-enhanced MRI, enhancing areas in the lesion are presumed to represent viable tumor, but they could also be due to post-treatment granulation tissue ( ). Diffusion-weighted imaging (DWI) was initially used to evaluate early ischemic brain lesions and its value in this field has been accepted. However, a few studies are available about DWI in evaluating hepatic lesions ( ).
Get Radiology Tree app to read full this article<
Materials and methods
Experimental Animals and the Establishments of a VX-2 Tumor Model
Get Radiology Tree app to read full this article<
Get Radiology Tree app to read full this article<
Get Radiology Tree app to read full this article<
Transcatheter Arterial Chemoembolization
Get Radiology Tree app to read full this article<
MRI Technique
Get Radiology Tree app to read full this article<
Image and Pathologic Analysis
Get Radiology Tree app to read full this article<
Get Radiology Tree app to read full this article<
Get Radiology Tree app to read full this article<
Results
Get Radiology Tree app to read full this article<
Table 1
Tumors at each image interpretation session and pathologic examination
Tumor Treatment Method Viable Tumor Rate on Pathologic Examination Viable Tumor Rate on Conventional Images Viable Tumor Rate on DWI 1 Lip-dox 17 ≥5 ≥5 2 Lip-dox 0 <5 0 3 Lip-dox 1 ≥5 0 4 Lip-dox 0 <5 0 5 Lip-dox 11 ≥5 ≥5 6 Lip-dox 21 ≥5 ≥5 7 Lip-dox 0 <5 0 8 Lip 15 ≥5 ≥5 9 Lip-eth 60 ≥5 ≥5 10 Lip-eth 1 ≥5 <5 11 Lip 40 ≥5 ≥5 12 Lip-eth 3 <5 0 13 Lip-eth 8 ≥5 ≥5 14 Lip-eth 1 ≥5 <5 15 Lip-eth 1 ≥5 0 16 Lip 25 ≥5 ≥5 17 Lip-dox 5 ≥5 ≥5 18 Lip-dox 3 <5 <5 19 Lip 14 ≥5 ≥5
Lip-dox, Lipiodol-doxorubicin emulsion (1.6 mg doxorubicin/0.4 ml Lipiodol); Lip-eth, Lipiodol-ethylbromopyruvate emulsion (40 mM ethylbromopyruvate/0.4 ml Lipiodol); Lip, Lipiodol 0.4 ml.
Get Radiology Tree app to read full this article<
Get Radiology Tree app to read full this article<
Get Radiology Tree app to read full this article<
Get Radiology Tree app to read full this article<
Get Radiology Tree app to read full this article<
Get Radiology Tree app to read full this article<
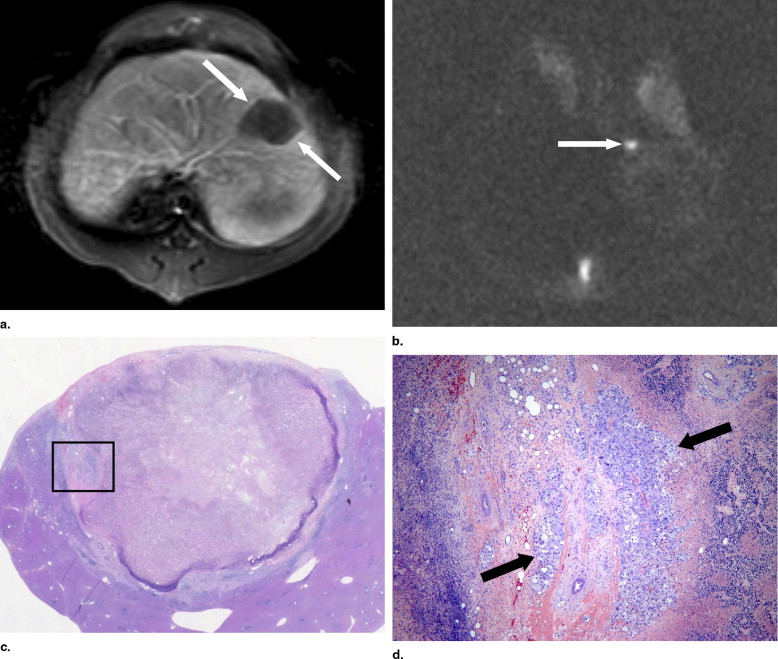
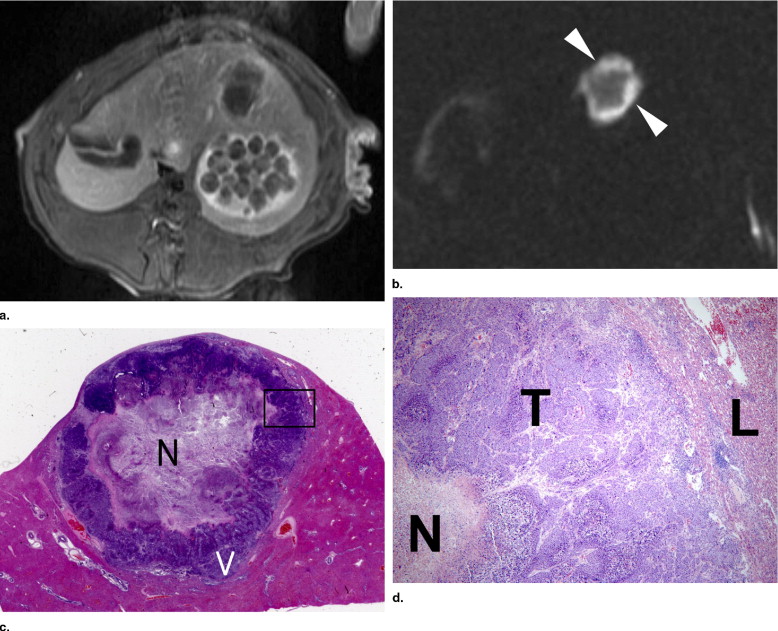
Table 2
Mean ADC values of viable tumor and necrotic tumor according to b -values
ADC Values Viable Tumor Necrotic Tumor_p_ -Value_b_ = 100 1.269 (0.428) × 10 −3 mm 2 /sec 2.135 (0.756) × 10 −3 mm 2 /sec <.01b = 500 1.047 (0.443) × 10 −3 mm 2 /sec 1.836 (0.489) × 10 −3 mm 2 /sec <.01b = 1000 0.883 (0.407) × 10 −3 mm 2 /sec 1.653 (0.126) × 10 −3 mm 2 /sec <.01
Numbers in parentheses are standard deviation.
ADC, apparent diffusion coefficient.
Get Radiology Tree app to read full this article<
Discussion
Get Radiology Tree app to read full this article<
Get Radiology Tree app to read full this article<
Get Radiology Tree app to read full this article<
Get Radiology Tree app to read full this article<
Get Radiology Tree app to read full this article<
Get Radiology Tree app to read full this article<
Get Radiology Tree app to read full this article<
Get Radiology Tree app to read full this article<
References
1. El-Serag H.B., Mason A.C.: Rising incidence of hepatocellular carcinoma in the United States. N Engl J Med 1999; 340: pp. 745-750.
2. Geschwind J.F.: Chemoembolization for hepatocellular carcinoma: Where does the truth lie?. J Vasc Interv Radiol 2002; 13: pp. 991-994.
3. Llovet J.M., Bruix J.: Systematic review of randomized trials for unresectable hepatocellular carcinoma: Chemoembolization improves survival. Hepatology 2003; 37: pp. 429-442.
4. Bruix J., Sala M., Llovet J.M.: Chemoembolization for hepatocellular carcinoma. Gastroenterology 2004; 127: pp. S179-S188.
5. Kim H.C., Kim A.Y., Han J.K., et. al.: Hepatic arterial and portal venous phase helical CT in patients treated with transcatheter arterial chemoembolization for hepatocellular carcinoma: Added value of unenhanced images. Radiology 2002; 225: pp. 773-780.
6. Teefey S.A., Hildeboldt C.C., Dehdashti F., et. al.: Detection of primary hepatic malignancy in liver transplant candidates: Prospective comparison of CT, MR imaging, US, and PET. Radiology 2003; 226: pp. 533-542.
7. Choi B.I.: The current status of imaging diagnosis of hepatocellular carcinoma. Liver Transpl 2004; 10: pp. S20-S25.
8. Lu D.S., Yu N.C., Raman S.S., et. al.: Radiofrequency ablation of hepatocellular carcinoma: Treatment success as defined by histologic examination of the explanted liver. Radiology 2005; 234: pp. 954-960.
9. Jang K.M., Choi D., Lim H.K., et. al.: Depiction of viable tumor in hepatocellular carcinoma treated with transarterial chemoembolization: Multiphasic helical CT with review of the previous serial CT images. Korean J Radiol 2005; 6: pp. 153-160.
10. Kuszyk B.S., Boitnott J.K., Choti M.A., et. al.: Local tumor recurrence following hepatic cryoablation: Radiologic-histopathologic correlation in a rabbit model. Radiology 2000; 217: pp. 477-486.
11. Ichikawa T., Haradome H., Hachiya J., et. al.: Diffusion-weighted MR imaging with a single-shot echoplanar sequence: Detection and characterization of focal hepatic lesions. AJR Am J Roentgenol 1998; 170: pp. 397-402.
12. Chiu F.Y., Jao J.C., Chen C.Y., et. al.: Effect of intravenous gadolinium-DTPA on diffusion-weighted magnetic resonance images for evaluation of focal hepatic lesions. J Comput Assist Tomogr 2005; 29: pp. 176-180.
13. Kamel I.R., Bluemke D.A., Eng J., et. al.: The role of functional MR imaging in the assessment of tumor response after chemoembolization in patients with hepatocellular carcinoma. J Vasc Interv Radiol 2006; 17: pp. 505-512.
14. Geschwind J.F., Artemov D., Abraham S., et. al.: Chemoembolization of liver tumor in a rabbit model: Assessment of tumor cell death with diffusion-weighted MR imaging and histologic analysis. J Vasc Interv Radiol 2000; 11: pp. 1245-1255.
15. Deng J., Rhee T.K., Sato K.T., et. al.: In vivo diffusion-weighted imaging of liver tumor necrosis in the VX2 rabbit model at 1.5 Tesla. Invest Radiol 2006; 41: pp. 410-414.
16. Yuan Y.H., Xiao E.H., Xiang J., et. al.: MR diffusion-weighted imaging of rabbit liver VX-2 tumor. World J Gastroenterol 2005; 11: pp. 3070-3074.
17. Lang P., Wendland M.F., Saeed M., et. al.: Osteogenic sarcoma: Noninvasive in vivo assessment of tumor necrosis with diffusion-weighted MR imaging. Radiology 1998; 206: pp. 227-235.
18. Maier C.F., Paran Y., Bendel P., et. al.: Quantitative diffusion imaging in implanted human breast tumors. Magn Reson Med 1997; 37: pp. 576-581.
19. Thoeny H.C., De Keyzer F., Vandecaveye V., et. al.: Effect of vascular targeting agent in rat tumor model: Dynamic contrast-enhanced versus diffusion-weighted MR imaging. Radiology 2005; 237: pp. 492-499.
20. Yoon C.J., Chung J.W., Park J.H., et. al.: Transcatheter arterial chemoembolization with paclitaxel-Lipiodol solution in rabbit VX2 liver tumor. Radiology 2003; 229: pp. 126-131.