
Rationale and Objectives
To evaluate the comparative performance of high-fidelity liquid crystal display (LCD) and cathode ray tube (CRT) devices for mammography applications, and to assess the impact of LCD viewing angle on detection accuracy.
Materials and Methods
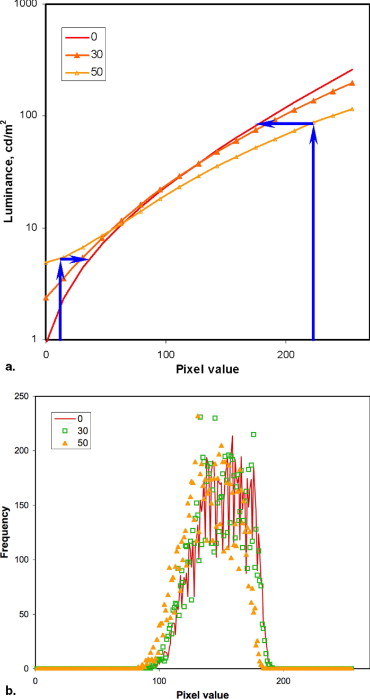
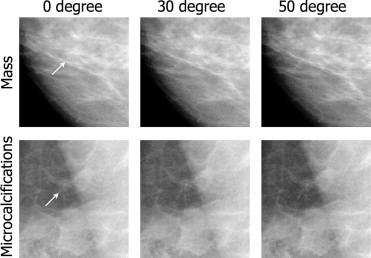
Ninety 1 k × 1 k images were selected from a database of digital mammograms: 30 without any abnormality present, 30 with subtle masses, and 30 with subtle microcalcifications. The images were used with waived informed consent, Health Insurance Portability and Accountability Act compliance, and Institutional Review Board approval. With postprocessing presentation identical to those of the commercial mammography system used, 1 k × 1 k sections of images were viewed on a monochrome CRT and a color LCD in native grayscale, and with a grayscale representative of images viewed from a 30° or 50° off-normal viewing angle. Randomized images were independently scored by four experienced breast radiologists for the presence of lesions using a 0–100 grading scale. To compare diagnostic performance of the display modes, observer scores were analyzed using receiver operating characteristic (ROC) and analysis of variance.
Results
For masses and microcalcifications, the detection rate in terms of the area under the ROC curve (A z ) showed a 2% increase and a 4% decrease from CRT to LCD, respectively. However, differences were not statistically significant ( P > .05). The viewing angle data showed better microcalcification detection but lower mass detection at 30° viewing orientation. The overall results varied notably from observer to observer yielding no statistically discernible trends across all observers, suggesting that within the 0–50° viewing angle range and in a controlled observer experiment, the variation in the contrast response of the LCD has little or no impact on the detection of mammographic lesions.
Conclusions
Although CRTs and LCDs differ in terms of angular response, resolution, noise, and color, these characteristics seem to have little influence on the detection of mammographic lesions. The results suggest comparable performance in clinical applications of the two devices.
The image technology for screening mammography is in a transition, with conventional analog screen-film mammography systems being gradually replaced by digital mammography systems. The transition is expected to accelerate because of a recent large-scale trial that found an essential equivalence of the two modalities for the majority of women but a notable advantage of digital for women with dense breasts ( ).
Soft-copy display is an integral element of digital mammography without which many advantages of digital mammography such as efficiency and optimized image quality would not be fully realized. Soft-copy display of digital mammograms may be achieved via two types of display devices: liquid crystal display (LCD) and cathode ray tube (CRT). These displays present distinctly differing resolution and noise characteristics. LCDs offer higher resolution but poorer noise performance than CRTs ( ). LCD technology has also enabled incorporation of color without an undue effect on display contrast, a common problem with color CRT displays, color CRTS have notably lower contrast ratios than their monochrome counterpart. This improvement suggests the possibility of using color LCDs for diagnosis. However, LCDs exhibit a non-Lambertian angular response characteristic by which the luminance and contrast of the displayed image changes as a function of viewing angle. Display specifications often characterize the angular response in terms of angular cones within which the luminance ratio exceeds 10, a threshold applicable to text applications. Using this metric, angular response specifications of 160–170° are common. However, within those ranges, the contrast of the medical images can change significantly, potentially affecting the diagnostic utility of LCDs.
Get Radiology Tree app to read full this article<
Materials and methods
Images
Get Radiology Tree app to read full this article<
Display Systems
Get Radiology Tree app to read full this article<
Get Radiology Tree app to read full this article<
Get Radiology Tree app to read full this article<
Get Radiology Tree app to read full this article<
Get Radiology Tree app to read full this article<
Observer Experiment
Get Radiology Tree app to read full this article<
Get Radiology Tree app to read full this article<
Statistical Analysis
Get Radiology Tree app to read full this article<
Results
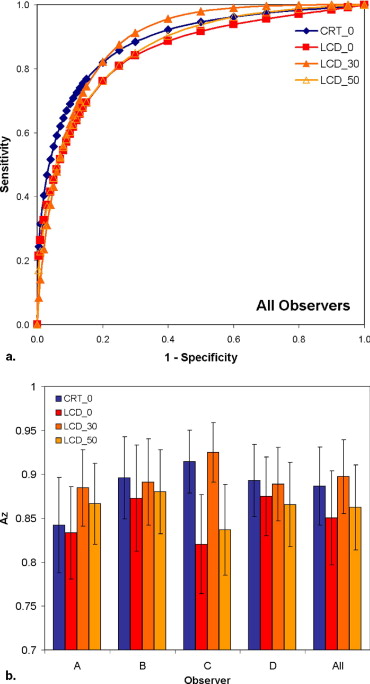
Detection of Microcalcifications
Get Radiology Tree app to read full this article<
Get Radiology Tree app to read full this article<
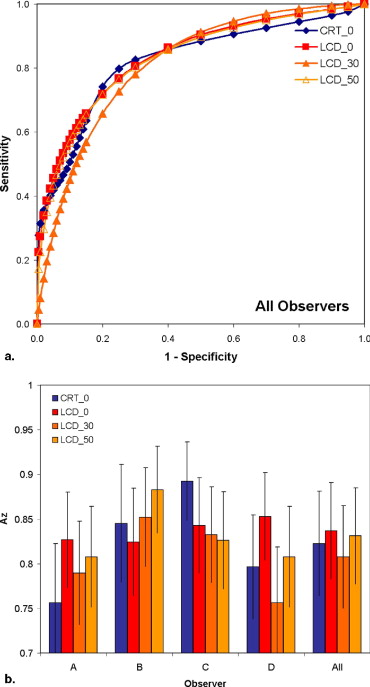
Table 1
Values for the Areas Under the ROC Curve (A z ) Associated With the Detection of Microcalcifications and Masses for Each Display (CRT and LCD at Different Viewing Angles) and for Each of the Four Observers
Observer CRT_0 LCD_0 LCD_30 LCD_50 Microcalcification Detection A 0.84 ± 0.05 0.83 ± 0.05 0.88 ± 0.04 0.87 ± 0.05 B 0.90 ± 0.05 0.87 ± 0.06 0.89 ± 0.05 0.88 ± 0.05 C 0.91 ± 0.04 0.82 ± 0.06 0.92 ± 0.03 0.84 ± 0.05 D 0.89 ± 0.04 0.87 ± 0.04 0.89 ± 0.04 0.87 ± 0.05 All 0.89 ± 0.04 0.85 ± 0.05 0.90 ± 0.04 0.86 ± 0.05 Mass Detection A 0.76 ± 0.07 0.83 ± 0.05 0.79 ± 0.06 0.81 ± 0.06 B 0.85 ± 0.07 0.82 ± 0.06 0.85 ± 0.06 0.88 ± 0.05 C 0.89 ± 0.04 0.84 ± 0.05 0.83 ± 0.05 0.83 ± 0.05 D 0.80 ± 0.06 0.85 ± 0.05 0.76 ± 0.06 0.81 ± 0.06 All 0.82 ± 0.06 0.84 ± 0.05 0.81 ± 0.06 0.83 ± 0.05
Note.—ROC, receiver operating characteristics; CRT, cathode ray tube; LCD, liquid crystal display.
Get Radiology Tree app to read full this article<
Get Radiology Tree app to read full this article<
Table 2
The Results of the Analysis of Variance Indicating that only the Case Variability Exhibited a Statistically Significant Impact
Source of Variability Microcalcification Detection P Value Mass Detection P Value Display .1316 .5284 Case <.05 ⁎ <.05 ⁎ Reader .5517 .5094 Display-Case .0766 .8405 Display-Reader .8975 .5875 Reader-Case <.05 ⁎
Get Radiology Tree app to read full this article<
Get Radiology Tree app to read full this article<
Detection of Masses
Get Radiology Tree app to read full this article<
Get Radiology Tree app to read full this article<
Get Radiology Tree app to read full this article<
Discussion
Get Radiology Tree app to read full this article<
Get Radiology Tree app to read full this article<
Get Radiology Tree app to read full this article<
Get Radiology Tree app to read full this article<
Get Radiology Tree app to read full this article<
Get Radiology Tree app to read full this article<
Get Radiology Tree app to read full this article<
Get Radiology Tree app to read full this article<
Conclusions
Get Radiology Tree app to read full this article<
Get Radiology Tree app to read full this article<
References
1. Pisano E.D., Gatsonis C., Hendrick E., et. al.: Diagnostic performance of digital versus film mammography for breast-cancer screening. N Engl J Med 2005; 353: pp. 1773-1783.
2. Saunders R.S., Samei E.: Resolution and noise measurements of selected commercial medical displays. Med Phys 2006; 33: pp. 308-319.
3. Krupinski E.A., Johnson J., Roehrig H., et. al.: Use of a human visual system model to predict observer performance with CRT vs LCD display of images. J Digit Imaging 2004; 17: pp. 258-263.
4. Saunders R.S., Samei E., Baker J.A., et. al.: Comparison of LCD and CRT displays based on utility for mammographic tasks. Acad Radiol 2006; 13: pp. 1317-1326.
5. Averbukh A.N., Channin D.S., Homhual P.: Comparison of human observer performance of contrast-detail detection across multiple liquid crystal displays. J Digit Imaging 2005; 18: pp. 66-77.
6. Krupinski E.A., Johnson J., Roehrig H., et. al.: On-axis and off-axis viewing of images on CRT displays and LCDs: observer performance and vision model predictions. Acad Radiol 2005; 12: pp. 957-964.
7. 2000.National Electrical Manufacturers AssociationRosslyn, VA
8. Samei E., Badano A., Chakraborty D., et. al.: Assessment of display performance for medical imaging systems: executive summary of AAPM TG18 report. Med Phys 2005; 32: pp. 1205-1225.
9. Samei E., Wright S.L.: The effect of viewing angle response on DICOM compliance of LCD displays. Proc SPIE 2004; 5371: pp. 170-177.
10. Saunders R.S., Samei E., Hoeschen C.: Impact of resolution and noise characteristics of digital radiographic detectors on the detectability of lung nodules. Med Phys 2004; 31: pp. 1603-1613.
11. Dorfman D.D., Berbaum K.S., Metz C.E.: Receiver operating characteristic rating analysis. Invest Radiol 1992; 27: pp. 723-731.
12. Swetz J.A., Pickett R.M.: 1982.Academic PressNew York
13. Samei E.: Assessment of display quality.Advances in digital radiography.2003.Radiological Society of North America (RSNA) PublicationOak Brook, IL:pp. 109-121.
14. Samei E.: AAPM/RSNA physics tutorial for residents: technological and psychophysical considerations for digital mammographic displays. Radiographics 2005; 25: pp. 491-501.
15. Yaffe M.J., Mainprize J.G.: Detectors for digital mammography. Technol Cancer Res Treat 2004; 3: pp. 309-324.
16. Averbukh A.N., Channin D.S., Flynn M.J.: Assessment of a novel, high-resolution, color, AMLCD for diagnostic medical image display: luminance performance and DICOM calibration. J Digit Imaging 2003; 16: pp. 270-279.
17. Samei E., Wright S.L.: Viewing angle performance of medical liquid crystal displays. Med Phys 2006; 33: pp. 645-654.
18. Fifadara D.H., Averbukh A.N., Channin D.S., et. al.: Effect of viewing angle on luminance and contrast for a five-million-pixel monochrome display and a nine-million-pixel color liquid crystal display. J Digit Imaging 2004; 17: pp. 264-270.
19. Hwang S.A., Seo J.B., Choi B.K., et. al.: Liquid-crystal display monitors and cathode-ray tube monitors: a comparison of observer performance in the detection of small solitary pulmonary nodules. Korean J Radiol 2003; 4: pp. 153-156.
20. Badano A., Hipper S.J., Jennings R.J.: Luminance effects on display resolution and noise. Proc SPIE 2002; 4681: pp. 305-313.
21. Badano A., Fifadara D.H.: Goniometric and conoscopic measurements of angular display contrast for one-, three-, five-, and nine-million-pixel medical liquid crystal displays. Med Phys 2004; 31: pp. 3452-3460.
22. Badano A., Gallas B.D.: Detectability decreases with off-normal viewing in medical liquid crystal displays.2005.pp. 307. [abstract]. RSNA Proceedings