
Rationale and Objectives
To assess the capability of digital tomosynthesis (DTS) as a problem-solving imaging technique to confirm or exclude potential thoracic lesions based on chest x-ray radiography (CXR).
Materials and Methods
Four hundred and-sixty five patients (263 male, 202 female; age, 72.47 ± 11.33 years) with suspected thoracic lesion(s) after the initial onsite analysis of CXR underwent DTS. Two independent readers prospectively analyzed in consensus CXR and DTS images on a picture archiving and communications system–integrated workstation and proposed a diagnosis according to a confidence score for each lesion: 1 or 2 = definite or probable pulmonary or pleural benign lesion or pseudolesion deserving no further diagnostic work-up; 3 = indeterminate; 4 or 5 = probable or definite pulmonary lesion deserving further diagnostic work-up by computed tomography (CT). In patients who did not undergo chest CT, the DTS findings had to be confirmed by 6 to 12 months’ imaging follow-up.
Results
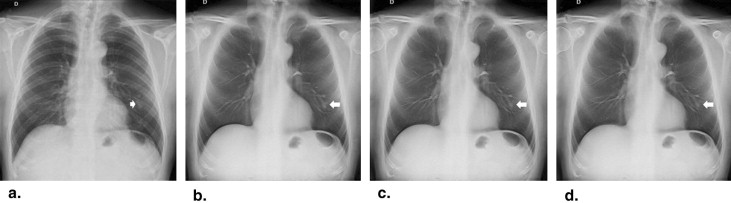
Finally, 229 pulmonary lesions (193 thoracic and 36 pleural lesions) and 236 pseudolesions were identified. Based on DTS images, readers correctly classified all pseudolesions except for 10/236 (reader 1) or 11/236 (reader 2) pseudolesions and 7 (reader 1) or 6 (reader 2) pulmonary subpleural lesions located in the anterior or posterior lung region close to the thoracic wall. Chest CT was performed in 127/465 (27%) patients, whereas in 338/465 patients (73%) CXR doubtful findings were resolved by DTS.
Conclusions
DTS allowed to exclude most pseudolesions initially considered as potential thoracic lesions on the preliminary onsite assessment of CXR and allowed to exclude pulmonary lesions deserving CT assessment in about three fourths of the patients.
On chest radiography (CXR) it is not unusual that a radiologist reports doubtful or equivocal findings that could be due to pulmonary or extrapulmonary lesions or even pseudolesions. True pulmonary lesions—particularly pulmonary nodules—can be difficult to differentiate from pseudolesions because of their frequent small size (<1 cm in diameter) and poor conspicuity against surrounding anatomical structures. A pseudolesion could be defined as an opacity not resulting from a true pulmonary or extrapulmonary lesion but to normal anatomical structures including composite areas of increased opacity from overlap of vascular and bone structures of the thoracic wall, vascular kinking, anatomic variant, rib fracture, bone island, or osteophytes. This represents an important clinical problem because up to 20% of suspected pulmonary nodules on CXR could actually represent other lesions.
Even though oblique radiographic views or chest fluoroscopy are still frequently employed to clarify a suspected CXR finding, many patients undergo computed tomography (CT), which frequently characterizes those findings as benign or extrapulmonary lesions or also as pseudolesions. In fact, however, CT is relatively expensive and delivers a considerable radiation dose , but it is not always readily available and scheduling with CT may delay workup of patients in busy CT services.
Get Radiology Tree app to read full this article<
Get Radiology Tree app to read full this article<
Get Radiology Tree app to read full this article<
Methods and materials
Patients
Get Radiology Tree app to read full this article<
Get Radiology Tree app to read full this article<
Get Radiology Tree app to read full this article<
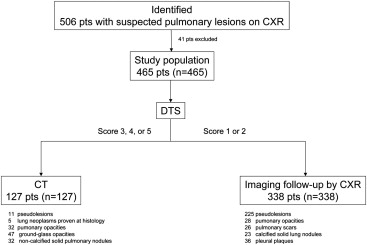
Table 1
Radiographic Pattern of Lesions
Diagnoses_n_ Mean Size (cm) ± SD Size Range (cm) Pulmonary opacities 60 2.5 ± 0.3 2–3 Primary lung neoplasms ∗ 5 2.5 ± 0.7 2–3 Ground-glass opacities/nodules ‡ 47 2.5 ± 0.4 2–3 Noncalcified solid nodules § 32 1.1 ± 0.3 0.5–1.5 Pulmonary scars † 26 1.1 ± 0.3 0.5–1.5 Calcified solid nodules 23 1.1 ± 0.3 0.5–1.5 Pleural plaques 36 2.4 ± 0.6 1–3 Pulmonary pseudolesions || 236 - - Total number 465 2.3 ± 1.1 0.5–4
Radiographic patterns of lesions included in the present study according to reference standards.
Get Radiology Tree app to read full this article<
Get Radiology Tree app to read full this article<
Get Radiology Tree app to read full this article<
Get Radiology Tree app to read full this article<
Get Radiology Tree app to read full this article<
Get Radiology Tree app to read full this article<
CXR
Get Radiology Tree app to read full this article<
DTS
Get Radiology Tree app to read full this article<
Get Radiology Tree app to read full this article<
Image Analysis
Get Radiology Tree app to read full this article<
Get Radiology Tree app to read full this article<
Table 2
Confidence Scoring System
Confidence Score Reader Finding 1 or 2 Definite or probable a) Benign pulmonary ∗ or extrapulmonary lesion † b) Pulmonary pseudolesion ‡ 3 Indeterminate § 4 or 5 Probable or definite pulmonary lesion ||
Diagnostic confidence scoring system.
Get Radiology Tree app to read full this article<
Get Radiology Tree app to read full this article<
Get Radiology Tree app to read full this article<
Get Radiology Tree app to read full this article<
Get Radiology Tree app to read full this article<
Get Radiology Tree app to read full this article<
Get Radiology Tree app to read full this article<
Patient Clinical Management
Get Radiology Tree app to read full this article<
Reference Standards
Get Radiology Tree app to read full this article<
Get Radiology Tree app to read full this article<
Get Radiology Tree app to read full this article<
CT Examination
Get Radiology Tree app to read full this article<
Get Radiology Tree app to read full this article<
Estimation of Effective Dose
Get Radiology Tree app to read full this article<
Get Radiology Tree app to read full this article<
Statistical Analysis
Get Radiology Tree app to read full this article<
Get Radiology Tree app to read full this article<
Get Radiology Tree app to read full this article<
Results
Get Radiology Tree app to read full this article<
Get Radiology Tree app to read full this article<
Get Radiology Tree app to read full this article<
Get Radiology Tree app to read full this article<
Table 3
Diagnostic Performance and Confidence: Reader 1
CXR DTS Reader 1 Sensitivity (%) 24 (34/144) 80 (116/144) Specificity (%) 10 (33/321) 95 (308/321) Accuracy (%) 15 (69/465) 91 (424/465) Diagnostic confidence: Number TP TN FP FN Number TP TN FP FN Score 1 1 — 1 — — 295 — 295 — — Score 2 35 — 32 — 3 15 — 13 — 2 Score 3 379 — — 303 73 17 ∗ — — 10 7 Score 4 46 34 — 12 — 51 32 — 19 — Score 5 4 0 — 4 — 87 84 — 3 — (AUC) (95% CI) 0.571 (0.525–0.616) 0.948 (0.924–0.967) Reader 2 Sensitivity (%) 17 (25/144) 85 (122/144) Specificity (%) 13 (43/321) 95 (308/321) Accuracy (%) 17 (78/465) 92 (430/465) Diagnostic confidence: Number TP TN FP FN Number TP TN FP FN Score 1 2 — 1 — 1 297 — 296 — 1 Score 2 45 — 42 — 3 13 — 12 — 1 Score 3 386 — — 304 82 17 ∗ — — 11 6 Score 4 31 25 — 6 — 31 22 — 9 — Score 5 1 0 — 1 — 107 102 — 5 — (AUC) (95% CI) 0.612 (0.566–0.656) 0.947 (0.923–0.966)
AUC, area under the receiver-operating characteristic curve; CI, confidence interval; CXR, chest radiography; DTS, digital tomosynthesis; NPV, negative predictive value; TN, true negative (benign pulmonary lesion—centrally calcified lesion or lesion with gross calcifications or calcified fibrotic scars with pulmonary architectural distortion—or extrapulmonary lesion or as a pulmonary pseudolesion [confidence levels 1, 2]; PPV, positive predictive value; TP, true positive (lesion correctly assessed as a noncalcified pulmonary lesion [confidence score 4 or 5] or a lesion appearing as a parenchymal or ground-glass opacity, or a solid or subsolid ground-glass pulmonary nodule).
Visual prospective analysis in the pulmonary lesion diagnosis.
The confidence scoring system is reported in Table 2 .
Sensitivity was defined as TP/(TP + FN); specificity, as TN/(TN + FP): accuracy; as (TP + TN)/(TP + TN + FP + FN).
All differences between chest radiography and digital tomosynthesis were statistically significant ( P < .05).
Get Radiology Tree app to read full this article<
Get Radiology Tree app to read full this article<
Get Radiology Tree app to read full this article<
Get Radiology Tree app to read full this article<
Get Radiology Tree app to read full this article<
Get Radiology Tree app to read full this article<
Discussion
Get Radiology Tree app to read full this article<
Get Radiology Tree app to read full this article<
Get Radiology Tree app to read full this article<
Get Radiology Tree app to read full this article<
Get Radiology Tree app to read full this article<
Get Radiology Tree app to read full this article<
Get Radiology Tree app to read full this article<
References
1. Erasmus J.J., Connolly J.E., McAdams H.P., et. al.: Solitary pulmonary nodules: part I. Morphologic evaluation for differentiation of benign and malignant lesions. Radiographics 2000; 20: pp. 43-58.
2. Remy-Jardin M., Remy J., Giraud F., et. al.: Pulmonary nodules: detection with thick-section spiral CT versus conventional CT. Radiology 1993; 187: pp. 513-520.
3. American Association of Physicists in Medicine: The measurement, reporting and management of radiation dose in CT. Report 96. AAPM Task Group 23 of the Diagnostic Imaging Council CT Committee.2008.American Association of Physicists in MedicineCollege Park, MD
4. Bley T.A., Baumann T., Saueressig U., et. al.: Comparison of radiologist and CAD performance in the detection of CT-confirmed subtle pulmonary nodules on digital chest radiographs. Invest Radiol 2008; 43: pp. 343-348.
5. Dobbins J.T., Godfrey D.J.: Digital x-ray tomosynthesis: current state of the art and clinical potential. Phys Med Biol 2003; 48: pp. R65-R106.
6. Dobbins J.T., Mc Adams H.P., Devon G., et. al.: Digital tomosynthesis of the chest. J Thorac Imaging 2008; 23: pp. 86-92.
7. Li B., Avinash G.B.: Optimization of slice sensitivity profile for radiographic tomosynthesis. Med Phys 2007; 34: pp. 2907-2916.
8. Dobbins J.T., Mc Adams H.P., Song J.W., et. al.: Digital tomosynthesis of the chest for lung nodule detection: interim sensitivity results from an ongoing NIH-sponsored trial. Med Phys 2008; 35: pp. 2554-2557.
9. Vikgren J., Zachrisson S., Svalkvist A., et. al.: Comparison of chest tomosynthesis and chest radiography for detection of pulmonary nodules: human observer study of clinical cases. Radiology 2008; 249: pp. 1034-1041.
10. Gomi T., Nakajima M., Fujiwara H., et. al.: Comparison of chest dual-energy subtraction digital tomosynthesis imaging and dual-energy subtraction radiography to detect simulated pulmonary nodules with and without calcifications a phantom study. Acad Radiol 2011; 18: pp. 191-196.
11. Yamada Y., Jinzaki M., Hasegawa I., et. al.: Fast scanning tomosynthesis for the detection of pulmonary nodules: diagnostic performance compared with chest radiography using multidetector-row computed tomography as the reference. Invest Radiol 2011; 46: pp. 471-477.
12. Quaia E., Baratella E., Cioffi V., et. al.: The value of digital tomosynthesis in the diagnosis of suspected pulmonary lesions on chest radiography: analysis of diagnostic accuracy and confidence. Acad Radiol 2010; 17: pp. 1267-1274.
13. Quaia E., Baratella E., Cernic S., et. al.: Analysis of the impact of digital tomosynthesis on the radiological investigation of patients with suspected pulmonary lesions on chest radiography. Eur Radiol 2012; 22: pp. 1912-1922.
14. Kim E.Y., Chung M.J., Lee H.Y., et. al.: Pulmonary mycobacterial disease: diagnostic performance of low-dose digital tomosynthesis as compared with chest radiography. Radiology 2010; 257: pp. 269-277.
15. Hansell D.M., Bankier A., Mac Mahon H., et. al.: Fleischner society: glossary of terms for thoracic imaging. Radiology 2008; 246: pp. 697-722.
16. Servomaa A., Tapiovaara M.: Organ dose calculation in medical X ray examinations by the program PCXMC. Radiat Prot Dosimetry 1998; 80: pp. 213-219.
17. Cristy M., Eckerman K.R.: Specific absorbed fractions of energy at various ages from internal photon sources. I. Method. Publication No ORNL/TM-8381.1987.Oak Ridge National LaboratoryOak Ridge, TN
18. Sabol J.M.: A Monte Carlo estimation of effective dose in chest tomosynthesis. Med Phys 2009; 36: pp. 5480-5487.
19. 1999.European CommissionBrussels, Belgium Available at: http://www.drs.dk/guidelines/ct/quality/mainindex.htm Accessed September 10, 2012
20. Campbell M.J., Machin D.: Medical statistics, a commonsense approach.1999.WileyChichester, United Kingdom 85–89
21. Beck J.R., Shultz E.K.: The use of relative operating characteristic (ROC) curves in test performance evaluation. Arch Pathol Lab Med 1986; 110: pp. 13-20.
22. Hanley J.A., McNeil B.J.: A method of comparing the areas under receiver operating characteristic curves derived from the same cases. Radiology 1983; 148: pp. 839-843.
23. Kundel H.L., Polansky M.: Measurement of observer agreement. Radiology 2003; 228: pp. 303-308.
24. Zhu X., Yu J., Huang Z.: Low-dose chest CT: optimizing radiation protection for patients. AJR Am J Roentgenol 2004; 183: pp. 809-816.
25. Gierada D.S., Pilgram T.K., Ford M., et. al.: Lung cancer: interobserver agreement on interpretation of pulmonary findings at low-dose CT screening. Radiology 2008; 246: pp. 265-272.
26. Godfrey D.J., McAdams H.P., Dobbins J.T.: Optimization of the matrix inversion tomosynthesis (MITS) impulse response and modulation transfer function characteristics for chest imaging. Med Phys 2006; 33: pp. 655-667.