
Rationale and Objectives
Differentiating mild cognitive impairment (MCI) and Alzheimer Disease (AD) from healthy aging remains challenging. This study aimed to explore the cerebral structural alterations of subjects with MCI or AD as compared to healthy elderly based on the individual and collective effects of cerebral morphologic indices using univariate and multivariate analyses.
Materials and Methods
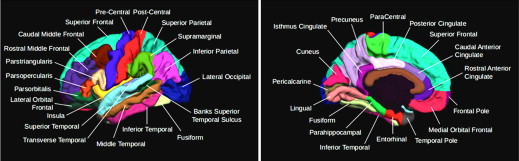
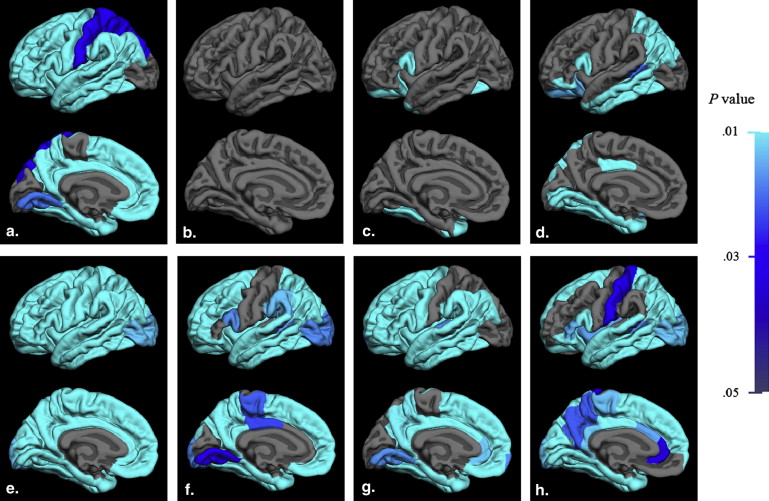
T1-weighted images (T1WIs) were retrieved from Alzheimer Disease Neuroimaging Initiative database for 116 subjects who were categorized into groups of healthy aging, MCI, and AD. Analysis of covariance (ANCOVA) and multivariate analysis of covariance (MANCOVA) were performed to explore the intergroup morphologic alterations indexed by surface area, curvature index, cortical thickness, and subjacent white matter volume with age and sex controlled as covariates, in 34 parcellated gyri regions of interest (ROIs) for both cerebral hemispheres based on the T1WI. Statistical parameters were mapped on the anatomic images to facilitate visual inspection.
Results
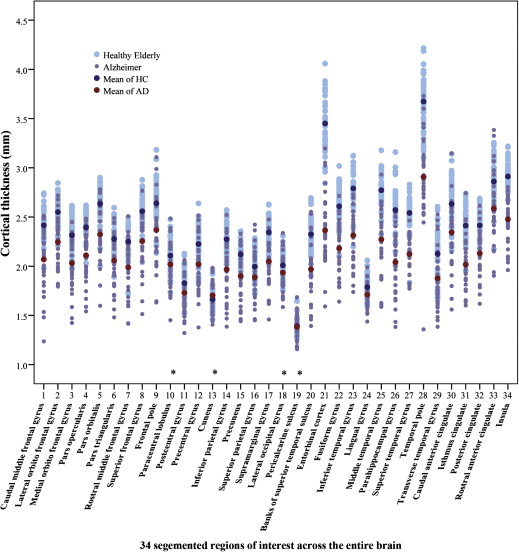
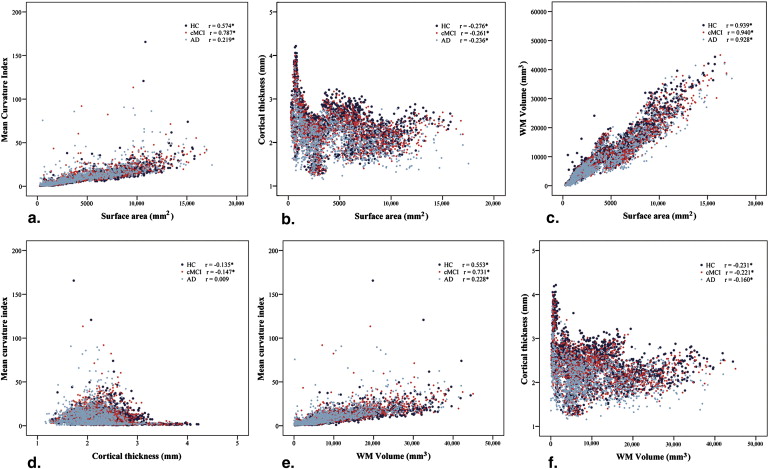
Global rather than region-specific structural alterations were revealed in groups of MCI and AD relative to healthy elderly using MANCOVA. ANCOVA revealed that the cortical thickness decreased more prominently in entorhinal, temporal, and cingulate cortices and was positively correlated with patients’ cognitive performance in AD group but not in MCI. The temporal lobe features marked atrophy of white matter during the disease dynamics. Significant intercorrelations were observed among the morphologic indices with univariate analysis for given ROIs.
Conclusions
Significant global structural alterations were identified in MCI and AD based on MANCOVA model with improved sensitivity. The intercorrelation among the morphologic indices may dampen the use of individual morphological parameter in featuring cerebral structural alterations. Decrease in cortical thickness is not reflective of the cognitive performance at the early stage of AD.
As a disease with increasing prevalence, Alzheimer disease (AD) has raised great medical and socioeconomic concerns . The onset of AD is difficult to define. It remains challenging for clinicians to identify the entity at the preclinical stage when patients are asymptomatic or just present with mild cognitive impairment (MCI) . Effective prevention and cure are yet to be developed through intensive research toward the better understanding of the mechanism and the dynamic of the disease. The accumulation of the disease pathology during predementia may result in macroscopic structural alterations in the brain, which allows characterization of the transition events of the disease and differentiating it from healthy aging.
The diagnosis may be reached based on information integrating patient’s overall medical condition, family history, physical and neurologic examinations, neuropsychological tests, and imaging studies . Objective parameters of molecular and structural markers have been investigated as supplementary evidences facilitating diagnosis and characterizing the disease dynamics. Cross-sectional and longitudinal brain research in healthy elders and patients with MCI who eventually developed AD (progressive MCI) has revealed regional structural and functional alterations well associated with cognitive impairment . Region-specific parenchymal tissue loss, amyloid plaque, and neurofibrillary tangle were reported to be associated with the gross architectural destruction identified by multimodality neuroimaging . Magnetic resonance imaging (MRI) with submillimeter resolution and postprocessing techniques of voxel-based morphometry has greatly facilitated the characterization of neuroanatomic features of AD patients relative to the age and gender–matched healthy elders with high reproductivity and accuracy . However, the effectiveness of the region-specific morphologic alterations in identifying the diseased brain based on single measure may be profoundly complicated because of the intercorrelation among the indices , which may lead to discrepancies in discrete studies. In this work, we aimed to investigate the cerebral structural alterations of MCI and AD groups based on cerebral surface area, curvature index, cortical thickness, and subjacent white matter volume collectively by multivariate analysis of covariance (MANCOVA), and reappraise the use of the individual morphologic parameter by analysis of covariance (ANCOVA) in the disease characterization.
Materials and methods
Subjects
Get Radiology Tree app to read full this article<
Table 1
Demographic Information of Subject Groups
HC Progressive MCI AD_n_ 44 39 33 Sex (Male/Female) 23/21 27/12 17/16 Age (years) X¯¯¯±S X
¯
±
S 76.3 ± 6.6 75.6 ± 7.3 77.8 ± 7.5 MMSE score X¯¯¯±S X
¯
±
S 29.3 ± 0.8 25.9 ± 2.3 14.9 ± 5.9 CDR scale 0 0–0.5 1–3
AD, Alzheimer disease; HC, healthy elderly control; MCI, mild cognitive impairment.
X¯¯¯±S X
¯
±
S , mean ± standard deviation.
Get Radiology Tree app to read full this article<
MR Image Processing
Get Radiology Tree app to read full this article<
Table 2
Typical Parameters of the T1-weighted Imaging
Facility TR (milliseconds) TE (milliseconds) TI (milliseconds) FA Weighting GE Medical Systems 8.92 3.9 1000 8° T1 Philips Medical System 8.60 4.0 0 8° T1 Siemens 2400/3000 ∗ 3.5 1000 8° T1
Get Radiology Tree app to read full this article<
Get Radiology Tree app to read full this article<
Get Radiology Tree app to read full this article<
Get Radiology Tree app to read full this article<
Statistical Analysis
Univariate analysis
Get Radiology Tree app to read full this article<
Multivariate analysis
Get Radiology Tree app to read full this article<
Multiple testing corrections
Get Radiology Tree app to read full this article<
Results
Univariate Analysis
Get Radiology Tree app to read full this article<
Get Radiology Tree app to read full this article<
Table 3
Number of Regions of Significant Difference with Percentage (%) of Each Morphologic Index Using ANCOVA and Post hoc Analysis
Morphologic Index One-way ANCOVA HC versus MCI ∗ HC versus AD ∗ MCI versus AD ∗ Uncorrected [ n (%)] FDR [ n (%)] Uncorrected [ n (%)] FDR [ n (%)] Uncorrected [ n (%)] FDR [ n (%)] Uncorrected [ n (%)] FDR [ n (%)] Surface area 3 (9) 0 1 (3) 0 1 (3) 0 2 (6) 0 Curvature index 12 (35) 4 (12) 5 (15) 3 (9) 8 (24) 4 (12) 1 (3) 0 Cortical thickness 30 (88) 30 (88) 19 (56) 19 (56) 30 (88) 30 (88) 27 (79) 27 (79) WM Volume 17 (50) 15 (44) 2 (6) 2 (6) 17 (50) 15 (44) 14 (41) 11 (32)
AD, Alzheimer disease; ANCOVA, analysis of covariance; FDR, false discovery rate; HC, healthy elderly control; MCI, mild cognitive impairment; WM, white matter.
Get Radiology Tree app to read full this article<
Get Radiology Tree app to read full this article<
Correlation among the Morphologic Indices and Cognitive Status
Get Radiology Tree app to read full this article<
Get Radiology Tree app to read full this article<
Multivariate Analysis
Get Radiology Tree app to read full this article<
Get Radiology Tree app to read full this article<
Discussion
Get Radiology Tree app to read full this article<
Get Radiology Tree app to read full this article<
Get Radiology Tree app to read full this article<
Get Radiology Tree app to read full this article<
Get Radiology Tree app to read full this article<
Get Radiology Tree app to read full this article<
Get Radiology Tree app to read full this article<
Get Radiology Tree app to read full this article<
Limitations
Get Radiology Tree app to read full this article<
Get Radiology Tree app to read full this article<
Conclusions
Get Radiology Tree app to read full this article<
Acknowledgments
Get Radiology Tree app to read full this article<
Get Radiology Tree app to read full this article<
Get Radiology Tree app to read full this article<
Get Radiology Tree app to read full this article<
References
1. Alzheimer’s Association: 2012 Alzheimer’s disease facts and figures. Alzheimers Dement 2012; 8: pp. 131-168.
2. Ballard C., Gauthier S., Corbett A., et. al.: Alzheimer’s disease. Lancet 2011; 377: pp. 1019-1031.
3. Sperling R.A., Karlawish J., Johnson K.A.: Preclinical Alzheimer disease - the challenges ahead. Nat Rev Neurol 2013; 9: pp. 54-58.
4. McKhann G., Drachman D., Folstein M., et. al.: Clinical diagnosis of Alzheimer’s disease: report of the NINCDS-ADRDA Work Group under the auspices of Department of Health and Human Services Task Force on Alzheimer’s Disease. Neurology 1984; 34: pp. 939-944.
5. American Psychiatric Association: Diagnostic and statistical manual of mental disorders (DSM-IV-TR).4th ed. — text revised2000.American Psychiatric PressWashington DCpp. 147-151.
6. Mattsson N., Rosen E., Hansson O., et. al.: Age and diagnostic performance of Alzheimer disease CSF biomarkers. Neurology 2012; 78: pp. 468-476.
7. Buchhave P., Minthon L., Zetterberg H., et. al.: Cerebrospinal fluid levels of beta-amyloid 1-42, but not of tau, are fully changed already 5 to 10 years before the onset of Alzheimer dementia. Arch Gen Psychiatry 2012; 69: pp. 98-106.
8. Thompson P.M., Hayashi K.M., de Zubicaray G., et. al.: Dynamics of gray matter loss in Alzheimer’s disease. J Neurosci 2003; 23: pp. 994-1005.
9. Devanand D.P., Pradhaban G., Liu X., et. al.: Hippocampal and entorhinal atrophy in mild cognitive impairment: prediction of Alzheimer disease. Neurology 2007; 68: pp. 828-836.
10. McEvoy L.K., Fennema-Notestine C., Roddey J.C., et. al.: Alzheimer disease: quantitative structural neuroimaging for detection and prediction of clinical and structural changes in mild cognitive impairment. Radiology 2009; 251: pp. 195-205.
11. Misra C., Fan Y., Davatzikos C.: Baseline and longitudinal patterns of brain atrophy in MCI patients, and their use in prediction of short-term conversion to AD: results from ADNI. Neuroimage 2009; 44: pp. 1415-1422.
12. Leung K.K., Barnes J., Ridgway G.R., et. al.: Automated cross-sectional and longitudinal hippocampal volume measurement in mild cognitive impairment and Alzheimer’s disease. Neuroimage 2010; 51: pp. 1345-1359.
13. Ries M.L., Carlsson C.M., Rowley H.A., et. al.: Magnetic resonance imaging characterization of brain structure and function in mild cognitive impairment: a review. J Am Geriatr Soc 2008; 56: pp. 920-934.
14. Brown P.J., Devanand D.P., Liu X., et. al.: Functional impairment in elderly patients with mild cognitive impairment and mild Alzheimer disease. Arch Gen Psychiatry 2011; 68: pp. 617-626.
15. McDonald C.R., Gharapetian L., McEvoy L.K., et. al.: Relationship between regional atrophy rates and cognitive decline in mild cognitive impairment. Neurobiol Aging 2012; 33: pp. 242-253.
16. Perrin R.J., Fagan A.M., Holtzman D.M.: Multi-modal techniques for diagnosis and prognosis of Alzheimer’s disease. Nature 2009; 461: pp. 916-922.
17. Ashburner J., Friston K.J.: Voxel-based morphometry - the methods. Neuroimage 2000; 11: pp. 805-821.
18. Querbes O., Aubry F., Pariente J., et. al.: Early diagnosis of Alzheimer’s disease using cortical thickness: impact of cognitive reserve. Brain 2009; 132: pp. 2036-2047.
19. Kochunov P., Thompson P.M., Coyle T.R., et. al.: Relationship among neuroimaging indices of cerebral health during normal aging. Hum Brain Mapp 2008; 29: pp. 36-45.
20. Shi F., Liu B., Zhou Y., et. al.: Hippocampal volume and asymmetry in mild cognitive impairment and Alzheimer’s disease: Meta-analyses of MRI studies. Hippocampus 2009; 19: pp. 1055-1064.
21. Im K., Lee J.M., Seo S.W., et. al.: Sulcal morphology changes and their relationship with cortical thickness and gyral white matter volume in mild cognitive impairment and Alzheimer’s disease. Neuroimage 2008; 43: pp. 103-113.
22. Morris J.C.: The Clinical Dementia Rating (CDR): current version and scoring rules. Neurology 1993; 43: pp. 2412-2414.
23. Cummings J.L.: Mini-Mental State Examination. Norms, normals, and numbers. JAMA 1993; 269: pp. 2420-2421.
24. Jack C.R., Bernstein M.A., Fox N.C., et. al.: The Alzheimer’s disease neuroimaging initiative (ADNI): MRI methods. J Magn Reson Imaging 2008; 27: pp. 685-691.
25. Fischl B., van der Kouwe A., Destrieux C., et. al.: Automatically parcellating the human cerebral cortex. Cereb Cortex 2004; 14: pp. 11-22.
26. Desikan R.S., Segonne F., Fischl B., et. al.: An automated labeling system for subdividing the human cerebral cortex on MRI scans into gyral based regions of interest. Neuroimage 2006; 31: pp. 968-980.
27. Long X., Zhang L., Liao W., et. al.: Distinct laterality alterations distinguish mild cognitive impairment and Alzheimer’s disease from healthy aging: statistical parametric mapping with high resolution MRI. Hum Brain Mapp 2013; 34: pp. 3400-3410.
28. Dale A.M., Fischl B., Sereno M.I.: Cortical surface-based analysis. I. Segmentation and surface reconstruction. Neuroimage 1999; 9: pp. 179-194.
29. Fischl B., Sereno M., Dale A.: Cortical surface-based analysis. II: Inflation, flattening, and a surface-based coordinate system. Neuroimage 1999; 9: pp. 195-207.
30. Fischl B., Dale A.M.: Measuring the thickness of the human cerebral cortex from magnetic resonance images. Proc Natl Acad Sci U S A 2000; 97: pp. 11050-11055.
31. Long X., Liao W., Jiang C., et. al.: Healthy aging: an automatic analysis of global and regional morphological alterations of human brain. Acad Radiol 2012; 19: pp. 785-793.
32. Benjamini Y., Hochberg Y.: Controlling the false discovery rate: a practical and powerful approach to multiple testing. J R Stat Soc Ser B Methodol 1995; 57: pp. 289-300.
33. Evans M.C., Barnes J., Nielsen C., et. al.: Volume changes in Alzheimer’s disease and mild cognitive impairment: cognitive associations. Eur Radiol 2010; 20: pp. 674-682.
34. Nestor S.M., Rupsingh R., Borrie M., et. al.: Ventricular enlargement as a possible measure of Alzheimer’s disease progression validated using the Alzheimer’s disease neuroimaging initiative database. Brain 2008; 131: pp. 2443-2454.
35. Braak H., Braak E.: Neuropathological stageing of Alzheimer-related changes. Acta Neuropathol 1991; 82: pp. 239-259.
36. Dickerson B.C., Wolk D.A.: MRI cortical thickness biomarker predicts AD-like CSF and cognitive decline in normal adults. Neurology 2012; 78: pp. 84-90.
37. Seo S.W., Lee J.H., Jang S.M., et. al.: Neurochemical alterations of the entorhinal cortex in amnestic mild cognitive impairment (aMCI): a three-year follow-up study. Arch Gerontol Geriatr 2012; 54: pp. 192-196.
38. Mueller S.G., Schuff N., Yaffe K., et. al.: Hippocampal atrophy patterns in mild cognitive impairment and Alzheimer’s disease. Hum Brain Mapp 2010; 31: pp. 1339-1347.
39. Adachi M., Kawakatsu S., Hosoya T., et. al.: Morphology of the inner structure of the hippocampal formation in Alzheimer disease. AJNR Am J Neuroradiol 2003; 24: pp. 1575-1581.
40. Poulin S.P., Dautoff R., Morris J.C., et. al.: Amygdala atrophy is prominent in early Alzheimer’s disease and relates to symptom severity. Psychiatry Res 2011; 194: pp. 7-13.
41. Murphy E.A., Holland D., Donohue M., et. al.: Six-month atrophy in MTL structures is associated with subsequent memory decline in elderly controls. Neuroimage 2010; 53: pp. 1310-1317.
42. Varon D., Loewenstein D.A., Potter E., et. al.: Minimal atrophy of the entorhinal cortex and hippocampus: progression of cognitive impairment. Dement Geriatr Cogn Disord 2011; 31: pp. 276-283.
43. Kochunov P., Mangin J.F., Coyle T., et. al.: Age-related morphology trends of cortical sulci. Hum Brain Mapp 2005; 26: pp. 210-220.
44. Li Y., Wang Y., Wu G., et. al.: Discriminant analysis of longitudinal cortical thickness changes in Alzheimer’s disease using dynamic and network features. Neurobiol Aging 2012; 33: pp. 415-427.
45. Donix M., Burggren A.C., Suthana N.A., et. al.: Longitudinal changes in medial temporal cortical thickness in normal subjects with the APOE-4 polymorphism. Neuroimage 2010; 53: pp. 37-43.
46. Toro R., Perron M., Pike B., et. al.: Brain size and folding of the human cerebral cortex. Cereb Cortex 2008; 18: pp. 2352-2357.
47. Fischl B., Rajendran N., Busa E., et. al.: Cortical folding patterns and predicting cytoarchitecture. Cereb Cortex 2008; 18: pp. 1973-1980.
48. van der Flier W.M., Pijnenburg Y.A., Fox N.C., et. al.: Early-onset versus late-onset Alzheimer’s disease: the case of the missing APOE varepsilon4 allele. Lancet Neurol 2011; 10: pp. 280-288.
49. Koedam E.L., Lauffer V., van der Vlies A.E., et. al.: Early-versus late-onset Alzheimer’s disease: more than age alone. J Alzheimers Dis 2010; 19: pp. 1401-1408.