
Rationale and Objectives
This study aimed to measure apparent diffusion coefficient (ADC) in Chinese patients with newly diagnosed multiple myeloma by whole-body diffusion-weighted magnetic resonance imaging (WB-DWI MRI) and assess the diagnostic accuracy of ADC in the discrimination of deep response to induction chemotherapy.
Materials and Methods
Seventeen patients underwent WB-DWI MRI before and after induction chemotherapy (week 20). DWI images and ADC maps were produced and 89 regions of interest were chosen. ADC percent changes were compared between deep (complete response or very good partial response) and non–deep responders (partial response, minimal response, stable disease, or progressive disease) as International Myeloma Working Group criteria. Diagnostic accuracy of ADC was calculated using specific cut offs. Predictive positive value of ADC was calculated to predict deep response to consolidation therapy.
Results
Lesions reduced in size and number and signal intensity decreased in follow-up DWI, which did not differ between deep and non–deep responders. ADC percent changes were significantly higher in deep responders (36.79%) than in non–deep responders (11.50%) after induction therapy ( P = .02) in per lesion analysis. ADC percent increases by 46.96%, 78.0% yielded specificity at 81.4%, 90.7% in discriminating deep response to induction therapy. Predictive positive value predicting deep response to consolidation therapy was 60.5% by using ADC cutoff >1.00 × 10 −3 mm 2 /s at week 20.
Conclusions
ADC from WB-DWI MRI increased remarkably in patients who achieved deep response at the end of induction chemotherapy, which represented a confirmatory diagnostic tool to discriminate deep response to induction therapy for patients with multiple myeloma. ADC may have a potential to predict deep response to consolidation therapy.
Introduction
Multiple myeloma (MM) is the second most common hematologic malignancy characterized by clonal proliferation of plasma cells, which may produce excessive amounts of monoclonal immunoglobulins. MM accounts for 10%–15% of all hematologic malignancies and results in 15%–20% deaths . With the introduction of novel therapeutics including immunomodulatory agents (thalidomide, lenalidomide) and proteasome inhibitors (bortezomib), the prognosis of patients with MM has significantly improved. Recent studies have confirmed the significance of deep response particularly complete response (CR) or very good partial response (VGPR) to induction therapy for patients with newly diagnosed MM .
On the other hand, methods for evaluating treatment response still remain scarce and existing ones have limitations. Serum or urine measurements (M-proteins, free light chain) are part of clinical assessment but lack reliability in non-secretory MM. Bone marrow biopsy is invasive, and sampling errors may occur because of scattered bone lesions . Conventional radiographs provide morphologic information and are still the primary choice for response assessment and follow-up in MM . However, functional changes in lytic bone lesions cannot easily be captured by conventional radiology, even after an effective therapy , causing difficulty in the discrimination of treatment response in MM. More advanced techniques, including positron emission tomography-computed tomography, may be clinically limited by higher cost and radiation exposure.
Get Radiology Tree app to read full this article<
Get Radiology Tree app to read full this article<
Materials and Methods
Study Design
Get Radiology Tree app to read full this article<
Patient
Get Radiology Tree app to read full this article<
Get Radiology Tree app to read full this article<
Image Acquisition and Analysis
Get Radiology Tree app to read full this article<
Get Radiology Tree app to read full this article<
Get Radiology Tree app to read full this article<
Laboratory Measurements and Clinical Outcomes
Get Radiology Tree app to read full this article<
Statistical Analysis
Get Radiology Tree app to read full this article<
Get Radiology Tree app to read full this article<
Get Radiology Tree app to read full this article<
Get Radiology Tree app to read full this article<
Results
Patient Characteristics and Lesions
Get Radiology Tree app to read full this article<
TABLE 1
Baseline Clinical Characteristics of 17 Patients
Age 58.4 (7.8) Gender Male 9 (52.9) Female 8 (47.1) Type A/κ 2 (11.8) A/λ 4 (23.5) G/κ 6 (35.3) G/λ 3 (17.6) Other * 2 (10.8) D-S staging IIA 3(17.6) IIIA 14(82.4) ISS staging I 2 (11.8) II 9 (52.9) III 6 (35.3) Deep response † Induction therapy 10 (58.8) Consolidate therapy 9 (52.9) No. of lesions ≤3 7 (41.2) 5–7 8 (47.1) ≥8 2 (11.8)
CR, complete response; D-S, Durie-Salmon; ISS, international staging system; VGPR, very good partial response.
Numerical variable was expressed as mean, median, and SD. Categorical variable was expressed as n (%). Other included D/κ and λ.
Get Radiology Tree app to read full this article<
Get Radiology Tree app to read full this article<
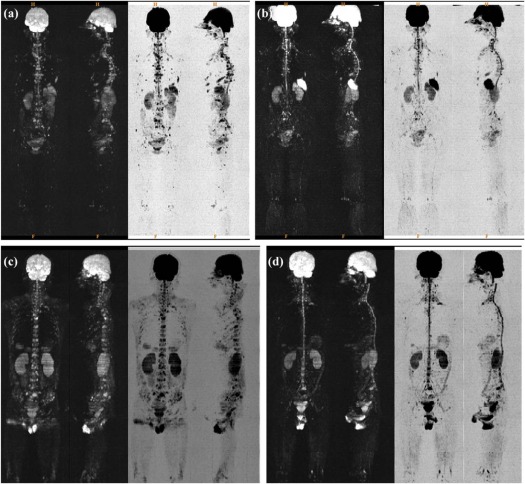
ADC Changes and DWI Images
Get Radiology Tree app to read full this article<
TABLE 2
Per-lesion and Per-patient Analysis on Mean ADC Changes Over Baseline by Treatment Response at Post-induction Phase
Mean ADC (× 10 −3 mm 2 /s) Per-lesion Analysis_P_ Value Per-patient Analysis_P_ Value Deep Response Non–Deep Response Deep Response Non–Deep Response_n_ = 46n = 43n = 10n = 7 Baseline 1.03 (0.25) 1.03 (0.25) .75 1.05 (0.13) 1.04 (0.17) .94 Week 20 1.43 (0.64) 1.14 (0.53) .03 1.43 (0.54) 1.10 (0.40) .18 ADC change 0.38 (0.58) * 0.11 (0.53) <.01 0.39 (0.49) † 0.06 (0.40) .14 ADC change (%) 36.79 (53.58) 11.50 (42.40) .02 36.00 (45.58) 6.63 (34.99) .16
ADC, apparent diffusion coefficient; CR, complete response; MR, minimal response; PD, progressive disease; PR, partial response; SD, stable disease; VGPR, very good partial response.
Data are presented by mean (SD).
Deep response was defined as VGPR or CR. Non–deep response was defined as PR, MR, SD, or PD. P < .01.
Get Radiology Tree app to read full this article<
Get Radiology Tree app to read full this article<
Get Radiology Tree app to read full this article<
Get Radiology Tree app to read full this article<
Get Radiology Tree app to read full this article<

Get Radiology Tree app to read full this article<
Association Between ADC and Deep Response
Get Radiology Tree app to read full this article<
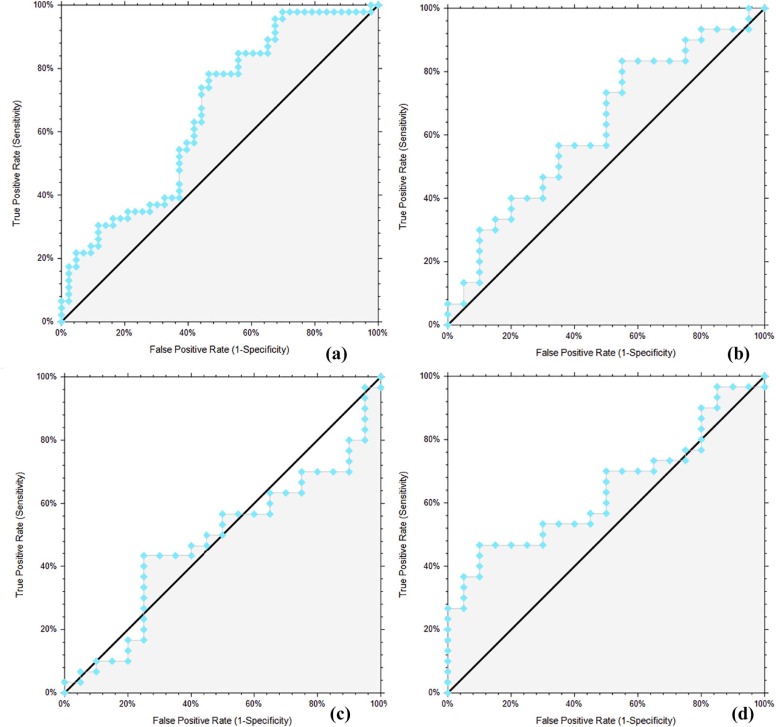
Diagnostic Accuracy for Post-induction Deep Response
Get Radiology Tree app to read full this article<
TABLE 3
Diagnostic Accuracy of ADC in the Discrimination of Deep Response at the End of Induction Chemotherapy
AUC (95%CI) Cutoff Value Sensitivity (%) (95%CI) Specificity (%) (95%CI) Likelihood Ratio (+) ADC Week 20
(× 10 −3 mm 2 /s) 0.63 * (0.50, 0.73) 0.78 91.3 (79.7, 96.6) 18.6 (9.7, 32.6) 1.12 (0.95, 1.37) 0.84 82.6 (69.3, 90.9) 23.3 (13.2, 37.7) 1.08 (0.86, 1.36) 1.16 50.0 (36.1, 63.9) 72.1 (57.3, 83.3) 1.79 (1.05, 3.28) 1.54 37.0 (24.5, 51.4) 81.4 (67.4, 90.3) 1.99 (0.99, 4.39) 2.01 28.3 (17.3, 42.6) 90.7 (78.4, 96.3) 3.04 (1.16, 9.89) ADC Change (%) 0.66 † (0.53, 0.76) -14.30 91.3 (79.7, 96.5) 32.6 (20.5, 47.5) 1.35 (1.10, 1.76) -6.59 80.4 (66.8, 89.4) 44.2 (30.4, 58.9) 1.44 (1.08, 2.01) 1.09 67.4 (53.0, 79.1) 55.8 (41.1, 69.6) 1.53 (1.05, 2.33) 46.96 32.6 (20.9, 47.0) 81.4 (67.4, 90.3) 1.75 (0.85, 3.93) 78.00 26.1 (15.6, 40.3) 90.7 (78.4, 96.3) 2.80 (1.05, 9.20)
ADC, apparent diffusion coefficient; CR, complete response; ROC AUC, receiver operating characteristic area under curve; VGPR, very good partial response.
Selection criteria for ADC and ADC percent change cutoff values were sensitivity or specificity >90%, >80%, or a maximum of sensitivity + specificity. P = .03.
Get Radiology Tree app to read full this article<
Get Radiology Tree app to read full this article<
Get Radiology Tree app to read full this article<
Get Radiology Tree app to read full this article<
Get Radiology Tree app to read full this article<
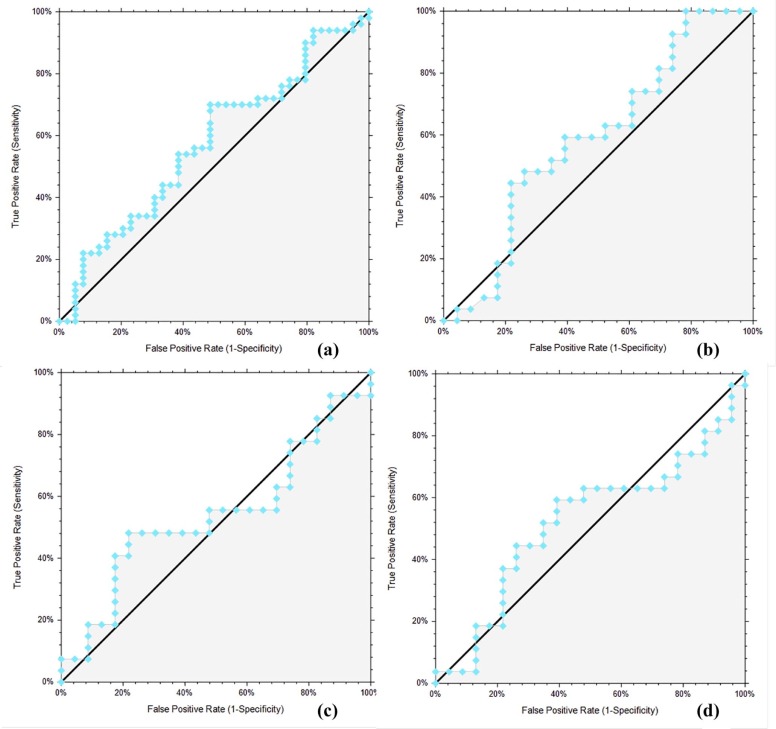
Prediction for Depth of Response
Get Radiology Tree app to read full this article<
TABLE 4
Predictive Profile of ADC on Post-induction and Post-consolidation Deep Response by Per Lesion Analysis
ADC(× 10 −3 mm 2 /s) Deep Response Induction PPV Deep Response Consolidation PPV (+) (−) Unadjusted Adjusted (+) (−) Unadjusted Adjusted Baseline ≤1.00 23 20 53.5 61.7 21 22 48.8 50.5 ≤1.20 37 35 51.4 59.7 40 32 55.6 57.2 ≤1.50 44 43 50.6 58.9 50 37 57.5 59.5 Week 20 >1.00 26 17 60.5 62.0 >1.50 14 12 53.8 55.5 >2.00 9 8 52.9 54.6 Percent change Any increase 26 24 52.0 53.6 >10.0 22 21 51.2 52.8 >40.0 14 11 56.0 57.6
ADC, apparent diffusion coefficient; CR, complete response; PPV, positive predictive value; VGPR, very good partial response.
Bone lesions with ADC value n = 89; ADC percent change ROC AUC: 0.60, P = .20.
PPV values are expressed as % and adjusted for deep response (prior prevalence) at 60.0%.
Deep response was defined as VGPR or CR.
Get Radiology Tree app to read full this article<
Get Radiology Tree app to read full this article<
Discussion
Get Radiology Tree app to read full this article<
Get Radiology Tree app to read full this article<
Get Radiology Tree app to read full this article<
Get Radiology Tree app to read full this article<
Get Radiology Tree app to read full this article<
Get Radiology Tree app to read full this article<
Get Radiology Tree app to read full this article<
Conclusions
Get Radiology Tree app to read full this article<
Acknowledgment
Get Radiology Tree app to read full this article<
Supplementary Data
Get Radiology Tree app to read full this article<
Appendix S1
Get Radiology Tree app to read full this article<
Get Radiology Tree app to read full this article<
Get Radiology Tree app to read full this article<
Get Radiology Tree app to read full this article<
References
1. Bataille R., Harousseau J.L.: Multiple myeloma. N Engl J Med 1997; 336: pp. 1657-1664.
2. Dimopoulos M., Terpos E., Comenzo R.L., et. al.: International myeloma working group consensus statement and guidelines regarding the current role of imaging techniques in the diagnosis and monitoring of multiple Myeloma. Leukemia 2009; 23: pp. 1545-1556.
3. International Myeloma Working G : Criteria for the classification of monoclonal gammopathies, multiple myeloma and related disorders: a report of the International Myeloma Working Group. Br J Haematol 2003; 121: pp. 749-757.
4. Liang Z., Ren H., Cen X., et. al.: [Bortezomib-based chemotherapy for patients with multiple myeloma: a single center experience]. Zhonghua Xue Ye Xue Za Zhi 2014; 35: pp. 225-230.
5. Zhou L.L., Yuan Z.G., Fu W.J., et. al.: Clinical effects of autologous stem cell transplantation as consolidation treatment in 70 multiple myeloma patients: a case-controlled study. Chin Med J 2011; 124: pp. 2975-2980.
6. Tang Y., Yu Y.H., Yao Y.Y., et. al.: Once-weekly 1.6 mg/m2 bortezomib BCD regimen in elderly patients with newly diagnosed multiple myeloma who are unfit for standard dose chemotherapy. Indian J Hematol Blood Transfus 2017; 33: pp. 22-30.
7. Durie B.G., Harousseau J.L., Miguel J.S., et. al.: International uniform response criteria for multiple myeloma. Leukemia 2006; 20: pp. 1467-1473.
8. Durie B.G., Salmon S.E.: A clinical staging system for multiple myeloma. Correlation of measured myeloma cell mass with presenting clinical features, response to treatment, and survival. Cancer 1975; 36: pp. 842-854.
9. Terpos E., Moulopoulos L.A., Dimopoulos M.A.: Advances in imaging and the management of myeloma bone disease. J Clin Oncol 2011; 29: pp. 1907-1915.
10. Hillengass J., Landgren O.: Challenges and opportunities of novel imaging techniques in monoclonal plasma cell disorders: imaging “early myeloma.”. Leuk Lymphoma 2013; 54: pp. 1355-1363.
11. Caers J., Withofs N., Hillengass J., et. al.: The role of positron emission tomography-computed tomography and magnetic resonance imaging in diagnosis and follow up of multiple myeloma. Haematologica 2014; 99: pp. 629-637.
12. Bammer R.: Basic principles of diffusion-weighted imaging. Eur J Radiol 2003; 45: pp. 169-184.
13. Kwee T.C., Takahara T., Ochiai R., et. al.: Whole-body diffusion-weighted magnetic resonance imaging. Eur J Radiol 2009; 70: pp. 409-417.
14. Kwee T.C., Takahara T., Ochiai R., et. al.: Diffusion-weighted whole-body imaging with background body signal suppression (DWIBS): features and potential applications in oncology. Eur Radiol 2008; 18: pp. 1937-1952.
15. Padhani A.R., Liu G., Koh D.M., et. al.: Diffusion-weighted magnetic resonance imaging as a cancer biomarker: consensus and recommendations. Neoplasia 2009; 11: pp. 102-125.
16. Charles-Edwards E.M., deSouza N.M.: Diffusion-weighted magnetic resonance imaging and its application to cancer. Cancer Imaging 2006; 6: pp. 135-143.
17. Messiou C., Giles S., Collins D.J., et. al.: Assessing response of myeloma bone disease with diffusion-weighted MRI. Br J Radiol 2012; 85: pp. e1198-e1203.
18. Bonaffini P.A., Ippolito D., Casiraghi A., et. al.: Apparent diffusion coefficient maps integrated in whole-body MRI examination for the evaluation of tumor response to chemotherapy in patients with multiple myeloma. Acad Radiol 2015; 22: pp. 1163-1171.
19. Giles S.L., Messiou C., Collins D.J., et. al.: Whole-body diffusion-weighted MR imaging for assessment of treatment response in myeloma. Radiology 2014; 271: pp. 785-794.
20. Horger M., Weisel K., Horger W., et. al.: Whole-body diffusion-weighted MRI with apparent diffusion coefficient mapping for early response monitoring in multiple myeloma: preliminary results. AJR Am J Roentgenol 2011; 196: pp. W790-W795.
21. Rajkumar S.V., Dimopoulos M.A., Palumbo A., et. al.: International Myeloma Working Group updated criteria for the diagnosis of multiple myeloma. Lancet Oncol 2014; 15: pp. e538-e548.
22. Palumbo A., Rajkumar S.V., San Miguel J.F., et. al.: International Myeloma Working Group consensus statement for the management, treatment, and supportive care of patients with myeloma not eligible for standard autologous stem-cell transplantation. J Clin Oncol 2014; 32: pp. 587-600.
23. DeLong E.R., DeLong D.M., Clarke-Pearson D.L.: Comparing the areas under two or more correlated receiver operating characteristic curves: a nonparametric approach. Biometrics 1988; 44: pp. 837-845.
24. Dawson B., Trapp R.: Basic and clinical biostatistics.4th ed.2004.McGraw-Hill
25. Dutoit J.C., Verstraete K.L.: MRI in multiple myeloma: a pictorial review of diagnostic and post-treatment findings. Insights Imaging 2016; 7: pp. 553-569.
26. Bannas P., Hentschel H.B., Bley T.A., et. al.: Diagnostic performance of whole-body MRI for the detection of persistent or relapsing disease in multiple myeloma after stem cell transplantation. Eur Radiol 2012; 22: pp. 2007-2012.
27. Hillengass J., Ayyaz S., Kilk K., et. al.: Changes in magnetic resonance imaging before and after autologous stem cell transplantation correlate with response and survival in multiple myeloma. Haematologica 2012; 97: pp. 1757-1760.
28. Messiou C., Kaiser M.: Whole body diffusion weighted MRI–a new view of myeloma. Br J Haematol 2015; 171: pp. 29-37.
29. Harry V.N., Semple S.I., Gilbert F.J., et. al.: Diffusion-weighted magnetic resonance imaging in the early detection of response to chemoradiation in cervical cancer. Gynecol Oncol 2008; 111: pp. 213-220.
30. Hayashida Y., Yakushiji T., Awai K., et. al.: Monitoring therapeutic responses of primary bone tumors by diffusion-weighted image: initial results. Eur Radiol 2006; 16: pp. 2637-2643.
31. Lee K.C., Bradley D.A., Hussain M., et. al.: A feasibility study evaluating the functional diffusion map as a predictive imaging biomarker for detection of treatment response in a patient with metastatic prostate cancer to the bone. Neoplasia 2007; 9: pp. 1003-1011.
32. Cui Y., Zhang X.P., Sun Y.S., et. al.: Apparent diffusion coefficient: potential imaging biomarker for prediction and early detection of response to chemotherapy in hepatic metastases. Radiology 2008; 248: pp. 894-900.
33. Dutoit J.C., Vanderkerken M.A., Anthonissen J., et. al.: The diagnostic value of SE MRI and DWI of the spine in patients with monoclonal gammopathy of undetermined significance, smouldering myeloma and multiple myeloma. Eur Radiol 2014; 24: pp. 2754-2765.
34. Padhani A.R., Koh D.M., Collins D.J.: Whole-body diffusion-weighted MR imaging in cancer: current status and research directions. Radiology 2011; 261: pp. 700-718.