
Rationale and Objectives
The accurate delineation of tumor recurrence and its differentiation from radiation injury in the follow-up of adjuvantly treated high-grade gliomas presents a significant problem in neuro-oncology. The aim of this study was to investigate whether hemodynamic parameters derived from dynamic contrast-enhanced (DCE) T1-weighted magnetic resonance imaging (MRI) can be used to distinguish recurrent gliomas from radiation necrosis.
Materials and Methods
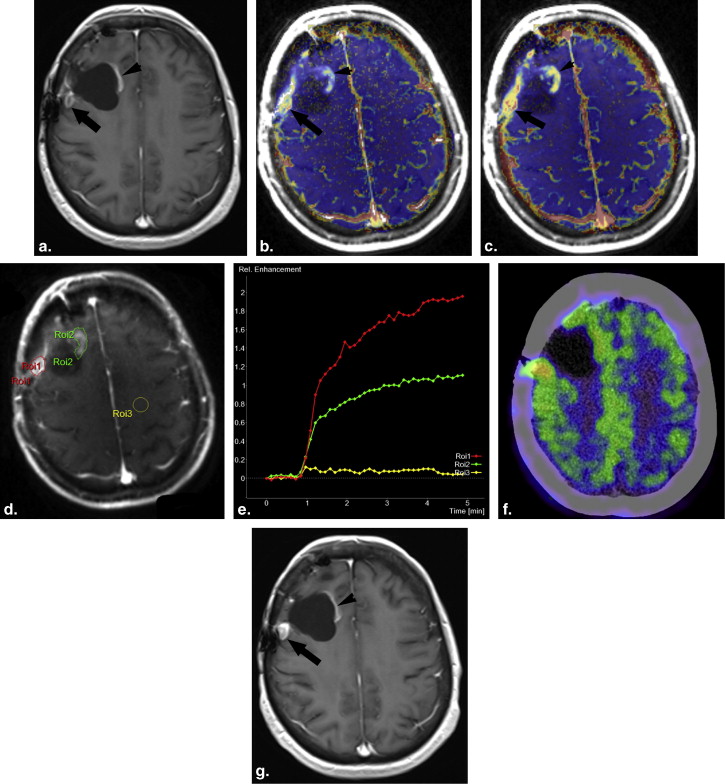
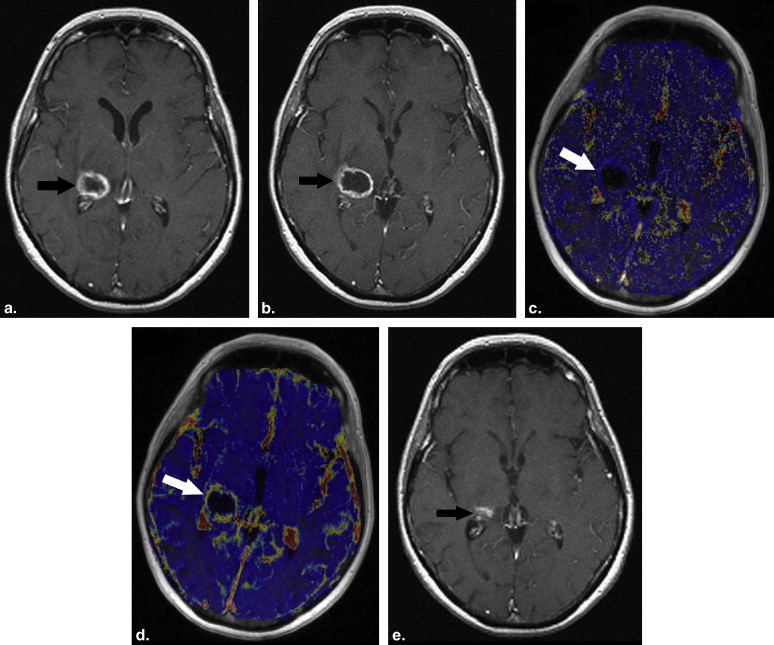
Eighteen patients who were being treated for glial neoplasms underwent prospectively conventional and DCE-MRI using a 3T scanner. The pharmacokinetic modelling was based on a two-compartment model that allows for the calculation of K trans (transfer constant between intra- and extravascular, extracellular space), v e (extravascular, extracellular space), k ep (transfer constant from the extracellular, extravascular space into the plasma), and iAUC (initial area under the signal intensity-time curve). Regions of interest (ROIs) were drawn around the entire recurrence-suspected contrast-enhanced region. A definitive diagnosis was established at subsequent surgical resection or clinicoradiologic follow-up. The hemodynamic parameters in the contralateral normal white matter, the radiation injury sites, and the tumor recurrent lesions were compared using nonparametric tests.
Results
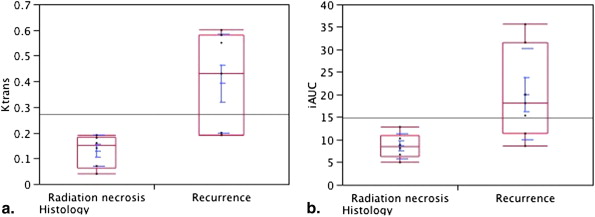
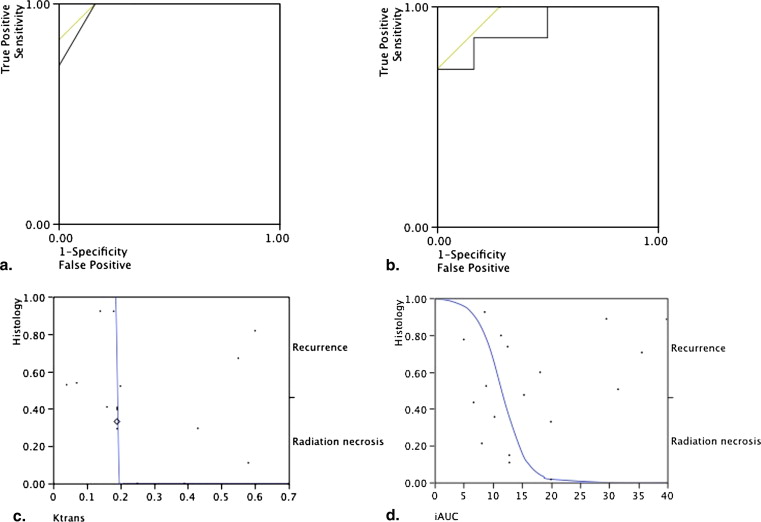
The K trans , v e , k ep , and iAUC values in the normal white matter were significantly different than those in the radiation necrosis and recurrent gliomas (0.01, < P < .0001). The only significantly different hemodynamic parameter between the recurrent tumor lesions and the radiation-induced necrotic sites were K trans and iAUC, which were significantly higher in the recurrent glioma group than in the radiation necrosis group ( P ≤ .0184). A K trans cutoff value higher than 0.19 showed 100% sensitivity and 83% specificity for detecting the recurrent gliomas, whereas an iAUC cutoff value higher than 15.35 had 71% sensitivity and 71% specificity. The v e and k ep values in recurrent tumors were not significantly higher than those in radiation-induced necrotic lesions.
Conclusions
These findings suggest that DCE-MRI may be used to distinguish between recurrent gliomas and radiation injury and thus, assist in follow-up patient management strategy.
Radiation necrosis is typically indistinguishable from recurrent gliomas at conventional contrast-enhanced magnetic resonance imaging (MRI). Both entities often manifest as a mass lesion with varying degrees of surrounding edema and progressive enhancement on serial MRI . However, at histopathologic examination, one finds that radiation necrosis and recurrent glioblastoma (GBM) are markedly dissimilar . Physiological imaging techniques, such as T2*-weighted dynamic susceptibility-weighted contrast material–enhanced (DSC) perfusion MRI, have substantially advanced the clinical use of MRI for differentiating the recurrent GMBs from the radiation necrosis. DSC perfusion MRI enables the following three hemodynamic measurements to be obtained within the brain: cerebral blood volume (CBV), peak height (PH), and percentage of signal intensity recovery (PSR) . Several publications have shown that DSC MRI measurements strongly correlate with primary glioma tumor vascular density and overall histopathologic grade . In other studies, DSC perfusion MRI has been applied to differentiate between a single brain metastasis and high-grade glioma, recurrent brain metastases from gamma knife–induced radiation necrosis, and to distinguish recurrent GBM from radiation necrosis after external beam radiation , though initial studies showed that many cases may have an indeterminate result .
Nevertheless, DSC perfusion MRI has a number of significant disadvantages . The paramagnetic recruitment effect leads to distortion of anatomy particularly where contrast lies within large vessels. Most T2- and T2*-weighted images will exhibit some degree of T1 sensitivity and will show signal changes resulting from relaxivity effects particularly from contrast agent that has leaked into the extravascular extracellular space. Thus, the use of contrast preenhancement or low T1 sensitivity-based sequences is prerequisite for a reliable dynamic imaging of enhancing brain lesions with blood-brain barrier disruption . More importantly, when considering application to tumors, the effects of extravascular leakage of contrast material on the T2 or T2* signal are difficult to quantify and, although estimates of contrast transfer coefficient can be made these are less reliable than those obtained with comparable dynamic T1-weighted contrast-enhanced MRI (DCE-MRI) . Therefore, DCE-MRI is primarily recommended for pharmacodynamic assessment of antiangiogenic and antivascular therapies .
Get Radiology Tree app to read full this article<
Materials and methods
Patients
Get Radiology Tree app to read full this article<
MRI
Get Radiology Tree app to read full this article<
Image Processing and Analysis
Get Radiology Tree app to read full this article<
Statistical Analysis
Get Radiology Tree app to read full this article<
Results
Get Radiology Tree app to read full this article<
Get Radiology Tree app to read full this article<
Get Radiology Tree app to read full this article<
Table 1
DCE-MRI Measurements in the Two Examined Groups
Final Diagnosis_K_ trans v e k ep iAUC Radiation necrosis ( n = 6) 0.15 ∗ (0.04–0.19) 0.34 ¶ (0.15–0.43) 0.34° (0.2–0.6) 8.48 † (5–12.84) Recurrent tumor ( n = 12) 0.43 ∗ (0.19–0.6) 0.56 ‡ (0.27–0.8) 0.45 ¶ (0.26–1.23) 18.13 † (8.6–35.62)
The statistical significance ( P value) of the differences (Wilcoxon rank-sum test) of the microcirculatory parameters between the two groups are annotated.
Measurement units: K trans (min −1 ), k ep (min −1 ), v e (%), iAUC (mM×s).
Get Radiology Tree app to read full this article<
Get Radiology Tree app to read full this article<
Get Radiology Tree app to read full this article<
Get Radiology Tree app to read full this article<
Get Radiology Tree app to read full this article<
Discussion
Get Radiology Tree app to read full this article<
Get Radiology Tree app to read full this article<
Get Radiology Tree app to read full this article<
Get Radiology Tree app to read full this article<
Get Radiology Tree app to read full this article<
Get Radiology Tree app to read full this article<
Get Radiology Tree app to read full this article<
Get Radiology Tree app to read full this article<
References
1. Curnes J.T., Laster D.W., Ball M.R., et. al.: MRI of radiation injury to the brain. AJR Am J Roentgenol 1986; 147: pp. 119-124.
2. Hopewell J.W., Calvo W., Jaenke R., et. al.: Microvasculature and radiation damage. Recent Results Cancer Res 1993; 130: pp. 1-16.
3. Lupo J.M., Cha S., Chang S.M., et. al.: Dynamic susceptibility-weighted perfusion imaging of high-grade gliomas: characterization of spatial heterogeneity. AJNR Am J Neuroradiol 2005; 26: pp. 1446-1454.
4. Maia A.C., Malheiros S.M., da Rocha A.J., et. al.: MR cerebral blood volume maps correlated with vascular endothelial growth factor expression and tumor grade in nonenhancing gliomas. AJNR Am J Neuroradiol 2005; 26: pp. 777-783.
5. Cha S., Lupo J.M., Chen M.H., et. al.: Differentiation of glioblastoma multiforme and single brain metastasis by peak height and percentage of signal intensity recovery derived from dynamic susceptibility-weighted contrast-enhanced perfusion MR imaging. AJNR Am J Neuroradiol 2007; 28: pp. 1078-1084.
6. Barajas R.F., Chang J.S., Sneed P.K., et. al.: Distinguishing recurrent intra-axial metastatic tumor from radiation necrosis following gamma knife radiosurgery using dynamic susceptibility-weighted contrast-enhanced perfusion MR imaging. AJNR Am J Neuroradiol 2009; 30: pp. 367-372.
7. Barajas R.F., Chang J.S., Segal M.R., et. al.: Differentiation of recurrent glioblastoma multiforme from radiation necrosis after external beam radiation therapy with dynamic susceptibility-weighted contrast-enhanced perfusion MR imaging. Radiology 2009; 253: pp. 486-496.
8. Al Sayyari A., Buckley R., McHenery C., et. al.: Distinguishing recurrent primary brain tumor from radiation injury: a preliminary study using a susceptibility-weighted MR imaging-guided apparent diffusion coefficient analysis strategy. AJNR Am J Neuroradiol 2010; 31: pp. 1049-1054.
9. Cha S., Knopp E.A., Johnson G., et. al.: Dynamic contrast-enhanced T2-weighted MR imaging of recurrent malignant gliomas treated with thalidomide and carboplatin. AJNR Am J Neuroradiol 2000; 21: pp. 881-890.
10. Calamante F., Gadian D.G., Connelly A.: Delay and dispersion effects in dynamic susceptibility contrast MRI: simulations using singular value decomposition. Magn Reson Med 2000; 44: pp. 466-473.
11. Thacker N.A., Scott M.L., Jackson A.: Can dynamic susceptibility contrast magnetic resonance imaging perfusion data be analyzed using a model based on directional flow?. J Magn Reson Imaging 2003; 17: pp. 241-255.
12. Kassner A., Annesley D.J., Zhu X.P., et. al.: Abnormalities of the contrast re-circulation phase in cerebral tumors demonstrated using dynamic susceptibility contrast-enhanced imaging: a possible marker of vascular tortuosity. J Magn Reson Imaging 2000; 11: pp. 103-113.
13. Weisskoff R.M., Zuo C.S., Boxerman J.L., et. al.: Microscopic susceptibility variation and transverse relaxation: theory and experiment. Magn Reson Med 1994; 31: pp. 601-610.
14. Leach M.O., Brindle K.M., Evelhoch J.L., et. al.: The assessment of antiangiogenic and antivascular therapies in early-stage clinical trials using magnetic resonance imaging: issues and recommendations. Br J Cancer 2005; 92: pp. 1599-1610.
15. Hein P.A., Eskey C.J., Dunn J.F., et. al.: Diffusion-weighted imaging in the follow-up of treated high-grade gliomas: tumor recurrence versus radiation injury. AJNR Am J Neuroradiol 2004; 25: pp. 201-209.
16. Van Laere K., Ceyssens S., Van Calenbergh F., et. al.: Direct comparison of 18F-FDG and 11C-methionine PET in suspected recurrence of glioma: sensitivity, inter-observer variability and prognostic value. Eur J Nucl Med Mol Imaging 2005; 32: pp. 39-51.
17. Tofts P.S., Kermode A.G.: Measurement of the blood-brain barrier permeability and leakage space using dynamic MR imaging. 1. Fundamental concepts. Magn Reson Med 1991; 17: pp. 357-367.
18. Zwick S., Brix G., Tofts P.S., et. al.: Simulation-based comparison of two approaches frequently used for dynamic contrast-enhanced MRI. Eur Radiol 2010; 20: pp. 432-442.
19. Li X., Lu Y., Pirzkall A., et. al.: Analysis of the spatial characteristics of metabolic abnormalities in newly diagnosed glioma patients. J Magn Reson Imaging 2002; 16: pp. 229-237.
20. Oh B.C., Pagnini P.G., Wang M.Y., et. al.: Stereotactic radiosurgery: adjacent tissue injury and response after high-dose single fraction radiation: part I—histology, imaging, and molecular events. Neurosurgery 2007; 60: pp. 31-44. discussion 44–35
21. Wesseling P., Ruiter D.J., Burger P.C.: Angiogenesis in brain tumors; pathobiological and clinical aspects. J Neurooncol 1997; 32: pp. 253-265.
22. Sugahara T., Korogi Y., Kochi M., et. al.: Correlation of MR imaging-determined cerebral blood volume maps with histologic and angiographic determination of vascularity of gliomas. AJR Am J Roentgenol 1998; 171: pp. 1479-1486.
23. Hazle J.D., Jackson E.F., Schomer D.F., et. al.: Dynamic imaging of intracranial lesions using fast spin-echo imaging: differentiation of brain tumors and treatment effects. J Magn Reson Imaging 1997; 7: pp. 1084-1093.
24. Ludemann L., Wurm R., Zimmer C.: Pharmacokinetic modeling of Gd-DTPA extravasation in brain tumors. Invest Radiol 2002; 37: pp. 562-570.
25. Cha S., Yang L., Johnson G., et. al.: Comparison of microvascular permeability measurements, K(trans), determined with conventional steady-state T1-weighted and first-pass T2*-weighted MR imaging methods in gliomas and meningiomas. AJNR Am J Neuroradiol 2006; 27: pp. 409-417.
26. Larsson H.B., Courivaud F., Rostrup E., et. al.: Measurement of brain perfusion, blood volume, and blood-brain barrier permeability, using dynamic contrast-enhanced T(1)-weighted MRI at 3 tesla. Magn Reson Med 2009; 62: pp. 1270-1281.
27. Jackson A., Haroon H., Zhu X.P., et. al.: Breath-hold perfusion and permeability mapping of hepatic malignancies using magnetic resonance imaging and a first-pass leakage profile model. NMR Biomed 2002; 15: pp. 164-173.
28. Zhu X.P., Li K.L., Kamaly-Asl I.D., et. al.: Quantification of endothelial permeability, leakage space, and blood volume in brain tumors using combined T1 and T2* contrast-enhanced dynamic MR imaging. J Magn Reson Imaging 2000; 11: pp. 575-585.
29. Brix G., Kiessling F., Lucht R., et. al.: Microcirculation and microvasculature in breast tumors: pharmacokinetic analysis of dynamic MR image series. Magn Reson Med 2004; 52: pp. 420-429.
30. Jain R.K.: Transport of molecules in the tumor interstitium: a review. Cancer Res 1987; 47: pp. 3039-3051.
31. Pellerin M., Yankeelov T.E., Lepage M.: Incorporating contrast agent diffusion into the analysis of DCE-MRI data. Magn Reson Med 2007; 58: pp. 1124-1134.
32. Brandsma D., Stalpers L., Taal W., et. al.: Clinical features, mechanisms, and management of pseudoprogression in malignant gliomas. Lancet Oncol 2008; 9: pp. 453-461.
33. Mills S.J., Soh C., O’Connor J.P., et. al.: Enhancing fraction in glioma and its relationship to the tumoral vascular microenvironment: a dynamic contrast-enhanced MR imaging study. AJNR Am J Neuroradiol 2010; 31: pp. 726-731.
34. Sugahara T., Korogi Y., Tomiguchi S., et. al.: Posttherapeutic intraaxial brain tumor: the value of perfusion-sensitive contrast-enhanced MR imaging for differentiating tumor recurrence from nonneoplastic contrast-enhancing tissue. AJNR Am J Neuroradiol 2000; 21: pp. 901-909.