
Rationale and Objectives
Abdominal aortic calcification (AAC) can be quantified using computed tomography (CT), but imaging planes are prescribed based on bony landmarks, so that individual variation between the landmark and the aortoiliac junction can result in variable aortic coverage. In the Framingham CT substudy, we scanned a 15-cm (Z-direction) abdominal segment cranial to the S1 vertebral body. We sought to determine the range and distribution of length of aorta scanned and the distribution of AAC within the abdominal aorta and to compare burden of AAC measured from fixed-length segments versus AAC from all slices cranial to the aortoiliac bifurcation.
Materials and Methods
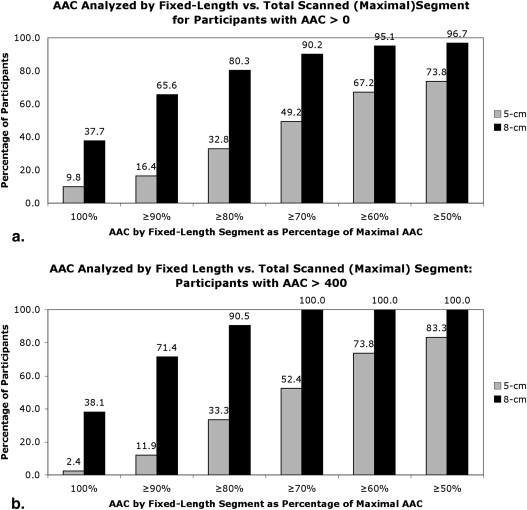
AAC was quantified by modified Agatston score (AS) in 100 Framingham Heart Study participants (60 ± 13 years old, 51 men). We compared the AS measured from 5-cm and 8-cm segments with the AS ALL (total visualized aorta).
Results
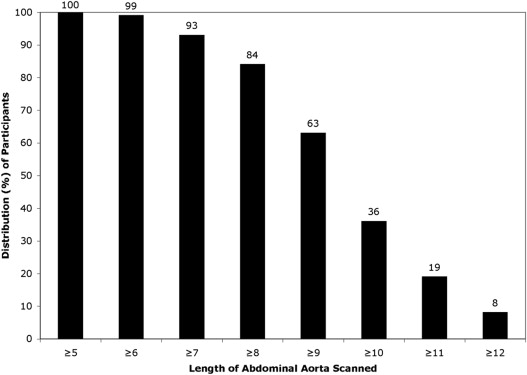
Of 100, 73 participants had AAC >0. The total length of aorta imaged was ≥8 cm in 84% of participants. Qualitatively, 5-cm and 8-cm segments correctly identified 96% and 99%, respectively, of participants as having or not having AAC. Quantitatively, AS 8cm was within 20% of AS ALL in four-fifths and within 30% of AS ALL in nine-tenths of participants. AS 5cm more severely underestimated AS ALL .
Conclusion
The use of S1 as the caudal imaging landmark in a 15-cm slab yields ≥8 cm aortic coverage in most adults. Both 5-cm and 8-cm analysis strategies are comparable to analyzing the total visualized abdominal aorta for prevalent AAC, but only 8-cm segment analysis yields quantitatively similar measures of AAC.
Abdominal aortic calcification (AAC) is associated with increased burden of cardiovascular morbidity and mortality and may be a predictor of future adverse cardiovascular disease events . Autopsy and imaging studies suggest that the prevalence of abdominal aortic atherosclerosis, including calcified aortic plaques, generally is greatest at the bifurcation of the abdominal aorta, with decreasing burden of atherosclerosis at a greater distance from the aortic bifurcation. Computed tomography (CT) allows quantitative measurement of AAC, an index of atherosclerosis burden, but there is no standard method for CT-based assessment of AAC. Although it clearly is desirable to scan comparable segments of abdominal aorta across individuals for purpose of comparisons, in practice this can be challenging since the aorta is not well visualized on CT scout images. CT imaging planes for the abdominal aorta are most commonly prescribed based on bony (vertebral) landmarks, but there can be individual variation between the level of the aortoiliac bifurcation and any given vertebral landmark, thus resulting in variable-length coverage of the abdominal aorta. The need to minimize radiation exposure creates an “overcoverage” strategy (ie, imaging a longer segment of the abdomen than likely to be needed) impractical.
In the Framingham CT substudy, a 15-cm extent in the Z (cranial-caudal) direction was prespecified for abdominal imaging. The slab was prescribed so that the S1 vertebral body delineated the caudalmost extent of imaging. S1 was selected as the lower end point to avoid irradiation of pelvic organs, as some study participants were women of childbearing age. This protocol provided views of the lower abdominal aorta and the upper portions of the iliac arteries. The purposes of this study were to determine the lengths of abdominal aorta imaged and to assess the effect of various analysis schemes (fixed and variable-length segments of abdominal aorta) on quantitative calcium burden. We hypothesized that AAC within the imaged portion of abdominal aorta tends to be concentrated caudally, based on autopsy and imaging literature, and that fixed and variable-length segment measurement methods may yield comparable quantitative results.
Materials and methods
Get Radiology Tree app to read full this article<
Study Sample
Get Radiology Tree app to read full this article<
CT Imaging Protocol
Get Radiology Tree app to read full this article<
Image Analysis Protocol
Get Radiology Tree app to read full this article<
Data and Statistical Analyses
Get Radiology Tree app to read full this article<
Results
Get Radiology Tree app to read full this article<
Table 1
Baseline Characteristics of the Study Sample
Men Women Men (All) Women (All) No. 51 49 1625 1914 Age, y 60 ± 13 61 ± 13 62 ± 10 61 ± 10 Body mass index, kg/m 2 28.7 ± 4.3 26.7 ± 4.7 28.8 ± 4.6 27.7 ± 5.9 Hypertension 42% 35% 49% 44% Dyslipidemia 22% 8.3% 25% 18% Current smoking 12% 12.5% 13% 14% Diabetes mellitus 16% 4.2% 14% 9%
ALL refers to all Framingham Offspring cohort members participating in the cycle 7 examination.
Get Radiology Tree app to read full this article<
Get Radiology Tree app to read full this article<
Get Radiology Tree app to read full this article<
Get Radiology Tree app to read full this article<
Get Radiology Tree app to read full this article<
Discussion
Get Radiology Tree app to read full this article<
Comparison with the Current Literature
Get Radiology Tree app to read full this article<
Get Radiology Tree app to read full this article<
Implications for Research
Get Radiology Tree app to read full this article<
Get Radiology Tree app to read full this article<
Clinical Implications
Get Radiology Tree app to read full this article<
Get Radiology Tree app to read full this article<
Get Radiology Tree app to read full this article<
Limitations
Get Radiology Tree app to read full this article<
Conclusions
Get Radiology Tree app to read full this article<
Get Radiology Tree app to read full this article<
Get Radiology Tree app to read full this article<
References
1. Wilson P.W., Kauppila L.I., O’Donnell C.J., et. al.: Abdominal aortic calcific deposits are an important predictor of vascular morbidity and mortality. Circulation 2001; 103: pp. 1529-1534.
2. Witteman J.C., Kok F.J., van Saase J.L., et. al.: Aortic calcification as a predictor of cardiovascular mortality. Lancet 1986; 2: pp. 1120-1122.
3. Wong N.D., Lopez V.A., Allison M., et. al.: Abdominal aortic calcium and multi-site atherosclerosis: the Multiethnic Study of Atherosclerosis. Atherosclerosis 2011; 214: pp. 436-441.
4. van der Meer I.M., Bots M.L., Hofman A., et. al.: Predictive value of noninvasive measures of atherosclerosis for incident myocardial infarction: the Rotterdam Study. Circulation 2004; 109: pp. 1089-1094.
5. Bastos Gonçalves F., Voûte M.T., Hoeks S.E., et. al.: Calcification of the abdominal aorta as an independent predictor of cardiovascular events: a meta-analysis. Heart 2012; 98: pp. 988-994.
6. Nguyen N.D., Haque A.K.: Effect of hemodynamic factors on atherosclerosis in the abdominal aorta. Atherosclerosis 1990; 84: pp. 33-39.
7. Kauppila L.I., Polak J.F., Cupples L.A., et. al.: New indices to classify location, severity and progression of calcific lesions in the abdominal aorta: a 25-year follow-up study. Atherosclerosis 1997; 132: pp. 245-250.
8. Honkanen E., Kauppila L., Wikström B., et. al., CORD study group: Abdominal aortic calcification in dialysis patients: results of the CORD study. Nephrol Dial Transplant 2008; 23: pp. 4009-4015.
9. Kannel W.B., Feinleib M., McNamara P.M., et. al.: An investigation of coronary heart disease in families. The Framingham Offspring Study. Am J Epidemiol 1979; 110: pp. 281-290.
10. Splansky G.L., Corey D., Yang Q., et. al.: The Third Generation Cohort of the National Heart, Lung, and Blood Institute’s Framingham Heart Study: design, recruitment, and initial examination. Am J Epidemiol 2007; 165: pp. 1328-1335.
11. Chuang M.L., Massaro J.M., Levitzky Y.S., et. al.: Prevalence and distribution of abdominal aortic calcium by gender and age group in a community-based cohort (from the Framingham Heart Study). Am J Cardiol 2012; 110: pp. 891-896.
12. Hoffmann U., Massaro J.M., Fox C.S., et. al.: Defining normal distributions of coronary artery calcification in at-risk community-based men and women: the Framingham Heart Study. Am J Cardiol 2008; 102: pp. 1136-1141.
13. Hong C., Bae K.T., Pilgram T.K.: Coronary artery calcium: accuracy and reproducibility of measurements with multi-detector row CT–assessment of effects of different thresholds and quantification methods. Radiology 2003; 227: pp. 795-801.
14. Agatston A.S., Janowitz W.R., Hildner F.J., et. al.: Quantification of coronary artery calcium using ultrafast computed tomography. J Am Coll Cardiol 1990; 15: pp. 827-832.
15. Davila J.A., Johnson C.D., Behrenbeck T.R., et. al.: Assessment of cardiovascular risk status at CT colonography. Radiology 2006; 240: pp. 110-115.
16. Jackson Heart Study (JHS) Manual 8: CT scan site manual of operations, Version 1.0 January 12, 2007. jhs.jsums.edu/jhsinfo/…/Manual%208_CT_01-30-2007%20(1).pdf Accessed July 3, 2012.
17. Criqui M.H., Kamineni A., Allison M.A., et. al.: Risk factor differences for aortic versus coronary calcified atherosclerosis: the Multi-Ethnic Study of Atherosclerosis. Arterioscler Thromb Vasc Biol 2010; 30: pp. 2289-2296.