
Rationale and Objectives
To explore whether the sarcopenia body type can help predict response to interleukin-2 (IL-2) therapy in metastatic renal cell carcinoma (RCC).
Materials and Methods
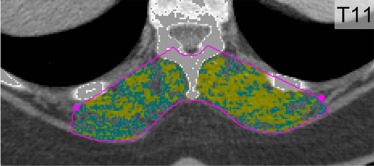
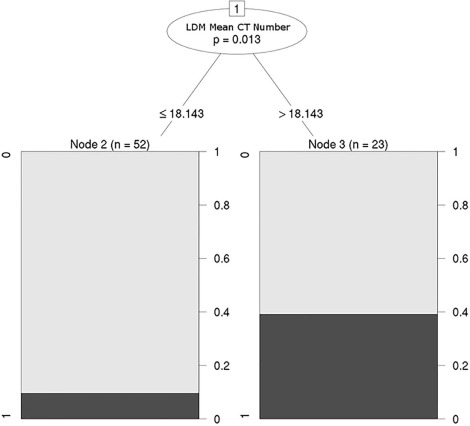
Institutional review board approval was obtained for this Health Insurance Portability and Accountability Act-compliant retrospective cohort study of 75 subjects with metastatic RCC who underwent pretreatment contrast-enhanced computed tomography within 1 year of initiating IL-2 therapy. Cross-sectional area and attenuation of normal-density (31–100 Hounsfield units [HU]) and low-density (0–30 HU) dorsal muscles were obtained at the T11 vertebral level. The primary outcome was partial or complete response to IL-2 using RECIST 1.1 criteria at 6 weeks. A conditional inference tree was used to determine an optimal HU cutoff for predicting outcome. Bonferroni-adjusted multivariate logistic regression was conducted to investigate the independent associations between imaging features and response after controlling for demographics, doses of IL-2, and RCC prognostic scales (eg, Heng and the Memorial Sloan Kettering Cancer Center [MSKCC]).
Results
Most subjects had intermediate prognosis by Heng (65% [49 of 75]) and the MSKCC (63% [47 of 75]) criteria; 7% had complete response and 12% had partial response. Mean attenuation of low-density dorsal muscles was a significant univariate predictor of IL-2 response after Bonferroni correction ( P = 0.03). The odds of responding to treatment were 5.8 times higher for subjects with higher-attenuation low-density dorsal muscles (optimal cutoff: 18.1 HU). This persisted in multivariate analysis ( P = 0.02). Body mass index ( P = 0.67) and the Heng ( P = 0.22) and MSKCC ( P = 0.08) clinical prognostic scales were not significant predictors of response.
Conclusions
Mean cross-sectional attenuation of low-density dorsal muscles (ie, sarcopenia) may predict IL-2 response in metastatic RCC. Clinical variables are poor predictors of response.
Introduction
Sarcopenia is a recently explored body type that is diagnosable by data routinely acquired with computed tomography (CT) and is associated with a range of negative outcomes including the following: postoperative infectious and noninfectious complications , mortality following liver transplantation , adrenocortical carcinoma mortality , and truncated disease-free survival in stage III melanoma managed with systemic interleukin-2 (IL-2) , among others . In short, sarcopenia is the combination of low core muscle volume and density—characterized by diminutive psoas and dorsal muscles—and high core muscle adiposity. Sarcopenia has been shown repeatedly to outperform common clinical markers of general health such as age and body mass index in predicting patient outcomes .
Sarcopenia has been shown to be prognostic in stage III melanoma and predictive of response to ipilimumab in stage IV melanoma . We were interested to know whether the sarcopenia body type also could be used to predict outcome in patients with metastatic renal cell carcinoma (RCC) treated with IL-2, as both melanoma and RCC are responsive to immunotherapies . A small subset (7%–8%) of patients with metastatic RCC treated with IL-2 experience a complete response to therapy that tends to be durable , with some patients alive and without disease for more than 10 years. However, the majority of patients do not respond at all, and reliable pretreatment prediction of which patients are most likely to benefit using clinical criteria has been elusive. Because of the high cost, potential toxicity, and low response rate (~20%) associated with IL-2 therapy, sparing patients from therapy who are least likely to benefit is desirable .
Get Radiology Tree app to read full this article<
Methods
Get Radiology Tree app to read full this article<
Subjects
Get Radiology Tree app to read full this article<
TABLE 1
Patient Demographic Data
Characteristic All Subjects ( n = 75) Median age (years) 54 (IQR: 50–58) Male 51 (67%) Body mass index (kg/m 2 ) 29 (IQR: 26–33) Systemic therapy prior to IL-2 (all single agent) 8 (11%) Days from RCC diagnosis to first IL-2 12 (IQR: 4–45) Days from CT to first IL-2 dose 24 (IQR: 12–35) Total IL-2 doses out of 28 possible 13 (IQR: 10–16) Response at 6 weeks by RECIST 1.1 Any response 14 (19%) Complete response 5 (7%) Partial response 9 (12%) Progression 40 (53%) Stable disease 21 (28%) Overall subject health Karnofsky performance status 100 (IQR: 90–100) Charlson comorbidity index 8 (IQR: 8–9) RCC Fuhrman nuclear grade 3 (IQR: 3–4) Distribution of metastatic disease Lung 65 (87%) Liver 12 (16%) Renal/nephrectomy bed 22 (29%) Adrenal 11 (14%) Other abdominal 13 (17%) Bone 13 (17%) Central nervous system 1 (1%) Other nonabdominal 5 (7%) MSKCC prognostic score High (worst prognosis) 3 (4%) Intermediate 47 (63%) Low (best prognosis) 25 (33%) Heng prognostic score High (worst prognosis) 6 (8%) Intermediate 50 (66%) Low (best prognosis) 19 (26%)
CT, computed tomography; IL-2, interleukin-2; MSKCC, Sloan Kettering Cancer Center; RCC, renal cell carcinoma; RECIST, Response Evaluation in Solid Tumors.
Continuous variables are presented as medians and interquartile ranges (IQR).
Get Radiology Tree app to read full this article<
Imaging and Patient-Level Data
Get Radiology Tree app to read full this article<
Interleukin-2 Therapy
Get Radiology Tree app to read full this article<
CT Morphomics
Get Radiology Tree app to read full this article<
Get Radiology Tree app to read full this article<
Get Radiology Tree app to read full this article<
Treatment Response
Get Radiology Tree app to read full this article<
Statistical Analysis
Get Radiology Tree app to read full this article<
Get Radiology Tree app to read full this article<
Get Radiology Tree app to read full this article<
Results
Subject Data
Get Radiology Tree app to read full this article<
CT Data
Get Radiology Tree app to read full this article<
TABLE 2
CT Examination Parameters
Characteristic All Subjects ( n = 75) Year of CT 2000–2002 7 (9%) 2003–2005 14 (18%) 2006–2008 19 (25%) 2009–2011 15 (20%) 2012–2014 20 (28%) CT scanner Aquilion 2 (4%) Brilliance 64 1 (1%) Discovery HD750 16 (21%) Emotion 16 1 (1%) Genesis HiSpeed 3 (4%) LightSpeed Power 1 (1%) LightSpeed Pro 16 8 (11%) LightSpeed QX/i 5 (7%) LightSpeed Ultra 15 (20%) LightSpeed VCT 15 (20%) LightSpeed 16 6 (8%) SOMATOM Definition 2 (3%) kVp 120 74 (99%) 110 1 (1%) Tube current (mAs) 288 ± 112 Slice thickness 1.25 mm 5 (7%) 2.5 mm 4 (5%) 3 mm 3 (4%) 5 mm 59 (79%) 7.5 mm 3 (4%) 10 mm 1 (1%) Contrast material Noncontrast 0 (0%) 300 mgI/mL 56 (75%) 320 mgI/mL 9 (12%) 370 mgI/mL 2 (3%) Unknown 8 (11%) Contrast dose (mL) mL 119 ± 21 mgI 36,408 ± 6,584
CT, computed tomography.
Get Radiology Tree app to read full this article<
Get Radiology Tree app to read full this article<
TABLE 3
Population-Level Morphomics Data (Median, Interquartile Range) Assessed on a Single Axial Image at the T11 Vertebral Body Level
Morphometric Characteristic Any Response ( n = 14) No Response ( n = 61) Mean CT number of low-density dorsal muscles 18.3 (17.5–18.6) HU 17.3 (16.5–18.1) HU Cross-sectional area of low-density dorsal muscles 684 (389–899) mm 2 726 (399-1,001) mm 2 Mean CT number of normal-density dorsal muscles 59 (56–62) HU 60 (56–62) HU Cross-sectional area of normal-density dorsal muscles 2,786 (2,786–3,648) mm 2 2,347 (1,927–2,950) mm 2 Mean CT number of visceral fat −94 (−91 to −100) HU −100 (−90 to −105) HU Cross-sectional area of visceral fat 8,860 (3,050–11,744) mm 2 7,284 (5,350–14,253) mm 2 Mean CT number of subcutaneous fat −103 (−101 to −108) HU −105 (−101 to −109) HU Cross-sectional area of subcutaneous fat 8,887 (6,470–12,093) mm 2 12,295 (6,452–16,911) mm 2 Total body circumference 1,002 (935–1,039) mm 1,015 (972−1,088) mm Total body area 76,767 (65,873–82,193) mm 2 79,634 (72,279–90,943) mm 2
CT, computed tomography; HU, Hounsfield units.
Low density, 0 to 30 Hounsfield units; Normal density, 31 to 100 Hounsfield units.
Get Radiology Tree app to read full this article<
Univariate and Multivariate Analyses
Get Radiology Tree app to read full this article<
TABLE 4
Variables Tested in the Univariate and Multivariate Analyses
Predictor Univariate P Value Multivariate P Value Demographics Sex 0.68 Age 0.79 Body mass index 0.67 Clinical information Total number of IL-2 doses 0.08 0.10 MSKCC prognostic score 0.15 0.08 Heng prognostic score 0.22 Morphomics data Mean CT number in low-density dorsal muscles 0.03 0.02 Cross-sectional area of normal-density dorsal muscles 0.08 Mean CT number of visceral fat 0.11 Cross-sectional area of visceral fat 0.17 Cross-sectional area of subcutaneous fat 0.20 Mean CT number of subcutaneous fat 0.46
CT, computed tomography; IL-2, interleukin 2; MSKCC, Memorial Sloan Kettering Cancer Center.
Low density, 0 to 30 Hounsfield units; normal density, 31 to 100 Hounsfield units.
CT morphomics measurements were made on axial CT images at the T11 vertebral body level.
Get Radiology Tree app to read full this article<
Get Radiology Tree app to read full this article<
Discussion
Get Radiology Tree app to read full this article<
Get Radiology Tree app to read full this article<
Get Radiology Tree app to read full this article<
Get Radiology Tree app to read full this article<
Get Radiology Tree app to read full this article<
Compliance with Ethical Standards
Get Radiology Tree app to read full this article<
Get Radiology Tree app to read full this article<
References
1. Fearon K., Strasser F., Anker S.D., et. al.: Definition and classification of cancer cachexia: an international consensus. Lancet Oncol 2011; 12: pp. 489-495.
2. Lee J.S., He K., Harbaugh C.M., et. al.: Frailty, core muscle size, and mortality in patients undergoing open abdominal aortic aneurysm repair. J Vasc Surg 2011; 53: pp. 912-917.
3. Englesbe M.J., Patel S.P., He K., et. al.: Sarcopenia and mortality after liver transplantation. J Am Coll Surg 2010; 211: pp. 271-278.
4. Englesbe M.J., Terjimanian M.N., Less J.S., et. al.: Morphometric age and surgical risk. J Am Coll Surg 2013; 216: pp. 976-985.
5. Englesbe M., Less J.S., He K., et. al.: Analytic morphomics, core muscle size, and surgical outcomes. Ann Surg 2012; 256: pp. 255-261.
6. Canvasser L.D., Mazurek A.A., Cron D.C., et. al.: Paraspinous muscle as a predictor of surgical outcome. J Surg Res 2014; 192: pp. 76-81.
7. Lee C.S., Cron D.C., Terjimanian M.N., et. al.: Dorsal muscle group area and surgical outcomes in liver transplantation. Clin Transplant 2014; 28: pp. 1092-1098.
8. Miller B.S., Ignatoski K.M., Daignault S., et. al.: Worsening central sarcopenia and increasing intra-abdominal fat correlate with decreased survival in patients with adrenocortical carcinoma. World J Surg 2012; 36: pp. 1509-1516.
9. Sabel M.S., Lee J., Cai S., et. al.: Sarcopenia as a prognostic factor among patients with stage III melanoma. Ann Surg Oncol 2011; 18: pp. 3579-3585.
10. Lang T., Streeper T., Cawthon P., et. al.: Sarcopenia: etiology, clinical consequences, intervention, and assessment. Osteoporos Int 2010; 21: pp. 543-559.
11. Miljkovic I., Kuipers A.L., Cauley J.A., et. al.: Greater skeletal muscle fat infiltration is associated with higher all-cause and cardiovascular mortality in older men. J Gerontol A Biol Sci Med Sci 2015; 70: pp. 1133-1140.
12. Anandavadivelan P., Brismar T.B., Nilsson M., et. al.: Sarcopenic obesity: a probable risk factor for dose limiting toxicity during neo-adjuvant chemotherapy in oesophageal cancer patients. Clin Nutr 2016; 35: pp. 724-730.
13. Aust S., Knogler T., Pils D., et. al.: Skeletal muscle depletion and markers for cancer cachexia are strong prognostic factors in epithelial ovarian cancer. PLoS ONE 2015;
14. Grossberg A.J., Chamchod S., Fuller C.D., et. al.: Association of body composition with survival and locoregional control of radiotherapy-treated head and neck squamous cell carcinoma. JAMA Oncol 2016; 2: pp. 782-789.
15. Tandon P., Ney M., Irwin I., et. al.: Severe muscle depletion in patients on the liver transplant wait list: its prevalence and independent prognostic value. Liver Transpl 2012; 18: pp. 1209-1216.
16. Sabel M.S., Lee J., Wang A., et. al.: Morphomics predicts response to ipilimumab in patients with stage IV melanoma. J Surg Oncol 2015; 112: pp. 333-337.
17. Schafer A.L., Vittinghoff E., Lang T.F., et. al.: Fat infiltration of muscle, diabetes, and clinical fracture risk in older adults. J Clin Endocrinnol Metab 2010; 95: pp. E368-E372.
18. Stenehjem D.D., Toole M., Merriman J., et. al.: Extension of overall survival beyond objective responses in patients with metastatic renal cell carcinoma treated with high-dose interleukin-2. Cancer Immunol Immunother 2016;
19. Hanzly M., Aboumohamed A., Yarlagadda N., et. al.: High-dose interleukin-2 therapy for metastatic renal cell carcinoma: a contemporary experience. Urology 2014; 83: pp. 1129-1134.
20. Klapper J.A., Downey S.G., Smith F.O., et. al.: High-dose interleukin-2 for the treatment of metastatic renal cell carcinoma. Cancer 2008; 113: pp. 293-301.
21. McDermott D.F., Cheng S.C., Signoretti S., et. al.: The high-dose aldesluekin “select” trial: a trial to prospectively validate predictive models of response to treatment in patients with metastatic renal cell carcinoma. Clin Cancer Res 2015; 21: pp. 561-568.
22. Upton M.P., Parker R.A., Youmans A., et. al.: Histologic predictors of renal cell carcinoma response to interleukin-2-based therapy. J Immunother 2005; 28: pp. 488-495.
23. Motzer R.J., Mazumdar M., Bacik J., et. al.: Survival and prognostic stratification of 670 patients with advanced renal cell carcinoma. J Clin Oncol 1999; 17: pp. 2530-2540.
24. Goodpaster B.H., Kelley D.E., Wing R.R., et. al.: Effects of weight loss on regional fat distribution and insulin sensitivity in obesity. Diabetes 1999; 48: pp. 839-847.
25. Goodpaster B.H., Thaete F.L., Kelley D.E.: Skeletal muscle composition evaluated with computed tomography. Ann NY Acad Sci 2000; 904: pp. 18-24.
26. Goodpaster B.H., Kelley D.E., Thaete F.L., et. al.: Skeletal muscle attenuation determined by computed tomography is associated with skeletal muscle lipid content. J Appl Physiol 2000; 89: pp. 104-110.
27. Zoico E., Rossi A., De Francesco V., et. al.: Adipose tissue infiltration in skeletal muscle of healthy, elderly men: relationships with body composition, insulin resistance and inflammation at the systemic and tissue level. J Gerontol A Biol Sci Med Sci 2010; 65: pp. 295-299.
28. Eisenhauer E.A., Therasse P., Bogaerts J., et. al.: New response evaluation criteria in solid tumous: revised RECIST guideline (version 1.1). Eur J Cancer 2009; 45: pp. 228-247.
29. R Core Team : R: a language and environment for statistical computing.2016.R Foundation for Statistical ComputingVienna, Austria. https://www.R-project.org/
30. Hothorn T., Hornik K., Zeileis A.: Unbiased recursive partitioning: a conditional inference framework. J Comput Graph Stat 2006; 15: pp. 651-674.
31. World Health Organization : Obesity and overweight. Updated 6/2016. Available at: http://www.who.int/mediacentre/factsheets/fs311/en/ Accessed August 28
32. Steensma D.P., Loprinzi C.L.: The art and science of prognosis in patients with advanced cancer. Eur J Cancer 2000; 36: pp. 2025-2027.
33. Christakis N.A., Lamont E.B.: Extent and determinants of error in doctors’ prognoses in terminally ill patients: prospective cohort study. Br Med J 2000; 320: pp. 469-472.