
Rationale and Objectives
Because many patients with aortic pathology also have compromised renal function, we wished to investigate dual-energy computed tomography (DECT) aortography with 50% reduced iodine dose compared to single-energy computed tomography (SECT) aortography with standard iodine dose.
Materials and Methods
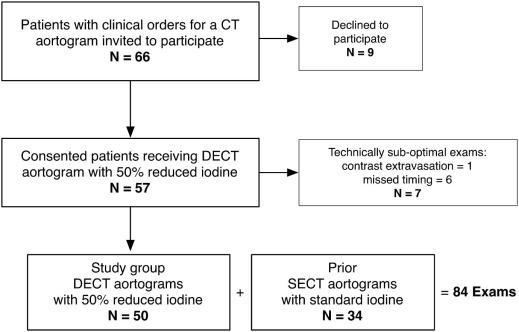
Fifty patients had DECT aortography with 50% reduced iodine dose. Thirty-four of these patients had prior SECT aortography with standard iodine dose. DECT images were reconstructed at both 50 and 77 keV and were compared to SECT 120 kVp images. Reviewers measured aortic attenuation, image noise, and scored vascular enhancement. Signal-to-noise ratios (SNR) and contrast-to-noise ratios (CNR) were calculated. Volume CT dose index was recorded.
Results
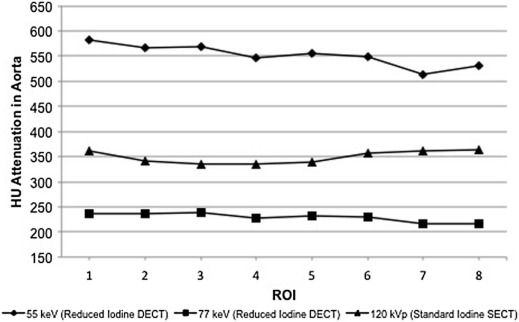
Mean iodine dose was 47 g for SECT and 24 g for DECT. Aortic attenuation was highest at reduced iodine dose DECT 50 keV (570 ± 105 Hounsfield units [HU]) compared to 77 keV (239 ± 40 HU) or to standard iodine dose SECT 120 kVp (356 ± 69 HU) ( P < 0.05). Image noise was greatest at 50 keV compared to 77 keV and 120 kVp ( P < 0.05) but was similar between 77 keV and 120 kVp ( P > 0.05). SNR and CNR were the same at 50 keV and 120 kVp ( P > 0.05). Mean vascular enhancement scores were all above 3.0 (good, typical enhancement). Volume CT dose index was 11.7 mGy for DECT and 11.8 mGy for SECT ( P = 0.37).
Conclusions
DECT aortography with 50% reduced iodine reconstructed at 50 keV resulted in significantly greater aortic attenuation, good subjective vascular enhancement, and comparable SNR and CNR compared to standard iodine dose SECT. DECT image noise at 77 keV was similar to SECT at 120 kVp.
Introduction
Patients with compromised renal function may be at increased risk for iodinated contrast-induced nephropathy (CIN) from computed tomography (CT) aortography. Some authors have proposed that the size of this risk is related to the size of the dose of intravenous iodine . For this reason, a CT aortography technique that substantially reduced the dose of iodine without compromising vascular enhancement might be advantageous.
Dual-energy CT (DECT) enables reconstruction of monochromatic synthetic images at lower energies, which may support iodine dose reduction. Because the x-ray absorption of iodine increases near its k-edge (33.2 keV), DECT images displayed at lower monochromatic energies have substantially increased intravascular attenuation. As a result, DECT aortography performed with a reduced iodine dose and reconstructed at lower monochromatic energies (40–50 keV) may result in intravascular attenuation that is similar to that seen in standard iodine dose single-energy CT (SECT) aortography with 120 kVp polychromatic images. However, with DECT at lower monochromatic energies, overall image noise increases. To compensate, DECT images may also be reconstructed from the same data set at higher monochromatic energies (77 keV) resulting in much less image noise. These additional higher energy DECT images may improve viewing of nonvascular anatomy because the noise levels may be comparable to the noise in standard 120 kVp SECT aortography.
Get Radiology Tree app to read full this article<
Materials and Methods
Get Radiology Tree app to read full this article<
Study Population
Get Radiology Tree app to read full this article<
Get Radiology Tree app to read full this article<
CT Examination Parameters
Get Radiology Tree app to read full this article<
TABLE 1
Acquisition and Postprocessing Parameters
DECT
n = 50
(50% Reduced Iodine) Prior SECT
n = 34
(Standard Iodine) Noise index (0.625 mm slice thickness) N/A 36 Detector collimation (mm) 0.625 0.625 Field of view (cm) 50 50 Pitch 1.375:1 1.375:1 Gantry rotation time (s) 0.5–1.0 0.5–1.0 Tube voltage (kVp) 80/140 rapid switching 120 Tube current (mA) Based on DECT preset protocol choice (mA range 375–640) ATCM (mA range 100–700) Iodinated contrast material iodixanol (270 mgI/mL) iohexol (350 mgI/mL) Reconstruction slice thickness (mm) 2.5 2.5 Reconstruction slice interval (mm) 2.5 2.5 Reconstruction kernel Standard Standard Iterative reconstruction NA ASIR 40%
ASIR, adaptive statistical iterative reconstruction; ATCM, automatic tube current modulation; DECT, dual-energy computed tomography; SECT, single-energy computed tomography.
Get Radiology Tree app to read full this article<
Contrast Protocol
Get Radiology Tree app to read full this article<
Get Radiology Tree app to read full this article<
Image Reconstruction
Get Radiology Tree app to read full this article<
![Figure 2, 72-year-old man for evaluation of an endograft. (a) 2.5 mm axial computed tomography (CT) reconstructions of dual-energy CT (DECT) study group aortogram performed with 26 g of iodine reconstructed at 50 keV (aorta attenuation, 670 Hounsfield units [HU]; noise, 21 HU), (b) the same DECT examination reconstructed at 77 keV (aorta attenuation, 277 HU; noise, 12 HU), and (c) a prior single-energy CT (SECT) on the same patient performed with 52 g of iodine at 120 kVp (aorta attenuation, 336 HU; noise, 15 HU).](https://storage.googleapis.com/dl.dentistrykey.com/clinical/DualenergyCTAortographywith50ReducedIodineDoseVersusSingleenergyCTAortographywithStandardIodineDose/1_1s20S1076633216000520.jpg)
![Figure 3, 76-year-old man for evaluation of endograft placement. (a) 2.5 mm coronal computed tomography (CT) reconstructions of dual-energy CT (DECT) study group aortogram performed with 21 g of iodine reconstructed at 50 keV (aorta attenuation, 494 Hounsfield units [HU]; noise, 18 HU), (b) the same DECT reconstructed at 77 keV (aorta attenuation, 260 HU; noise, 14 HU), and (c) a prior single-energy CT (SECT) performed with 42 g of iodine at 120 kVp (aorta attenuation, 379 HU; noise, 14 HU).](https://storage.googleapis.com/dl.dentistrykey.com/clinical/DualenergyCTAortographywith50ReducedIodineDoseVersusSingleenergyCTAortographywithStandardIodineDose/2_1s20S1076633216000520.jpg)
Get Radiology Tree app to read full this article<
Image Evaluation
Get Radiology Tree app to read full this article<
Get Radiology Tree app to read full this article<
Get Radiology Tree app to read full this article<
Get Radiology Tree app to read full this article<
Statistical Analysis
Get Radiology Tree app to read full this article<
Results
Get Radiology Tree app to read full this article<
Objective Measurements
Get Radiology Tree app to read full this article<
TABLE 2
Attenuation and Noise Measurements for DECT 50% Reduced Iodine Aortograms and Prior SECT Standard Iodine Aortogram
Study Group DECT Reduced Iodine Aortogram ( n = 50) Prior SECT Standard Iodine Aortogram ( n = 34) 50 keV 77 keV 120 kVp Aorta HU 570 ± 105 a 239 ± 40 356 ± 69 Noise (air) 20 ± 4 b 11 ± 2 e 12 ± 3 CNR 26 ± 8 c 17 ± 5 27 ± 10 SNR 30 ± 9 d 22 ± 5 32 ± 11
CNR, contrast-to-noise ratio; DECT, dual-energy computed tomography; HU, Hounsfield units; SECT, single-energy computed tomography.
Data are means ± standard deviations.
Get Radiology Tree app to read full this article<
Get Radiology Tree app to read full this article<
Get Radiology Tree app to read full this article<
Get Radiology Tree app to read full this article<
Get Radiology Tree app to read full this article<
Get Radiology Tree app to read full this article<
Get Radiology Tree app to read full this article<
Get Radiology Tree app to read full this article<
Get Radiology Tree app to read full this article<
TABLE 3
Summary of Attenuation Measurements Below Clinical Minimum Attenuation Thresholds of 200 HU and 250 HU for DECT Reduced Iodine Study Group Examinations and for Prior SECT Standard Iodine Examinations
Location Study Group DECT Reduced Iodine Aortogram ( n = 50) Prior SECT Standard Iodine Aortogram ( n = 34) 50 keV 77 keV 120 kVp HU < 200 HU < 250 HU < 200 HU < 250 HU < 200 HU < 250 ROI 1 0/29 (0%) 0/29 (0%) 2/29 (7%) 18/29 (62%) 1/24 (4%) 2/24 (8%) ROI 2 0/29 (0%) 0/29 (0%) 5/29 (17%) 18/29 (62%) 2/24 (8%) 2/24 (8%) ROI 3 0/29 (0%) 0/29 (0%) 4/29 (14%) 19/29 (66%) 0/24 (0%) 2/24 (8%) ROI 4 0/50 (0%) 0/50 (0%) 13/50 (26%) 26/50 (52%) 1/34 (3%) 6/34 (18%) ROI 5 0/50 (0%) 0/50 (0%) 12/50 (24%) 24/50 (48%) 1/34 (3%) 6/34 (18%) ROI 6 0/40 (0%) 0/45 (0%) 11/40 (28%) 19/40 (48%) 0/28 (0%) 2/28 (7%) ROI 7 0/40 (0%) 3/40 (8%) 11/40 (28%) 29/40 (73%) 0/28 (0%) 3/28 (11%) ROI 8 0/40 (0%) 1/40 (3%) 11/40 (28%) 24/40 (60%) 0/28 (0%) 0/28 (0%)0/307 (0%)4/307 (1%)69/307 (22%)177/307 (58%)5/224 (2%)23/224 (10%)
DECT, dual-energy computed tomography; HU, Hounsfield units; ROI, region of interest; SECT, single-energy computed tomography.
ROI 1 = at the level of the right pulmonary artery in the ascending aorta; ROI 2 = at the mid-aortic arch; ROI 3 = at the level of the right inferior pulmonary vein in the descending aorta; ROI 4 = at the level of the diaphragmatic hiatus; ROI 5 = at the level of the renal arteries; ROI 6 = above the bifurcation of the aorta; ROI 7 = at the level of the right mid-common iliac artery; and ROI 8 = at the level of the left mid-common iliac artery.
Get Radiology Tree app to read full this article<
Subjective Image Evaluation
Get Radiology Tree app to read full this article<
TABLE 4
Summary of Subjective Scores and Means for Two Reviewers Combined
1 (Worst) 2 3 4 (Best) Mean Score Aortic enhancement 50 keV 0/100 (0%) 6/100 (6%) 62/100 (62%) 32/100 (32%) 3.3 77 keV 0/100 (0%) 6/100 (6%) 74/100 (74%) 20/100 (20%) 3.1 120 kVp 0/68 (0%) 2/68 (3%) 34/68 (50%) 32/68 (47%) 3.4 Brachiocephalic enhancement 50 keV 0/58 (0%) 2/58 (3%) 43/58 (77%) 11/58 (20%) 3.1 77 keV 0/58 (0%) 2/58 (3%) 47/58 (84%) 6/58 (11%) 3.1 120 kVp 0/48 (0%) 2/48 (4%) 27/48 (56%) 19/48 (40%) 3.4 Abdominal aortic side branch enhancement 50 keV 0/90 (0%) 7/90 (8%) 60/90 (67%) 23/90 (26%) 3.2 77 keV 0/90 (0%) 9/90 (10%) 62/90 (69%) 19/90 (21%) 3.1 120 kVp 0/60 (0%) 1/60 (2%) 30/60 (50%) 29/60 (48%) 3.5 Overall image noise 50 keV 0/100 (0%) 40/100 (40%) 59/100 (59%) 1/100 (1%) 2.6 77 keV 0/100 (0%) 7/100 (7%) 88/100 (88%) 5/100 (5%) 3.0 120 kVp 0/68 (0%) 6/68 (9%) 51/68 (75%) 11/68 (16%) 3.1
Data are counts with percentages in parentheses.
Get Radiology Tree app to read full this article<
Radiation Dose
Get Radiology Tree app to read full this article<
Discussion
Get Radiology Tree app to read full this article<
Get Radiology Tree app to read full this article<
Get Radiology Tree app to read full this article<
Get Radiology Tree app to read full this article<
Get Radiology Tree app to read full this article<
Get Radiology Tree app to read full this article<
References
1. Katzberg R.W., Barrett B.J.: Risk of iodinated contrast material—induced nephropathy with intravenous administration. Radiology 2007; 243: pp. 622-628.
2. Nyman U., Almen T., Aspelin P., et. al.: Contrast-medium-induced nephropathy correlated to the ratio between dose in gram iodine and estimated GFR in ml/min. Acta Radiol 2005; 46: pp. 830-842.
3. Laville M., Juillard L.: Contrast-induced acute kidney injury: how should at-risk patients be identified and managed?. J Nephrol 2010; 23: pp. 387-398.
4. Kulkarni N.M., Sahani D.V., Desai G.S., et. al.: Indirect computed tomography venography of the lower extremities using single-source dual-energy computed tomography: advantage of low-kiloelectron volt monochromatic images. J Vasc Interv Radiol 2012; 23: pp. 879-886.
5. Pinho D.F., Kulkarni N.M., Krishnaraj A., et. al.: Initial experience with single-source dual-energy CT abdominal angiography and comparison with single-energy CT angiography: image quality, enhancement, diagnosis and radiation dose. Eur Radiol 2013; 23: pp. 351-359.
6. He J., Ma X., Wang Q., et. al.: Spectral CT demonstration of the superior mesenteric artery: comparison of monochromatic and polychromatic imaging. Acad Radiol 2014; 21: pp. 364-368.
7. Carrascosa P., Capunay C., Rodriguez-Granillo G.A., et. al.: Substantial iodine volume load reduction in CT angiography with dual-energy imaging: insights from a pilot randomized study. Int J Cardiovasc Imaging 2014; 30: pp. 1613-1620.
8. Schoellnast H., Tillich M., Deutschmann M.J., et. al.: Aortoiliac enhancement during computed tomography angiography with reduced contrast material dose and saline solution flush: influence on magnitude and uniformity of the contrast column. Invest Radiol 2004; 39: pp. 20-26.
9. Rubin G.D., Rofsky N.M.: CT and MR angiography.1st ed.2009.Lippincott Williams & WilkinsPhiladelphia, PA
10. McDonald J.S., McDonald R.J., Comin J., et. al.: Frequency of acute kidney injury following intravenous contrast medium administration: a systematic review and meta-analysis. Radiology 2013; 267: pp. 119-128.
11. McDonald R.J., McDonald J.S., Bida J.P., et. al.: Intravenous contrast material-induced nephropathy: causal or coincident phenomenon?. Radiology 2013; 267: pp. 106-118.
12. McDonald J.S., McDonald R.J., Carter R.E., et. al.: Risk of intravenous contrast material-mediated acute kidney injury: a propensity score-matched study stratified by baseline-estimated glomerular filtration rate. Radiology 2014; 271: pp. 65-73.
13. Yuan R., Shuman W.P., Earls J.P., et. al.: Reduced iodine load at CT pulmonary angiography with dual-energy monochromatic imaging: comparison with standard CT pulmonary angiography—a prospective randomized trial. Radiology 2012; 262: pp. 290-297.
14. Nakayama Y., Awai K., Funama Y., et. al.: Lower tube voltage reduces contrast material and radiation doses on 16-MDCT aortography. AJR Am J Roentgenol 2006; 187: pp. W490-W497.
15. Chen C.M., Chu S.Y., Hsu M.Y., et. al.: Low-tube-voltage (80 kVp) CT aortography using 320-row volume CT with adaptive iterative reconstruction: lower contrast medium and radiation dose. Eur Radiol 2014; 24: pp. 460-468.
16. Kanematsu M., Goshima S., Miyoshi T., et. al.: Whole-body CT angiography with low tube voltage and low-concentration contrast material to reduce radiation dose and iodine load. AJR Am J Roentgenol 2014; 202: pp. W106-W116.
17. He J., Wang Q., Ma X., et. al.: Dual-energy CT angiography of abdomen with routine concentration contrast agent in comparison with conventional single-energy CT with high concentration contrast agent. Eur J Radiol 2015; 84: pp. 221-227.