
Rationale and Objectives
The purpose of this work was to measure the accuracy of dual-energy computed tomography for identifying iodine and calcium and to determine the effects of calcium suppression in phantoms and lower-extremity computed tomographic (CT) angiographic data sets.
Materials and Methods
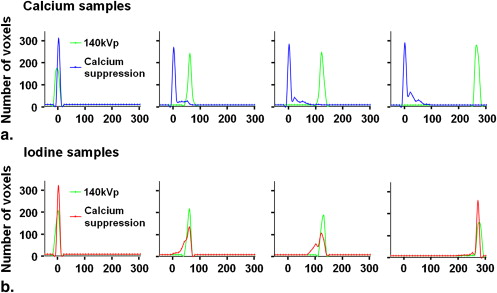
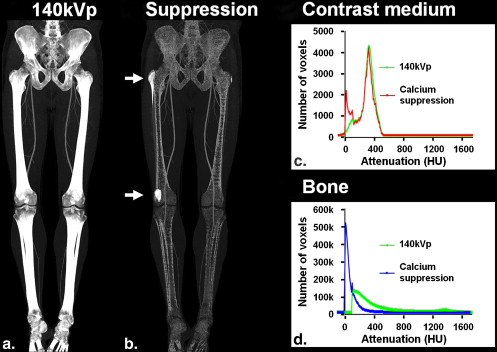
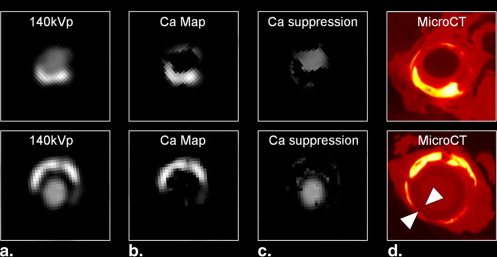
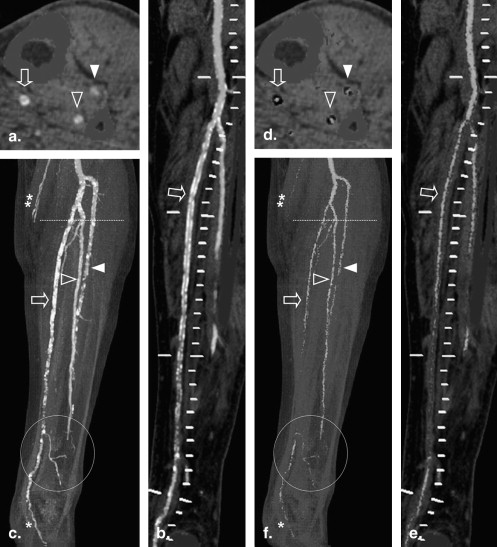
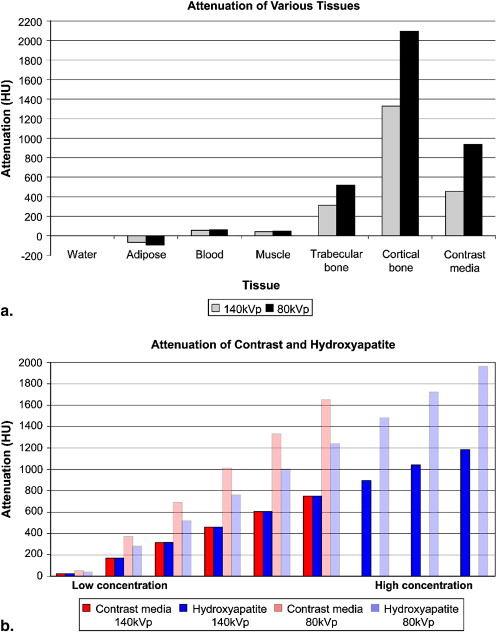
Using a three-material basis decomposition method for 80- and 140-kVp data, the accuracy of correctly identified contrast medium and calcium voxels and the mean attenuation before and after calcium suppression were computed. Experiments were first performed on a phantom of homogenous contrast medium and hydroxyapatite samples with mean attenuation of 57.2, 126, and 274 Hounsfield units (HU) and 50.0, 122, and 265 HU, respectively. Experiments were repeated in corresponding attenuation groups of voxels from manually segmented bones and contrast medium–enhanced arteries in a lower-extremity CT angiographic data set with mean attenuation of 293 and 434 HU, respectively. Calcium suppression in atherosclerotic plaques of a cadaveric specimen was also studied, using micro–computed tomography as a reference, and in a lower-extremity CT angiographic data set with substantial below-knee calcified plaques.
Results
Higher concentrations showed increased accuracy of iodine and hydroxyapatite identification of 87.4%, 99.7%, and 99.9% and 88.0%, 95.0%, and 99.9%, respectively. Calcium suppression was also more accurate with higher concentrations of iodine and hydroxyapatite, with mean attenuation after suppression of 47.1, 122, and 263 HU and 7.14, 11.6, and 12.6 HU, respectively. Similar patterns were seen in the corresponding attenuation groups of the contrast medium–enhanced arteries and bone in the clinical data set, which had overall accuracy of 81.3% and 78.9%, respectively, and mean attenuation after calcium suppression of 254 and 73.7 HU, respectively. The suppression of calcified atherosclerotic plaque was accurate compared with the micro-CT reference; however, the suppression in the clinical data set showed probable inappropriate suppression of the small vessels.
Conclusion
Dual-energy computed tomography can detect and differentiate between contrast medium and calcified tissues, but its accuracy is dependent on the CT density of tissues and limited when CT attenuation is low.
Lower-extremity computed tomographic (CT) angiography (peripheral CTA) has evolved into an accurate, noninvasive imaging modality for the evaluation of patients with peripheral arterial disease ( ). Although high-resolution volumetric CT data sets of the entire peripheral arterial tree can be acquired in <40 seconds with modern (≥16-channel) CT scanners, visualization of the complex manifestations of peripheral arterial disease remains a major challenge ( ). First, bone editing requires substantial user interaction, even with advanced postprocessing tools. Second, vessel wall calcifications are a notorious problem, because calcified plaque precludes the direct visualization of arterial flow channels in maximum-intensity projections (MIPs) or volume-rendered images ( ). Additional postprocessing, such as the generation of curved planar reformations (CPRs), is thus required ( ).
Dual-energy computed tomography (DECT) was originally conceptualized in the 1970s ( ). Recent technical developments using two separate x-ray sources ( ), energy-discriminating detectors ( ), and the rapid switching of tube voltages ( ) have led to renewed interest in this concept. Although DECT does not have perfect discriminatory power, because of the spectral overlap of different materials from noise ( ), the added spectral information can theoretically improve the separation of materials composed of elements with larger atomic numbers, such as iodinated contrast medium and bone or calcified plaque ( ). Thus, DECT has the potential to alleviate the fundamental problem of single-energy CTA caused by the wide overlapping attenuation of calcified tissues (bone and calcified atherosclerotic plaque) and contrast medium–enhanced vessels ( ).
Get Radiology Tree app to read full this article<
Materials and methods
Get Radiology Tree app to read full this article<
Get Radiology Tree app to read full this article<
Accuracy of Iodine and Hydroxyapatite Identification and Effects of Hydroxyapatite Suppression in a Homogenous Phantom
Get Radiology Tree app to read full this article<
Get Radiology Tree app to read full this article<
Get Radiology Tree app to read full this article<
Accuracy of Iodinated Contrast Medium and Bone Identification and Effects of Bone Suppression in a Lower-extremity CT Angiographic Data Set
Get Radiology Tree app to read full this article<
Get Radiology Tree app to read full this article<
Get Radiology Tree app to read full this article<
Get Radiology Tree app to read full this article<
Suppression of Calcified Atherosclerotic Plaque
Get Radiology Tree app to read full this article<
Get Radiology Tree app to read full this article<
Results
Accuracy of Iodine and Hydroxyapatite Identification and Effects of Hydroxyapatite Suppression in a Homogenous Phantom
Get Radiology Tree app to read full this article<
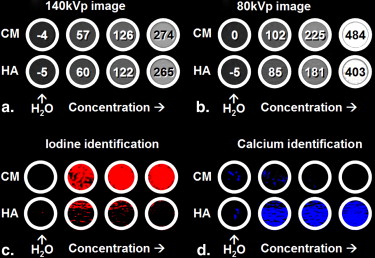
Table 1
Classification and Calcium Suppression of Homogenous Contrast Medium and Hydroxyapatite Samples
Original Classification Calcium Suppression Sample Concentration Mean ± SD 140-kVp Attenuation (HU) CNR Accuracy (%) False-Positives (%) Mean ± SD Attenuation (HU) CNR Iodine (mg/mL) 0.00 −3.88 ± 3.60 0.00 N/A 1.58 0.00 ± 0.01 0.00 0.50 57.2 ± 3.64 16.8 87.4 5.99 47.1 ± 13.6 3.46 1.00 126 ± 3.91 33.2 99.7 2.52 112 ± 14.9 7.51 2.00 274 ± 9.48 29.3 >99.9 <0.01 263 ± 12.4 21.2 Hydroxyapatite (mg/mL) 0.00 5.00 ± 3.63 0.00 N/A 5.99 0.01 ± 0.06 0.00 50.0 60.0 ± 5.19 10.6 88.0 6.31 7.14 ± 14.5 0.49 100 122 ± 5.66 20.7 95.0 0.16 11.6 ± 21.5 0.54 200 265 ± 4.17 62.4 >99.9 <0.01 12.6 ± 18.7 0.67
CNR, contrast-to-noise ratio; HU, Hounsfield units; N/A, not applicable; SD, standard deviation.
Get Radiology Tree app to read full this article<
Get Radiology Tree app to read full this article<
Get Radiology Tree app to read full this article<
Accuracy of Iodinated Contrast Medium and Bone Identification and Effects of Bone Suppression in a Lower-extremity CT Angiographic Data Set
Get Radiology Tree app to read full this article<
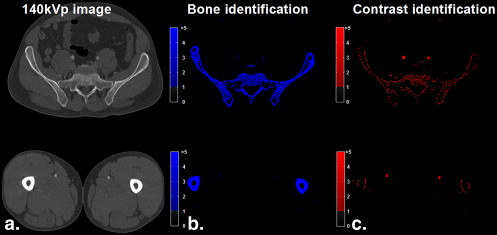
Table 2
Classification and Calcium Suppression of Bone and Contrast Medium in a Peripheral Dual-energy Computed Tomographic Angiographic Data Set
Original Classification Calcium Suppression Sample No. of Voxels Mean ± SD 140-kVp Attenuation (HU) CNR Accuracy (%) Mean ± SD Attenuation (HU) CNR Iodine attenuation (HU) <100 4938 54.1 ± 35.6 1.52 N/A N/A N/A 100–200 7255 151 ± 29.2 5.17 52.9 93.2 ± 66.7 1.40 201–300 19,717 263 ± 26.7 9.85 89.2 234 ± 79.0 2.96 301–400 33,632 342 ± 27.3 12.53 91.9 300 ± 93.3 3.22 401–500 8060 430 ± 22.7 18.94 93.8 391 ± 101 3.87 >500 0 N/A N/A N/A N/A N/A Total 73,602 293 ± 103 2.84 81.3 254 ± 123 2.07 Bone attenuation (HU) <100 0 N/A N/A N/A N/A N/A 100–200 1,195,825 148 ± 28.7 5.16 62.6 62.7 ± 54.6 1.15 201–300 901,083 246 ± 28.6 8.58 75.1 69.3 ± 76.8 0.90 301–400 554,125 345 ± 28.7 12.0 82.9 72.1 ± 90.3 0.80 401–500 351,351 446 ± 28.8 15.4 86.8 77.7 ± 103 0.76 501–1000 675,352 688 ± 140 4.93 90.6 91.1 ± 111 0.82 >1000 465,582 1282 ± 141 9.08 100 81.9 ± 49.8 1.64 Total 4,143,318 434 ± 361 1.20 78.9 73.7 ± 80.4 0.92
CNR, contrast-to-noise ratio; HU, Hounsfield units; N/A, not applicable; SD, standard deviation.
Get Radiology Tree app to read full this article<
Get Radiology Tree app to read full this article<
Get Radiology Tree app to read full this article<
Suppression of Calcified Atherosclerotic Plaque
Get Radiology Tree app to read full this article<
Get Radiology Tree app to read full this article<
Get Radiology Tree app to read full this article<
Get Radiology Tree app to read full this article<
Discussion
Get Radiology Tree app to read full this article<
Get Radiology Tree app to read full this article<
Get Radiology Tree app to read full this article<
Get Radiology Tree app to read full this article<
Get Radiology Tree app to read full this article<
Get Radiology Tree app to read full this article<
Get Radiology Tree app to read full this article<
Appendix
Numerical simulation of dual-energy CT x-ray attenuation and basis material decomposition
Get Radiology Tree app to read full this article<
Get Radiology Tree app to read full this article<
Get Radiology Tree app to read full this article<
Get Radiology Tree app to read full this article<
Get Radiology Tree app to read full this article<
µ(e1)=fxµx(e1)+fyµy(e1)+fzµz(e1), µ
(
e
1
)
=
f
x
µ
x
(
e
1
)
+
f
y
µ
y
(
e
1
)
+
f
z
µ
z
(
e
1
)
,
µ(e2)=fxµx(e2)+fyµy(e2)+fzµz(e2), µ
(
e
2
)
=
f
x
µ
x
(
e
2
)
+
f
y
µ
y
(
e
2
)
+
f
z
µ
z
(
e
2
)
,
and
1=fx+fy+fz. 1
=
f
x
+
f
y
+
f
z
.
Get Radiology Tree app to read full this article<
Get Radiology Tree app to read full this article<
Get Radiology Tree app to read full this article<
Get Radiology Tree app to read full this article<
References
1. Kock M.C., Adriaensen M.E., Pattynama P.M., et. al.: DSA versus multi-detector row CT angiography in peripheral arterial disease: randomized controlled trial. Radiology 2005; 237: pp. 727-737.
2. Ouwendijk R., de Vries M., Pattynama P.M., et. al.: Imaging peripheral arterial disease: a randomized controlled trial comparing contrast-enhanced MR angiography and multi-detector row CT angiography. Radiology 2005; 236: pp. 1094-1103.
3. Fleischmann D., Hallett R.L., Rubin G.D.: CT angiography of peripheral arterial disease. J Vasc Interv Radiol 2006; 17: pp. 3-26.
4. Rubin G.D., Schmidt A.J., Logan L.J., Sofilos M.C.: Multi-detector row CT angiography of lower extremity arterial inflow and runoff: initial experience. Radiology 2001; 221: pp. 146-158.
5. Ouwendijk R., Kock M.C., van Dijk L.C., van Sambeek M.R., Stijnen T., Hunink M.G.: Vessel wall calcifications at multi-detector row CT angiography in patients with peripheral arterial disease: effect on clinical utility and clinical predictors. Radiology 2006; 241: pp. 603-608.
6. Roos J.E., Fleischmann D., Koechl A., et. al.: Multipath curved planar reformation of the peripheral arterial tree in CT angiography. Radiology 2007; 244: pp. 281-290.
7. Chiro G.D., Brooks R.A., Kessler R.M., et. al.: Tissue signatures with dual-energy computed tomography. Radiology 1979; 131: pp. 521-523.
8. Millner M.R., McDavid W.D., Waggener R.G., Dennis M.J., Payne W.H., Sank V.J.: Extraction of information from CT scans at different energies. Med Phys 1979; 6: pp. 70-71.
9. Kelcz F., Joseph P., Hilal S.: Noise considerations in dual energy CT scanning. Med Phys 1979; 6: pp. 418-425.
10. Flohr T.G., McCollough C.H., Bruder H., et. al.: First performance evaluation of a dual-source CT (DSCT) system. Eur Radiol 2006; 16: pp. 256.
11. Carmi R., Naveh G., Altman A.: Material separation with dual-layer CT.Nuclear science symposium conference record.2005.IEEE Nuclear and Plasma Sciences SocietySan Juan, PR:pp. 1876-1878.
12. Kuribayashi S.: Dual energy CT of peripheral arterial disease with single-source 64-slice MDCT. Presented at: 9th Annual International Symposium on MDCT; San Francisco, CA2007.
13. Alvarez R.E., Macovski A.: Energy-selective reconstructions in x-ray computerized tomography. Phys Med Biol 1976; 21: pp. 733-744.
14. Boll D.T., Hoffmann M.H., Huber N., Bossert A.S., Aschoff A.J., Fleiter T.R.: Spectral coronary multidetector computed tomography angiography: dual benefit by facilitating plaque characterization and enhancing lumen depiction. J Comput Assist Tomogr 2006; 30: pp. 804-811.
15. Johnson T., Krauss B., Sedlmair M., et. al.: Material differentiation by dual energy CT: initial experience. Eur Radiol 2007; 17: pp. 1510-1517.
16. Kanitsar A., Wegenkittl R., Felkel P., Fleischmann D., Sandner D., Groeller E.: Computed tomography angiography: a case study of peripheral vessel investigation.Proceedings of IEEE visualization.2001.IEEE Computer SocietySan Diego, CA:pp. 477-480.
17. Langheinrich A.C., Bohle R.M., Greschus S., et. al.: atherosclerotic lesions at micro CT: feasibility for analysis of coronary artery wall in autopsy specimens. Radiology 2004; 231: pp. 675-681.
18. Ota H., Takase K., Igarashi K., et. al.: MDCT compared with digital subtraction angiography for assessment of lower extremity arterial occlusive disease: importance of reviewing cross-sectional images. AJR Am J Roentgenol 2004; 182: pp. 201-209.
19. Hubbell J.H., Seltzer S.M.: Tables of x-ray mass attenuation coefficients and mass energy-absorption coefficients (version 1.4).2004.National Institute of Standards and TechnologyGaithersburg, MD
20. Lehmann L.A., Alvarez R.E., Macovski A., et. al.: Generalized image combinations in dual KVP digital radiography. Med Phys 1981; 8: pp. 659-667.
21. Lawson C.L., Hanson R.J.: Solving least squares problems.1974.Prentice HallEnglewood Cliffs, NJ