
Rationale and Objectives
To evaluate dual-energy computed tomography spectral and energy weighted (W) image data sets concerning carotid stenosis and calcified plaque detection.
Materials and Methods
Ninety patients were evaluated using contrast media injection. Energy used for dual-energy computed tomography was tin filter with 140/80 kiloVoltage and effective milli Ampere second was 147.4/270.6. Image reconstruction was performed using D30f kernel and 0.0, 0.3, 0.6, 0.8, 1.0 weightings. Data sets were analyzed using both qualitative and quantitative methods.
Results
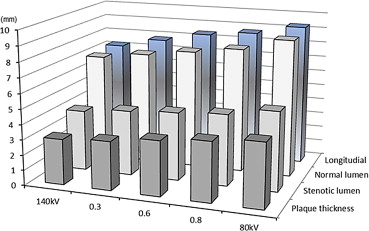
The signal-to-noise ratio, contrast-to-noise ratio, and figure-of-merit were significantly higher in 0.6-W compared to 140-kV or 80-kV data (all P < .05). Plaque thickness, span, and longitudinal diameters were different for 140-kV, 0.6-W, and 80-kV data (all P < .05). Stenotic intra-luminal diameter was significantly different among 140 kV, 0.6 W, and 80 kV data (all P < .05). A comparison between 0.6 W and digital subtraction angiography was nonsignificant ( P > .05) in normal lumen measurement.
Conclusions
The dimension of calcified plaque and carotid artery with contrast media decreased with increased energy. The percentage of carotid artery stenosis does not vary with different energy. Care must be taken for procedural planning like sizing of stents. Measured diameters of the 0.6 W were close to digital subtraction angiography; we suggest that planning should be based on the images acquired using 0.6 weighting.
Multiple imaging modalities such as ultrasound , magnetic resonance imaging , and computed tomography (CT) have proved their efficient role in the examination of vessels. CT has a major role in evaluating artery stenosis or calcified plaques and is almost equivalent to catheter angiography for assessment . Magnetic resonance angiography offers an equivalent accuracy in artery stenosis evaluation compared with digital subtraction angiography (DSA) . Recently, there has been a rapid increase in the use of dual-energy computed tomography (DECT). A recent article showed that DECT provides a good correlation of grading stenosis in comparison with the gold standard of catheter angiography. DECT was introduced in 2006, and this modality provides high temporal resolution of 83 ms in a monosegment reconstruction mode . A recent study showed that separation of objects such as water, adipose, iodine, and calcium concentrations are possible using multienergy CT images. The DECT system consists of two X-ray tubes, and it uses two different energies simultaneously for the imaging of patients. The two responsible radiation interaction mechanisms in the diagnostic energy are the Compton effect (CE) and the photoelectric effect (PEE).
The PEE is the mechanism that controls the image quality and radiation dose in diagnostic radiology. The PEE is directly related to the energy used for the imaging and the atomic number or density of the material under investigation. Contrast media (CM) consists of iodine that used for clinical examination of patients and calcified plaque consists of calcium; both are considered to be materials with a high atomic number compared to body tissues. Improvement of the cerebral artery blood flow and resolution of the neurological symptoms are highly dependent on the luminal dimension of the carotid artery. Treatment decisions often depend on carotid artery percent stenosis, and sizing of stents relies on an accurate measurement of luminal diameters. Hence, any possible variability in luminal diameter on the CT image potentially leads to a great clinical impact. In this study, we used a relatively new technology, the latest DECT, to study the luminal diameter of the extracranial carotid arteries using CM and calcified plaque detection. Here, the question arises of whether the DECT data sets produce similar results during diagnosis for the dimensions of calcification and the carotid artery measurements.
Materials and methods
Study Population
Get Radiology Tree app to read full this article<
Dual-Energy Protocol and Data Acquisition
Get Radiology Tree app to read full this article<
Table 1
Computed tomography (CT) imaging parameters used for the dual energy CT neck examination
Scan Parameters Protocol Scan mode Dual-source dual-energy Tube potential (kV) 80/Sn140 Effective tube current–time product (mAs) 270.6 ± 12 (262–280)/147.4 ± 14 (134–155) Automatic exposure control (care dose 4D) Yes Scan length (cm) 30 Rotation time (s) 0.28 Detector collimation (mm) 32 × 0.6 × 2 Pitch 1.2 Scan slice thickness (mm) 0.6 Reconstruction kernel D30f Reconstruction slice thickness (mm) 2 Matrix size 512 × 512 Field of view (mm) 200
Get Radiology Tree app to read full this article<
Image Reconstruction
Get Radiology Tree app to read full this article<
DSA Protocol
Get Radiology Tree app to read full this article<
Image Quality Assessments in DECT
Get Radiology Tree app to read full this article<
Objective method
Get Radiology Tree app to read full this article<
Subjective method
Get Radiology Tree app to read full this article<
Data Analysis
Get Radiology Tree app to read full this article<
Stenosis analysis
Get Radiology Tree app to read full this article<
Radiation Dose Estimation
Get Radiology Tree app to read full this article<
Get Radiology Tree app to read full this article<
Statistical Analysis
Get Radiology Tree app to read full this article<
Results
Image Quality Analysis in DECT Data Sets
Get Radiology Tree app to read full this article<
Table 2
Assessment of the image quality parameters and quantitative analysis of the calcified plaque/carotid artery stenosis from the image data sets (category 1)
Parameters X-ray energy used for imaging and its weighting factors Group 1 (G1) Group 2 (G2) Group 3 (G3) Group 4 (G4) Group 5 (G5)P 140 kV 0.3 W 0.6 W 0.8 W 80 kV Hounsfield unit (HU muscle ) 57 ± 7.2 (46–63) 64 ± 8.2 (62–69) 70 ± 11.3 (67–74) 75 ± 11 (72–79) 80 ± 13 (74–86) G1 vs G3 = .0011
G1 vs G5 = .0081
G3 vs G5 = .0092 Image noise (HU) 9 ± 2.8 (8–10) 7 ± 1.7 (6.1–7.9) 5 ± 0.8 (3.9–5.8) 8 ± 2 (7–9.3) 11 ± 2.4 (9.6–12.2) G1 vs G3 = .0053
G1 vs G5 = .0047
G3 vs G5 = .0434 Hounsfield Unit (HU artery ) 138 ± 25 (99–156) 197 ± 50 (167–234) 268 ± 64 (239–292) 312 ± 78 (286–337) 339 ± 80 (301–368) G1 vs G3 = .00099
G1 vs G5 = .00061
G3 vs G5 = .00071 Signal-to-noise ratio 7 ± 2.3 (6.2–7.8) 9 ± 3 (8.4–9.9) 12 ± 4 (11.1–12.9) 10 ± 2.4 (9.4–11) 8 ± 1.6 (7.2–8.9) G1 vs G3 = .0094
G1 vs G5 = .0205
G3 vs G5 = .0245 Contrast-to-noise ratio (HU) 11 ± 3.5 (4.4–14.5) 24 ± 9.9 (15.8–27.4) 38 ± 14 (29–46) 30 ± 15 (24.2–36.3) 23 ± 13 (19.4–28.7) G1 vs G3 = .0022
G1 vs G5 = .0104
G3 vs G5 = .0017 Figure of merit (FOM) 11 ± 7 (6–19) 52 ± 64 (34–67) 168 ± 140 (126–187) 121 ± 128 (102–139) 83 ± 110 (61–94) G1 vs G3 = .0044
G1 vs G5 = .0197
G3 vs G5 = .0002 Plaque thickness (mm) 3 ± 0.55 (2–3.9) 3.2 ± 0.68 (2.4–4.1) 3.6 ± 0.48 (2.8–4.5) 3.9 ± 0.54 (3.1–4.7) 4.2 ± 0.66 (3.3–5.1) G1 vs G3 = .0084
G1 vs G5 = .0062
G3 vs G5 = .0278 Plaque span (mm) 5.9 ± 0.69 (4.4–6.7) 6.3 ± 0.66 (4.8–7) 6.6 ± 0.76 (5.1–7.5) 6.9 ± 0.88 (5.9–7.9) 7.5 ± 0.81 (6.7–8.3) G1 vs G3 = .0432
G1 vs G5 = .0345
G3 vs G5 = .0443 Plaque longitudinal (mm) 7.3 ± 0.84 (5.6–8.5) 7.8 ± 0.89 (5.9–9.2) 8.4 ± 0.99 (6–9.9) 8.7 ± 0.88 (7.4–10) 9.2 ± 0.79 (7.9–11) G1 vs G3 = .0279
G1 vs G5 = .0185
G3 vs G5 = .0343 Narrowed lumen (mm; A) 4.1 ± 0.92 (2.9–5.8) 4.3 ± 0.85 (3.1–6) 4.5 ± 0.91 (3.3–6.4) 4.7 ± 0.93 (3.5–6.6) 5.2 ± 0.84 (3.8–6.9) G1 vs G3 = .0455
G1 vs G5 = .0389
G3 vs G5 = .0396 Normal lumen (mm; B) 7.1 ± 1.19 (5–9.3) 7.4 ± 1.42 (5.3–9.6) 7.8 ± 1.44 (5.6–10.1) 8.2 ± 1.21 (6.2–10.4) 9 ± 1.26 (6.5–10.7) G1 vs G3 = .0277
G1 vs G5 = .0194
G3 vs G5 = .0321 Percentage stenosis (%)
1 − (A/B) × 100 42.3 41.9 42.3 42.4 42.2 —
Table 3
Assessment of image quality parameters, calcified plaques, and carotid artery stenosis from the image data sets obtained using patients appeared for imaging of carotid artery due to atherosclerotic disease (category 2)
Parameters X-ray energy used for imaging and its weighting factors Group 1 (G1) Group 2 (G2) Group 3 (G3) Group 4 (G4) Group 5 (G5)P 140 kV 0.3 W 0.6 W 0.8 W 80 kV Hounsfield unit (HU muscle ) 56 ± 7 (41–64) 62 ± 8 (55–73) 68 ± 11 (61–81) 75 ± 11 (69–87) 79 ± 12 (71–95) G1 vs G3 = .0122
G1 vs G5 = .0041
G3 vs G5 = .0092 Image noise (HU) 11 ± 3.1 (9–14) 7.5 ± 2 (6–9) 6 ± 1 (4–7.5) 8.6 ± 2 (7–9.5) 12 ± 3 (10–14) G1 vs G3 = .0033
G1 vs G5 = .0497
G3 vs G5 = .0034 Hounsfield unit (HU artery ) 144 ± 34 (123–169) 209 ± 53 (184–239) 277 ± 69 (243–296) 331 ± 82 (289–351) 358 ± 87 (324–387) G1 vs G3 = .0009
G1 vs G5 = .0001
G3 vs G5 = .0002 Signal-to-noise ratio 5.1 ± 2.2 (4.4–5.6) 8.3 ± 3 (7.2–8.9) 11.3 ± 3.7 (9–14) 8.7 ± 2.5 (6–10) 6.6 ± 1.5 (5–8) G1 vs G3 = .0004
G1 vs G5 = .0405
G3 vs G5 = .0045 Contrast-to-noise ratio (HU) 8 ± 4 (6.5–9.7) 19.6 ± 10 (16–24) 34.8 ± 12.5 (29–38) 29.8 ± 14 (25–34) 23.3 ± 13 (18–27) G1 vs G3 = .0002
G1 vs G5 = .0004
G3 vs G5 = .0191 Figure of merit (FOM) 6.6 ± 6.5 (4.3–8) 39.76 ± 52 (32–46) 125.4 ± 111 (113–141) 92 ± 63 (81–101) 56.2 ± 32 (38–67) G1 vs G3 = .0004
G1 vs G5 = .0029
G3 vs G5 = .0002 Plaque longitudinal (mm) 18.9 ± 1.2 (16–24) 19.9 ± 1.4 (17–25) 20.5 ± 1.5 (18–26) 21.2 ± 1.4 (18–26) 22.1 ± 1.3 (19–28) G1 vs G3 = .0375
G1 vs G5 = .0145
G3 vs G5 = .0346 Plaque thickness (mm) 5.4 ± 0.6 (4.4–6) 5.8 ± 0.55 (4.9–6.5) 6.2 ± 0.65 (5.5–6.9) 6.6 ± 0.62 (6–7.3) 7.3 ± 0.6 (6.6–7.9) G1 vs G3 = .0373
G1 vs G5 = .0232
G3 vs G5 = .0388 Narrowed lumen (mm; A) 1.9 ± 0.9 (1.5–2.5) 2.2 ± 1 (1.9–2.6) 2.3 ± 0.93 (2–2.7) 2.5 ± 0.97 (2.2–2.9) 2.7 ± 0.9 (2.4–3.2) G1 vs G3 = .0455
G1 vs G5 = .0129
G3 vs G5 = .0366 Normal lumen (mm; B) 7.2 ± 1.3 (6.8–7.5) 8.2 ± 1.2 (7.9–8.4) 8.5 ± 1.4 (8.3–8.7) 9.2 ± 1.5 (8.8–9.4) 10 ± 1.4 (9.7–10.3) G1 vs G3 = .0411
G1 vs G5 = .0264
G3 vs G5 = .0425 Percentage stenosis (%)
1 − (A/B) × 100 73.6 73.2 73.2 72.8 73 —
![Figure 1, Comparison between energy weighted data set of dual-energy computed tomography: quantitative image quality (signal-to-noise ratio [SNR]) and subjective image quality (visual grading score [VGS]). Dual-energy 0.6 weighted (W) image data showed higher image quality in all assessed methods.](https://storage.googleapis.com/dl.dentistrykey.com/clinical/DualEnergyCTSpectralandEnergyWeightedDataSets/0_1s20S1076633213002730.jpg)
Get Radiology Tree app to read full this article<
Get Radiology Tree app to read full this article<
Stenosis and Plaque Evaluation Using DECT
Get Radiology Tree app to read full this article<
Get Radiology Tree app to read full this article<
Comparison Between DECT (0.6 W) and DSA
Get Radiology Tree app to read full this article<
Dose Estimation
Get Radiology Tree app to read full this article<
Table 4
Technical as Well as dose parameters used for digital subtraction angiography examination
Parameter: DSA Kilovoltage 71.5 ± 5 (66–78) Current (mA) 461.6 ± 51 (413–488) Time (sec) 8.06 ± 2.72 (5–12) Number of frames 14.2 ± 5 (9.1–21) Frame rate (sec) 2 Filter thickness (mm) 0.1 Skin entry dose (mGy) 30 ± 20 (24.3–52.6) Dose–area product (Gy/cm²) 13.44 ± 5.5 (7.1–20.4)
Get Radiology Tree app to read full this article<
Discussion
Get Radiology Tree app to read full this article<
Get Radiology Tree app to read full this article<
Get Radiology Tree app to read full this article<
Conclusion
Get Radiology Tree app to read full this article<
Get Radiology Tree app to read full this article<
Get Radiology Tree app to read full this article<
References
1. Kwon B.J., Jung C., Sheen S.H., et. al.: CT angiography of stented carotid arteries: comparison with Doppler ultrasonography. J Endovasc Ther 2007; 14: pp. 489-497.
2. Ozgun M., Rink M., Hoffmeier A., et. al.: Intra individual comparison of 3D coronary MR angiography and coronary CT angiography. Acad Radiol 2007; 14: pp. 910-916.
3. Hyde D.E., Fox A.J., Gulka I., et. al.: Internal carotid artery stenosis measurement: comparison of 3D computed rotational angiography and conventional digital subtraction angiography. Stroke 2004; 35: pp. 2776-2781.
4. Biermann C., Tsiflikas I., Thomas C., et. al.: Evaluation of computer-assisted quantification of carotid artery stenosis. J Digit Imaging 2012; 25: pp. 250-257.
5. Mannelli L., Mitsumori L.M., Ferguson M., et. al.: Changes in measured size of atherosclerotic plaque calcifications in dual-energy CT of ex vivo carotid endarterectomy specimens: effect of monochromatic keV image reconstructions. Eur Radiol 2013; 23: pp. 367-374.
6. Soeda T., Uemura S., Morikawa Y., et. al.: Diagnostic accuracy of dual-source computed tomography in the characterization of coronary atherosclerotic plaques: comparison with intravascular optical coherence tomography. Int J Cardiol 2011; 148: pp. 313-318.
7. Busch S., Nikolaou K., Johnson T.C., et. al.: Quantification of coronary artery stenosis: comparison of 64-slice and dual source CT angiography with cardiac catheterization. Radiologe 2007; 47: pp. 295-300.
8. Degnan A.J., Gallagher G., Teng Z., et. al.: MR angiography and imaging for the evaluation of middle cerebral artery atherosclerotic disease. Am J Neuroradiol 2012; 33: pp. 1427-1435.
9. Lin C.J., Hsu J.C., Lai Y.J., et. al.: Diagnostic accuracy of dual-source CT coronary angiography in a population unselected for degree of coronary artery calcification and without heart rate modification. Clin Radiol 2010; 65: pp. 109-117.
10. Alessio A.M., Macdonald L.R.: Quantitative material characterization from multi-energy photon counting CT. Med Phys 2013; 40: pp. 031108.
11. Kim K.S., Lee J.M., Kim S.H., et. al.: Image fusion in dual-energy computed tomography for detection of hyper-vascular liver hepatocellular carcinoma: phantom and preliminary studies. Invest Radiol 2010; 45: pp. 149-157.
12. Beeres M., Schell B., Mastragelopoulos A., et. al.: High-pitch dual-source CT angiography of the whole aorta without ECG synchronisation: initial experience. Eur Radiol 2012; 22: pp. 129-137.
13. Fox A.J.: How to measure carotid stenosis. Radiology 1993; 186: pp. 316-318.
14. Schwartz J.: Calculating percent stenosis. AJNR Am J Neuroradiol 2001; 22: pp. 228.
15. Bongartz G., Golding S.J., Jurik A.G.: CT quality criteria.2004 March.European CommissionLuxembourg
16. Boone JM, Strauss KJ, Cody DD, et al. Size-specific dose estimates (SSDE) in pediatric and adult body CT examinations. 2011, AAPM Report No. 204. American association of physicist in medicine, One physics ellipse, College Park, MD. 20740-3846.
17. Sakamoto H., Aikawa Y., Ikegawa H., et. al.: Consideration of the newly standardized interventional reference point. Nihon Hoshasen Gijutsu Gakkai Zasshi 2004; 60: pp. 520-527.
18. Link J., Brossmann J., Grabener M., et. al.: Spiral CT angiography and selective digital subtraction angiography of internal carotid artery stenosis. AJNR Am J Neuroradiol 1996; 17: pp. 89-94.
19. Sterpetti A.V., Schultz R.D., Feldhaus R.J., et. al.: Ultrasonographic features of carotid plaque and the risk of subsequent neurologic deficits. Surgery 1988; 104: pp. 652-660.
20. Hobson R.W., Mackey W.C., Ascher E., et. al.: Management of atherosclerotic carotid artery disease: clinical practice guidelines of the Society for Vascular Surgery. J Vasc Surg 2008; 48: pp. 480-486.