
Rationale and Objectives
The aim of this study was to measure the radiation dose of dual-energy and single-energy multidetector computed tomographic (CT) imaging using adult liver, renal, and aortic imaging protocols.
Materials and Methods
Dual-energy CT (DECT) imaging was performed on a conventional 64-detector CT scanner using a software upgrade (Volume Dual Energy) at tube voltages of 140 and 80 kVp (with tube currents of 385 and 675 mA, respectively), with a 0.8-second gantry revolution time in axial mode. Parameters for single-energy CT (SECT) imaging were a tube voltage of 140 kVp, a tube current of 385 mA, a 0.5-second gantry revolution time, helical mode, and pitch of 1.375:1. The volume CT dose index (CTDI vol ) value displayed on the console for each scan was recorded. Organ doses were measured using metal oxide semiconductor field-effect transistor technology. Effective dose was calculated as the sum of 20 organ doses multiplied by a weighting factor found in International Commission on Radiological Protection Publication 60. Radiation dose saving with virtual noncontrast imaging reconstruction was also determined.
Results
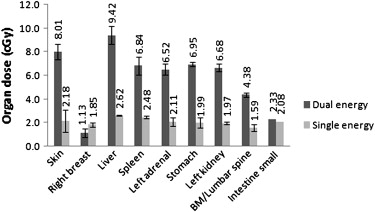
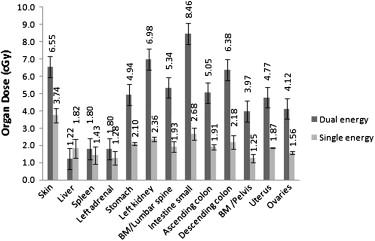
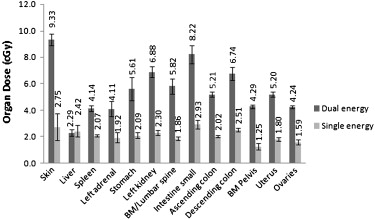
The CTDI vol values were 49.4 mGy for DECT imaging and 16.2 mGy for SECT imaging. Effective dose ranged from 22.5 to 36.4 mSv for DECT imaging and from 9.4 to 13.8 mSv for SECT imaging. Virtual noncontrast imaging reconstruction reduced the total effective dose of multiphase DECT imaging by 19% to 28%.
Conclusion
Using the current Volume Dual Energy software, radiation doses with DECT imaging were higher than those with SECT imaging. Substantial radiation dose savings are possible with DECT imaging if virtual noncontrast imaging reconstruction replaces precontrast imaging.
Dual-energy computed tomographic (DECT) imaging is a computed tomographic (CT) imaging technique that uses two different kilovoltage energies nearly simultaneously during the same imaging session. Scanning at two different tube voltages has the potential to improve the characterization of various tissues because of the inherent changes in CT absorption parameters at different kilovoltage energies. Several applications for DECT scans in abdominal imaging are currently under investigation. DECT imaging has the potential to improve the detection of malignant liver tumors , enable the determination of urinary stone composition in vivo , and expedite the postprocessing of cardiac and abdominal CT angiography . Another potential application of DECT imaging is the capability to generate virtual noncontrast images reconstructed from postcontrast images by using iodine-subtraction techniques . Replacing the precontrast phase of a multiphase imaging protocol with a virtual noncontrast image reconstruction has the potential to reduce radiation dose effects as well as decrease imaging time.
The performance of DECT scans is currently vastly different for the various manufacturers of CT scanners . Volume Dual Energy (VDE) (GE Healthcare, Milwaukee, WI) is an investigative software package that can be added to an existing single-energy 64-detector CT scanner (LightSpeed VCT; GE Healthcare) and allow it to perform both single-energy CT (SECT) and DECT imaging without any additional hardware changes. This software enables a conventional (single-source) 64-detector CT scanner to produce two different kilovoltage energies nearly simultaneously during a single imaging acquisition. VDE works by rapidly switching between 80 and 140 kVp with each gantry rotation, while operating in axial cine mode.
Get Radiology Tree app to read full this article<
Materials and methods
CT Scanner and Imaging Protocols
Get Radiology Tree app to read full this article<
Imaging Protocols
Get Radiology Tree app to read full this article<
Get Radiology Tree app to read full this article<
Table 1
Liver, Renal, and Aortic Imaging Protocols and Console Radiation Dosimetry for SECT Imaging
Liver Renal Aortic Parameter Precontrast Arterial Phase Portal Phase Delayed Precontrast Nephrographic Excretory Precontrast Arterial Phase Peak kilovoltage (kVp) 140 140 140 140 140 140 140 140 140 Amperage (mA) 385 385 385 385 385 385 385 385 385 Gantry revolution time (s) 0.5 0.5 0.5 0.5 0.5 0.5 0.5 0.5 0.5 Detector configuration 64 × 0.625 64 × 0.625 64 × 0.625 64 × 0.625 64 × 0.625 64 × 0.625 64 × 0.625 64 × 0.625 64 × 0.625 Longitudinal table coverage (cm) 20 20 20 20 28 12 28 32 32 Pitch 1.375 1.375 1.375 1.375 1.375 1.375 1.375 1.375 1.375 Field of view 50 50 50 50 50 50 50 50 50 CTDI vol (mGy) 16.19 16.19 16.19 16.19 16.19 16.19 16.19 16.19 16.19 DLP (mGy · cm) 420.4 420.4 420.4 420.4 549.9 290.9 549.9 614.6 614.6
CTDI vol , volume computed tomographic dose index; DLP, dose-length product; SECT, single-energy computed tomographic.
Table 2
Liver, Renal, and Aortic Imaging Protocols and Console Radiation Dosimetry for DECT Imaging
Liver Renal Aortic Parameter Precontrast Arterial Phase Portal Phase Delayed Precontrast Nephrographic Excretory Phase Precontrast Arterial Phase Peak kilovoltage (kVp) 140 140 80 140 140 140 140 140 80 140 140 80 Amperage (mA) 385 385 675 385 385 385 385 385 675 385 385 675 Gantry revolution time (s) 0.5 0.8 0.8 0.5 0.5 0.5 0.5 0.8 0.8 0.5 0.8 0.8 Detector configuration 64 × 0.625 64 × 0.625 64 × 0.625 64 × 0.625 64 × 0.625 64 × 0.625 64 × 0.625 64 × 0.625 64 × 0.625 64 × 0.625 64 × 0.625 64 × 0.625 Longitudinal table coverage (cm) 20 20 20 20 20 28 12 28 28 32 32 32 Pitch 1.375 1 1 1.375 1.375 1.375 1.375 1 1 1.375 1 1 CTDI vol (mGy) 16.19 35.61 13.82 16.19 16.19 16.19 16.19 35.61 13.82 16.19 35.16 13.82 DLP (mGy · cm) 420.4 712.2 276.9 420.4 420.4 549.9 549.9 997.1 387.1 614.6 1139.5 442.4
CTDI vol , volume computed tomographic dose index; DLP, dose-length product; DECT, dual-energy computed tomographic.
Get Radiology Tree app to read full this article<
Organ Dose Determination
Get Radiology Tree app to read full this article<
Get Radiology Tree app to read full this article<
Get Radiology Tree app to read full this article<
SECT Organ Dose Determination
Get Radiology Tree app to read full this article<
DECT Organ Dose Determination
Get Radiology Tree app to read full this article<
Effective Dose Determination
Get Radiology Tree app to read full this article<
Noise Analysis and Image Quality Measurements
Get Radiology Tree app to read full this article<
Get Radiology Tree app to read full this article<
Get Radiology Tree app to read full this article<
Get Radiology Tree app to read full this article<
Get Radiology Tree app to read full this article<
Results
Get Radiology Tree app to read full this article<
Table 3
Liver, Renal, and Aortic Protocols: Individual-Phase Effective Doses for SECT and DECT Imaging
DECT Imaging Protocol SECT Imaging (mSv) 140 kVp (mSv) 80 kVp (mSv) 80 and 140 kVp Together (mSv) Liver 9.4 ± 0.7 17.5 ± 0.6 5.1 ± 0.3 22.5 ± 0.6 Renal 13.1 ± 0.6 26.5 ± 0.5 7.6 ± 0.5 34.0 ± 0.7 Aortic 13.8 ± 0.7 28.5 ± 1.3 7.9 ± 0.4 36.4 ± 1.4
DECT, dual-energy computed tomographic; SECT, single-energy computed tomographic.
Get Radiology Tree app to read full this article<
Get Radiology Tree app to read full this article<
Get Radiology Tree app to read full this article<
Get Radiology Tree app to read full this article<
Get Radiology Tree app to read full this article<
Get Radiology Tree app to read full this article<
Get Radiology Tree app to read full this article<
Get Radiology Tree app to read full this article<
Discussion
Get Radiology Tree app to read full this article<
Get Radiology Tree app to read full this article<
Get Radiology Tree app to read full this article<
Get Radiology Tree app to read full this article<
Get Radiology Tree app to read full this article<
Get Radiology Tree app to read full this article<
Get Radiology Tree app to read full this article<
Conclusions
Get Radiology Tree app to read full this article<
Acknowledgment
Get Radiology Tree app to read full this article<
References
1. Raptopoulos V., Karellas A., Bernstein J., Reale F.R., Constantinou C., Zawacki J.K.: Value of dual-energy CT in differentiating focal fatty infiltration of the liver from low-density masses. AJR Am J Roentgenol 1991; 157: pp. 721-725.
2. Wang B., Gao Z., Zou Q., Li L.: Quantitative diagnosis of fatty liver with dual-energy CT. An experimental study in rabbits. Acta Radiol 2003; 44: pp. 92-97.
3. Schindera S.T., Nelson R.C., Mukundan S., et. al.: Hypervascular liver tumors: low tube voltage, high tube current multi-detector row CT for enhanced detection—phantom study. Radiology 2008; 246: pp. 125-132.
4. Grosjean R., Sauer B., Guerra R.M., et. al.: Characterization of human renal stones with MDCT: advantage of dual energy and limitations due to respiratory motion. AJR Am J Roentgenol 2008; 190: pp. 720-728.
5. Primak A.N., Fletcher J.G., Vrtiska T.J., et. al.: Noninvasive differentiation of uric acid versus non-uric acid kidney stones using dual-energy CT. Acad Radiol 2007; 14: pp. 1441-1447.
6. Boll D.T., Merkle E.M., Paulson E.K., Mirza R.A., Fleiter T.R.: Calcified vascular plaque specimens: assessment with cardiac dual-energy multidetector CT in anthropomorphically moving heart phantom. Radiology 2008; 249: pp. 119-126.
7. Boll D.T., Merkle E.M., Paulson E.K., Fleiter T.R.: Coronary stent patency: dual-energy multidetector CT assessment in a pilot study with anthropomorphic phantom. Radiology 2008; 247: pp. 687-695.
8. Takahashi N., Hartman R.P., Vrtiska T.J., et. al.: Dual-energy CT iodine-subtraction virtual unenhanced technique to detect urinary stones in an iodine-filled collecting system: a phantom study. AJR Am J Roentgenol 2008; 190: pp. 1169-1173.
9. Shikhaliev P.M.: Computed tomography with energy-resolved detection: a feasibility study. Phys Med Biol 2008; 53: pp. 1475-1495.
10. Graser A., Johnson T.R., Bader M., et. al.: Dual energy CT characterization of urinary calculi: initial in vitro and clinical experience. Invest Radiol 2008; 43: pp. 112-119.
11. Yoshizumi T.T., Goodman P.C., Frush D.P., et. al.: Validation of metal oxide semiconductor field effect transistor technology for organ dose assessment during CT: comparison with thermoluminescent dosimetry. AJR Am J Roentgenol 2007; 188: pp. 1332-1336.
12. Hollingsworth C.L., Yoshizumi T.T., Frush D.P., et. al.: Pediatric cardiac-gated CT angiography: assessment of radiation dose. AJR Am J Roentgenol 2007; 189: pp. 12-18.
13. Hurwitz L.M., Yoshizumi T.T., Goodman P.C., et. al.: Effective dose determination using an anthropomorphic phantom and metal oxide semiconductor field effect transistor technology for clinical adult body multidetector array computed tomography protocols. J Comput Assist Tomogr 2007; 31: pp. 544-549.
14. Jaffe T.A., Gaca A.M., Delaney S., et. al.: Radiation doses from small-bowel follow-through and abdominopelvic MDCT in Crohn’s disease. AJR Am J Roentgenol 2007; 189: pp. 1015-1022.
15. International Commission on Radiological Protection: Recommendations of the International Commission on Radiological Protection.1991.PergamonOxford, UK
16. The Phantom Laboratory: Catphan ® 500 and 600 manual.2009.The Phantom LaboratorySalem, NY Available at: http://www.phantomlab.com/pdf/catphan500-600manual.pdf Accessed June 15, 2009
17. Akutagawa W.M., Huth G.C., Levis R.E., Drianis G.C., Davis R.L.: Increased tissue differentiation using color display of multiple-energy CT scans. Radiology 1980; 134: pp. 739-756.