
Rationale and Objectives
The aim of the study was to investigate the optimal protocols of dual-source computed tomography (CT) angiography in aortic stent grafting in terms of image noise and radiation dose, based on an in vitro phantom study.
Materials and Methods
A series of helical CT cans were performed on a human aorta phantom using a dual-source CT scanner with kVp of 100, 120, and 140, corresponding mAs of 180, 150, and 100; slice thickness of 1.0, 1.5, and 2.0 mm; and pitch value of 0.5, 1.0, and 1.5, respectively. Image quality was determined by measuring the standard deviation (SD) on three-dimensional virtual intravascular endoscopy (VIE) images. Signal-to-noise ratio (SNR) and contrast-to-noise ratio (CNR) were measured on two-dimensional (2D) axial images at superior mesenteric artery (SMA), renal arteries, and aneurysm. Effective dose was determined based on dose-length product.
Results
SD measured on VIE images was independent of kVp and pitch values but was determined by the slice thickness ( P < .05) at the SMA and renal arteries. SNR and CNR measured on 2D images showed significant differences between variable kVp values and slice thicknesses ( P < .05), but were independent of pitch values. The mean estimated effective dose for 120 kVp and 140 kVp protocols were 2.66 ± 0.21 mSv and 2.68 ± 0.18 mSv, respectively. The mean estimated effective dose for 100 kVp protocol was significantly lower (1.97 ± 0.07 mSv, P < .0001). This indicates a reduction of 26.5% radiation dose when the kVp was lowered from 140 to 100.
Conclusion
A scanning protocol of 1.5-mm slice thickness, pitch 1.5 with 100 kVp, and 180 mAs is recommended for a dual-source CT angiography in aortic stent grafting as it leads to significant reduction of radiation dose while achieving diagnostic images.
Helical computed tomography (CT) angiography has been recognized as the preferred imaging modality for both preoperative planning and postoperative follow-up of endovascular repair of abdominal aortic aneurysm (AAA) . The diagnostic value of CT angiography has been significantly enhanced with the recent development of multislice CT (MSCT) technique, beginning from initial 4-slice CT to 16-slice, and to the latest 64-slice, dual-source, or even more detector row CT scanners . Despite its advantages of MSCT angiography, the main concern is radiation exposure associated with the CT scans because radiation dose is gradually increased with the increased number of detector rows and reduction of detector size. Minimization of radiation exposure is of paramount importance for the patients treated with endovascular repair because these patients are normally followed with a series of CT scans during the rest of their life to check the position or integrity of aortic stent grafts and exclude any possible complications arising from the endovascular repair. Therefore, the purpose of this study was to investigate the strategies to reduce radiation dose while achieving diagnostic quality images in aortic stent grafting using dual-source CT scans, based on an in vitro aorta phantom study.
In particular, we were interested examining the relationship between image noise (defined as the standard deviation) visualized on three-dimensional (3D) surface rendered images, virtual intravascular endoscopy (VIE) of aortic ostium, as well as signal-to-noise ratio (SNR) and contrast-to-noise ratio (CNR), which were measured on two-dimensional (2D) axial images acquired with variable scanning protocols. VIE has been previously reported valuable for assessment of the treatment outcomes of endovascular repair of patients with AAA . In this study, we applied the same methodology to perform a series of scans on the aorta phantom, but using the latest CT technique, dual-source CT. Because CT has become a routine imaging modality and more and more clinical centers are replacing older generation of CT scanners with the recent multislice CT models, it is expected that the study outcomes have practical applications for optimization of the MSCT scanning protocols in the daily clinical practice.
Materials and methods
Human Aorta Phantom and MSCT Scanning Protocols
Get Radiology Tree app to read full this article<

Get Radiology Tree app to read full this article<
Get Radiology Tree app to read full this article<
Generation of 3D Virtual Intravascular Endoscopy Images
Get Radiology Tree app to read full this article<
Quantitative Assessment of Image Quality Based on 2D Images
Get Radiology Tree app to read full this article<

Get Radiology Tree app to read full this article<
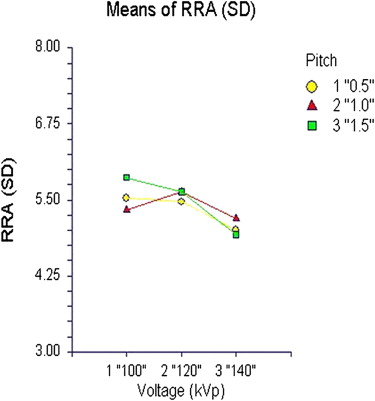
Quantitative Assessment of Image Quality Based on 3D VIE Images
Get Radiology Tree app to read full this article<
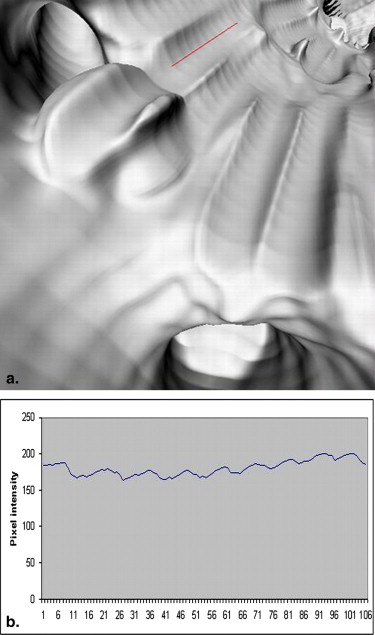
Get Radiology Tree app to read full this article<
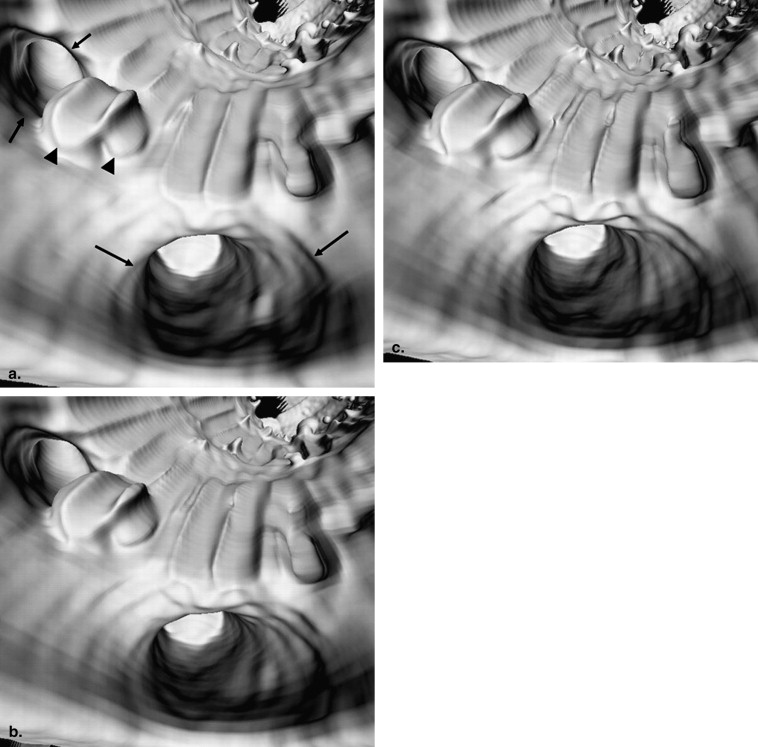
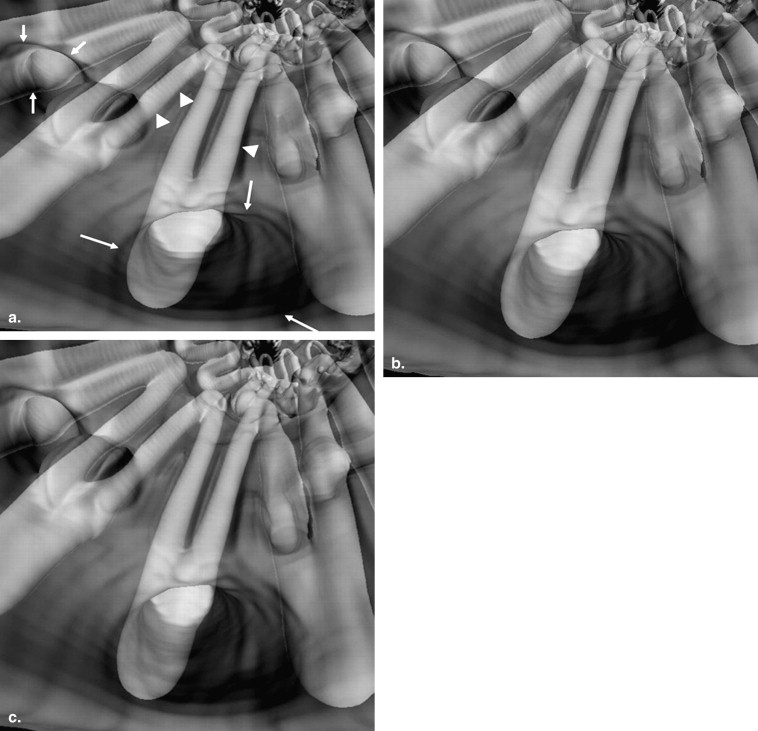
Subjective Analysis: Appearance of Aortic Ostia and Stent Wires
Get Radiology Tree app to read full this article<
Get Radiology Tree app to read full this article<
Get Radiology Tree app to read full this article<
Radiation Dose Measurements
Get Radiology Tree app to read full this article<
Statistical Analysis
Get Radiology Tree app to read full this article<
Results
Comparison of Radiation Dose
Get Radiology Tree app to read full this article<
Table 1
Dual source CT Angiography Scanning Protocols and Radiation Dose
Scans kVp mAs Slice thickness (mm) Pitch Reconstruction interval (mm) CTDIvol (mGy) DLP (mGycm) Effective dose (mSv) 1 100 180 1.0 0.5 0.5 7.60 133 2.00 2 100 180 1.5 0.5 0.7 7.60 125 1.88 3 100 180 2.0 0.5 1.0 7.60 136 2.04 4 100 180 1.0 1.0 0.5 7.60 133 2.00 5 100 180 1.5 1.0 0.7 7.60 125 1.88 6 100 180 2.0 1.0 1.0 7.60 136 2.04 7 100 180 1.0 1.5 0.5 7.60 133 2.00 8 100 180 1.5 1.5 0.7 7.60 125 1.88 9 100 180 2.0 1.5 1.0 7.60 136 2.04 10 120 150 1.0 0.5 0.5 10.82 161 2.42 11 120 150 1.5 0.5 0.7 10.82 177 2.66 12 120 150 2.0 0.5 1.0 10.82 194 2.91 13 120 150 1.0 1.0 0.5 10.82 161 2.42 14 120 150 1.5 1.0 0.7 10.82 177 2.66 15 120 150 2.0 1.0 1.0 10.82 194 2.91 16 120 150 1.0 1.5 0.5 10.82 161 2.42 17 120 150 1.5 1.5 0.7 10.82 177 2.66 18 120 150 2.0 1.5 1.0 10.82 194 2.91 19 140 100 1.0 0.5 0.5 10.84 165 2.48 20 140 100 1.5 0.5 0.7 10.84 178 2.67 21 140 100 2.0 0.5 1.0 10.84 194 2.91 22 140 100 1.0 1.0 0.5 10.84 165 2.48 23 140 100 1.5 1.0 0.7 10.84 178 2.67 24 140 100 2.0 1.0 1.0 10.84 194 2.91 25 140 100 1.0 1.5 0.5 10.84 165 2.48 26 140 100 1.5 1.5 0.7 10.84 178 2.67 27 140 100 2.0 1.5 1.0 10.84 194 2.91
CTDIvol, volume computed tomography dose index; CT, computed tomography; DLP, dose length product; mSv, millisievert.
Get Radiology Tree app to read full this article<
Comparison of Image Noise and SNR/CNR
Get Radiology Tree app to read full this article<
Get Radiology Tree app to read full this article<
Get Radiology Tree app to read full this article<
![Figure 6, Relationship between image quality (signal-to-noise ratio [SNR]) and variable kVp ranges. The mean SNR measured at the renal arteries reached significant difference with kVp changes, especially between 100 kVp and 140 kVp, but was independent of pitch changes.](https://storage.googleapis.com/dl.dentistrykey.com/clinical/DualsourceCTAngiographyinAorticStentGrafting/5_1s20S1076633210001571.jpg)
![Figure 7, Relationship between image quality (signal-to-noise ratio [SNR]) and variable slice thicknesses. The mean SNR measured at the renal arteries was significantly different when the slice thickness changed.](https://storage.googleapis.com/dl.dentistrykey.com/clinical/DualsourceCTAngiographyinAorticStentGrafting/6_1s20S1076633210001571.jpg)
Get Radiology Tree app to read full this article<
Get Radiology Tree app to read full this article<
![Figure 8, Relationship between image quality (contrast-to-noise ratio [CNR]) and variable kVp ranges. The mean CNR measured at the aortic aneurysm was determined by the kVp changes, but was independent of pitch changes.](https://storage.googleapis.com/dl.dentistrykey.com/clinical/DualsourceCTAngiographyinAorticStentGrafting/7_1s20S1076633210001571.jpg)
![Figure 9, Relationship between image quality (contrast-to-noise ratio [CNR]) and variable slice thicknesses. The CNR measured at the renal arteries was determined by the slice thickness, but was independent of pitch changes.](https://storage.googleapis.com/dl.dentistrykey.com/clinical/DualsourceCTAngiographyinAorticStentGrafting/8_1s20S1076633210001571.jpg)
Get Radiology Tree app to read full this article<
Get Radiology Tree app to read full this article<
Get Radiology Tree app to read full this article<
Get Radiology Tree app to read full this article<
Get Radiology Tree app to read full this article<
Discussion
Get Radiology Tree app to read full this article<
Get Radiology Tree app to read full this article<
Get Radiology Tree app to read full this article<
Get Radiology Tree app to read full this article<
Get Radiology Tree app to read full this article<
Get Radiology Tree app to read full this article<
Get Radiology Tree app to read full this article<
Get Radiology Tree app to read full this article<
Acknowledgment
Get Radiology Tree app to read full this article<
References
1. Armerding M.D., Rubin G.D., Beaulieu C.F., et. al.: Aortic aneurysmal disease: assessment of stent-grafted treatment-CT versus conventional angiography. Radiology 2000; 215: pp. 138-146.
2. Rydberg J., Kopecky K.K., Lalka S.G., et. al.: Stent grafting of abdominal aortic aneurysms: pre-and postoperative evaluation with multislice helical CT. J Comput Assist Tomogr 2001; 25: pp. 580-586.
3. Nieman K., Oudkerk M., Rensing B.J., et. al.: Coronary angiography with multi-slice computed tomography. Lancet 2001; 357: pp. 599-603.
4. Raff G.L., Gallagher M.J., O’Neill W.W., et. al.: Diagnostic accuracy of non-invasive coronary angiography using 64-slice spiral computed tomography. J Am Coll Cardiol 2005; 46: pp. 552-557.
5. Flohr T.G., McCollough C.H., Bruder H., et. al.: First performance evaluation of a dual source CT (DSCT) system. Eur Radiol 2006; 16: pp. 256-268.
6. Sun Z., Winder J., Kelly B., et. al.: Diagnostic value of CT virtual intravascular endoscopy in aortic stent grafting. J Endovasc Ther 2004; 11: pp. 13-25.
7. Sun Z., Taylor C.: Optimal scanning protocol of multislice CT virtual intravascular endoscopy in pre-aortic stent grafting: in vitro phantom study. Eur J Radiol 2006; 58: pp. 310-316.
8. Sun Z., Gallagher E.: Multislice CT virtual intravascular endoscopy for abdominal aortic aneurysm stent grafts. J Vasc Intervent Radiol 2004; 15: pp. 961-970.
9. Menzel H.G., Schibilla H., Teunen D.: European guidelines on quality criteria for computed tomography, publications, EUR 16162 EN.2000.European CommissionLuxembourg
10. Baumuller S., Leschka S., Desbiolles L., et. al.: Dual-source versus 64-section CT coronary angiography at lower heart rates: comparison of accuracy and radiation dose. Radiology 2009; 253: 56–64
11. Leber A.W., Johnson T., Becker A., et. al.: Diagnostic accuracy of dual-source multi-slice CT coronary angiography in patients with an intermediate pretest likelihood for coronary artery disease. Eur Heart J 2007; 28: pp. 2354-2360.
12. Huda W., Scalzetti E.M., Levin G.: Technique factors and image quality as function of patient weight at abdominal CT. Radiology 2000; 217: pp. 430-435.
13. Leschka S., Stolzmann P., Schimid F.T., et. al.: Low kilovoltage cardiac dual-source CT: attenuation, noise, and radiation dose. Eur Radiol 2008; 18: pp. 1809-1817.
14. Hausleiter J., Meyer T., Hadamitzky M., et. al.: Radiation dose estimates from cardiac multislice computed tomography in daily practice. Circulation 2006; 113: pp. 1305-1310.
15. Pflederer T., Rudofsky L., Ropers D., et. al.: Image quality in a low radiation exposure protocol for retrospectively ECG-gated coronary CT angiography. AJR Am J Roentgenol 2009; 192: pp. 1045-1050.
16. Park E.A., Lee W., Kang J.H., et. al.: The image quality and radiation dose of 100-kVp versus 120-kVp ECG-gated 16-slice CT coronary angiography. Korean J Radiol 2009; 10: pp. 235-243.
17. Sun Z.: Multislice CT angiography in post-aortic stent grafting: optimization of scanning protocols for virtual intravascular endoscopy. Int J CARS 2008; 3: pp. 19-26.
18. Achenbach S., Marvan M., Ropers D., et. al.: Coronary computed tomography angiography with a consistent dose below 1 mSv using prospective electrocardiogram-triggered high-pitch spiral acquisition. Eur Heart J 2010; 31: pp. 340-346.
19. Earls J.P., Berman E.L., Urban B.A., et. al.: Prospectively gated transverse coronary CT angiography versus retrospectively gated helical technique: improved image quality and reduced radiation dose. Radiology 2008; 246: pp. 742-753.
20. Xu L., Yang L., Zhang Z., et. al.: Low-dose adaptive sequential scan for dual-source CT coronary angiography in patients with high heart rate: comparison with retrospective ECG gating. Eur J Radiol 2009; (in press)
21. Sun Z., Allen Y., Bibombe P., et. al.: Multislice CT angiography in the follow-up of fenestrated endovascular grafts: effect of slice thickness on 2D and 3D visualization of the fenestrated stents. J Endovasc Ther 2008; 15: pp. 417-426.
22. Stavropoulos S.W., Clark T.W.I., Carpenter J.P., et. al.: Use of CT angiography to classify endoleaks after endovascular repair of abdominal aortic aneurysms. J Vasc Interv Radiol 2005; 16: pp. 663-667.