
Rationale and Objectives
Basic exploratory data analysis to evaluate enhancement and tumor size (SIZE) in contrast-enhanced breast magnetic resonance imaging (CE-MRI) during chemotherapy. Correlation with histopathology (human epidermal growth factor receptor (HER2/neu) status and estrogen receptor (ER) score).
Materials and Methods
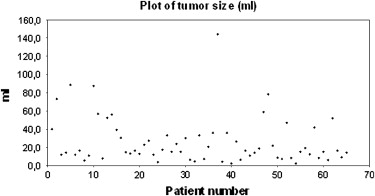
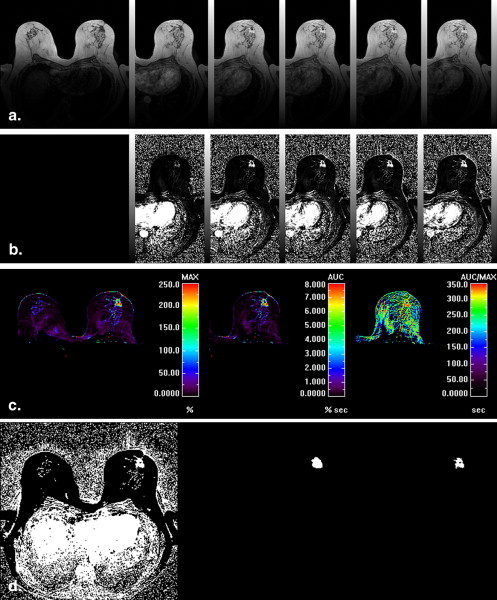
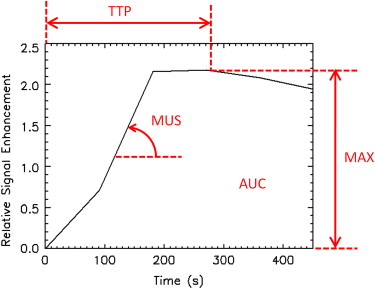
Sixty-five women (mean age 47 ± 10 years) with locally advanced breast cancer (mean SIZE 25 mL) had CE-MRI (three-dimensional fast low angle shot (FLASH); repetition time = 9.1 ms, echo time = 4.8 ms, flip angle (FA) 25°, matrix size 256 × 256 pixels, field of view 350 mm, slice thickness 2 mm, number of slices = 32, one precontrast and five postcontrast series) before and after chemotherapy. Lesion segmentation and subsequent SIZE and enhancement analysis including maximum enhancement (MAX), area under the curve (AUC), time-to-peak (TTP), and maximum upslope (MUS) were performed. Correlation with histopathology (ER score and HER2/neu status).
Results
SIZE reduced significantly during therapy (25 mL vs. 5 mL, P < .0001). AUC, MAX, MUS decreased ( P < .0001), TTP increased ( P < .0001). SIZE and MAX were independent parameters ( r 2 = .22). No correlation ( P > .01) in any of the parameters with either ER score or HER2/neu status was found. HER2/neu score equal 2+pos. or 3+ showed significantly stronger changes in SIZE ( P < .01), MAX ( P < .01) and AUC ( P < .05) compared to lower HER2/neu score (0 to 2+neg.).
Conclusions
From routine MRI protocol and semiquantitative analysis of signal enhancement curves, information about size, and hemodynamic status of tumors under treatment may be extracted. Reduction in size and maximum enhancement were complementary parameters. In the course of therapy, size and enhancement may develop differently in clinically relevant histopathological subgroups.
Neoadjuvant chemotherapy has become the standard of care for patients with locally advanced breast cancer . Therapy aims to achieve a pathological complete response or tumor reduction and increased rates of breast conserving approaches. Different clinical and pathologic staging parameters and biologic tumor markers have been identified to predict the rate of tumor response in the course of neoadjuvant chemotherapy . Therapy response is frequently described as tumor size reduction in B-mode ultrasound and mammography. There are still controversies in clinical practice on the use of contrast-enhanced breast magnetic resonance imaging (CE-MRI) and there is no international reference on breast MRI protocols . Accurate and precise tumor response quantification is critical for monitoring patient therapy and for physician’s decision-making on the patient care (ie, therapy decision regime and follow-up). In current clinical practice, tumor size remains the main parameter used to monitor tumor response to therapy . The size criterion is limited however and provides information on only one aspect of therapy response. Enhanced vessel density is an essential premise for tumor growth. Because of increased vessel density and capillary leakage, invasive cancer shows different contrast-enhancement kinetics compared to the adjacent tissue . In the course of neoadjuvant chemotherapy, the density of tumor vessels may decrease ; therefore, functional parameters are becoming subject of various investigations. Parameters describing tumor perfusion may provide additional information and may allow a better prediction of outcome. Chemotherapeutic treatments are more and more individualized in each patient, and therefore radiological diagnosis can result in therapeutic conclusions of significant importance.
Two distinct approaches have been proposed to measure such hemodynamic parameters with dynamic CE MRI (DCE-MRI) in the breast. High coverage and spatial resolution is essential for lesion detection within glandular parenchyma, and assessment of the lesion’s morphology . In addition, the tumor can be characterized to a certain extent by evaluating the shape of the signal-enhancement curve in the lesion . High temporal resolution (∼1 second) might support a more accurate quantification of perfusion and permeability parameters , but coverage is limited to a small number of slices. To combine the benefits of both alternatives, a dual-bolus protocol has been proposed in which the first bolus is monitored at low temporal resolution for localization and curve-type classification, and the second bolus is measured rapidly at the slice position of the detected lesion(s) to allow for more complete and accurate characterization
Get Radiology Tree app to read full this article<
Get Radiology Tree app to read full this article<
Get Radiology Tree app to read full this article<
Research design and methods
Get Radiology Tree app to read full this article<
Study Population
Get Radiology Tree app to read full this article<
![Figure 1, Frequencies of different chemotherapeutic treatments. ECT: 4 × epirubicin/cyclophosphamide (90/600 mg/m 2 ) − 4 × paclitaxel (175 mg/m 2 ); TAC: 6 × docetaxel/doxorubicin/cyclophosphamide (75/500/50 mg/m 2 body surface [BS]); EC-DH = 4 × epirubicin/cyclophosphamide (90/600 mg/m 2 BS) − 4 × docetaxel (100 mg/m 2 BS) + Herceptin 8 mg/kg kg (initial 6 mg/kg kg); EC-D: 4 × epirubicin/cyclophosphamide (90/600 mg/m 2 BS) − 4 × docetaxel (100 mg/m 2 BS); E-T-CMF: 3 × epirubicin (150 mg/m 2 BS) − 3 × Paclitaxel (225 mg/m 2 BS) − 3 × cyclophosphamide/methotrexate/5 Fluorouracil (500/40/600 mg/m 2 BS); ETC: 3 × epirubicin (150 mg/m 2 BS) q2w − 3 × Paclitaxel (225 mg/m 2 BS) q2w − 3 × cyclophosphamide (2000 mg/m 2 BS) q2w; FEC-D: 3 × 5-Fluorouracil/epirubicin/cyclophosphamide (500/100/500 mg/m 2 BS) − 3 × Docetaxel (100 mg/m 2 BS); Carb T: Carboplatin area under the curve 5/Paclitaxel 175 mg/m 2 BS.](https://storage.googleapis.com/dl.dentistrykey.com/clinical/DynamicBreastMRIintheCourseofNeoadjuvantChemotherapy/0_1s20S1076633209006333.jpg)
Get Radiology Tree app to read full this article<
Imaging and Patient Protocols
Get Radiology Tree app to read full this article<
Table 1
MRI Scanning Parameters
STIR T2w TSE Dynamic T1 GE NoS 32 32 32 TR 4920 4000 9.1 TE 68 71 4.8 FA 180 180 25 TI 150 Matrix 512 × 512 512 × 512 256 × 256 ST 4 mm 4 mm 2 mm
MRI, magnetic resonance imaging; NoS, number of slices; TR, repetition time; TE, echo time; FA, flip angle; TI, inversion time; ST, slice thickness; STIR, short TI inversion recovery; TSE, turbo spin echo; GE, gradient echo.
Get Radiology Tree app to read full this article<
Postprocessing
Get Radiology Tree app to read full this article<
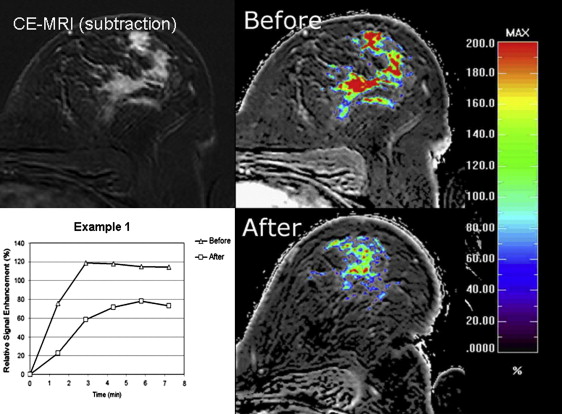
RSE(%)=100∗(SI(t)−SIpre)/SIpre R
S
E
(
%
)
=
100
∗
(
S
I
(
t
)
−
S
I
p
r
e
)
/
S
I
p
r
e
Get Radiology Tree app to read full this article<
Get Radiology Tree app to read full this article<
Get Radiology Tree app to read full this article<
Get Radiology Tree app to read full this article<
Get Radiology Tree app to read full this article<
Get Radiology Tree app to read full this article<
Reproducibility
Get Radiology Tree app to read full this article<
Histopathologic Evaluation
Get Radiology Tree app to read full this article<
Statistics
Get Radiology Tree app to read full this article<
Results
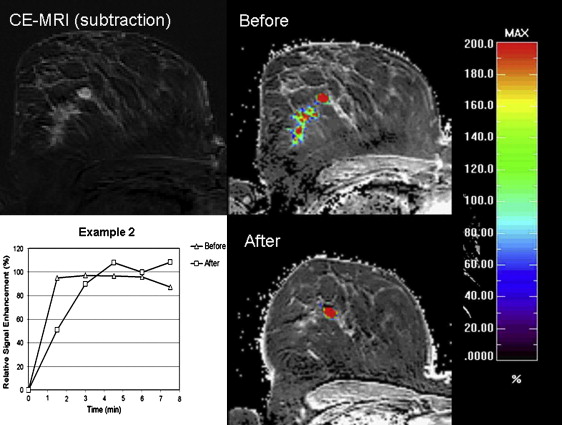
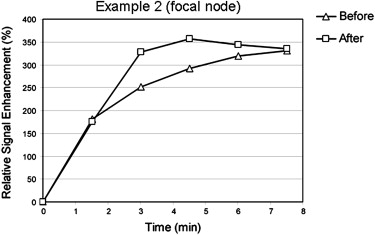
Examples
Get Radiology Tree app to read full this article<
Get Radiology Tree app to read full this article<
Get Radiology Tree app to read full this article<
Get Radiology Tree app to read full this article<
Get Radiology Tree app to read full this article<
Get Radiology Tree app to read full this article<
Reproducibility
Get Radiology Tree app to read full this article<
Table 2
Interobserver Variability: Manual Segmentation vs. Semiautomatic Segmentation Technique
Manual Segmentation Semiautomatic Segmentation Observer 1 Observer 2 Observer 1 Observer 2 Mean lesion size (mL) 14 12.8 9 8.9 Correlation ( r 2 ) 0.93 0.98
Mean segmented lesion size described in mL.
Get Radiology Tree app to read full this article<
Response to Treatment within Study Population
Get Radiology Tree app to read full this article<
Table 3
Changes of Lesion Size in the Course of Chemotherapy (all patients, n = 65)
S_P__P_ Bonferroni Lesion size −1038.5 <.0001 2.6 ∗ 10-19 Perfusion parameters Area under the curve (AUC) −1038.5 <.0001 4.4 ∗ 10-17 Maximum enhancement (ME) −1010.5 <.0001 2.2 ∗ 10-15 Maximum upslope (MUS) −998.5 <.0001 1 ∗ 10-14 AUC/ME −863.5 <.0001 .000000003 Time to maximum 345.5 <.0001 .001
S, intensity of change; P Bonferroni , corrected P values for multivariate analysis.
Get Radiology Tree app to read full this article<
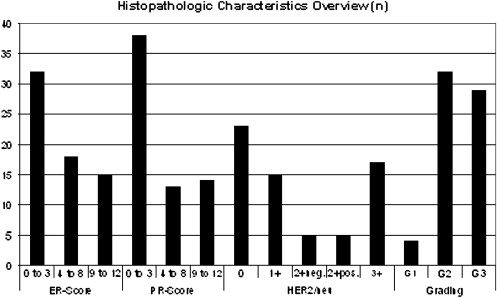
Enhancement Parameters and Histopathologic Characteristics
Get Radiology Tree app to read full this article<
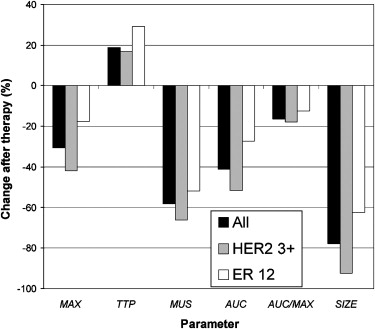
Table 4
P values of the t -test for the Changes during Therapy in each Parameter
Change during therapy (HER2/neu 2+pos./3+ vs. HER2/neu 0 to 2+neg.) - P values ( t -test) SIZE MAX AUC MUS TTP AUC/MAX_P_ values .0002 ∗∗ .008 ∗∗ .044 ∗ .32 .58 .59
Patients are subdivided into two subgroups according to HER2/neu status: one group consists of tumors which are expected to show superior response to therapy (HER2/neu 2+pos./3+), the other group consists of all others (HER2/neu 0 to 2+neg.).
Get Radiology Tree app to read full this article<
Get Radiology Tree app to read full this article<
Get Radiology Tree app to read full this article<
Tumor Size versus Enhancement
Get Radiology Tree app to read full this article<
Get Radiology Tree app to read full this article<
Discussion
Get Radiology Tree app to read full this article<
Limitations of this Study
Get Radiology Tree app to read full this article<
Get Radiology Tree app to read full this article<
Get Radiology Tree app to read full this article<
Transfer to Clinical Context
Get Radiology Tree app to read full this article<
Get Radiology Tree app to read full this article<
Get Radiology Tree app to read full this article<
Get Radiology Tree app to read full this article<
References
1. Shien T., Akashi-Tanaka S., Miyakawa K., et. al.: Clinicopathological features of tumors as predictors of the efficacy of primary neoadjuvant chemotherapy for operable breast cancer. World J Surg 2009; 33: pp. 44-51.
2. Jeruss J.S., Mittendorf E.A., Tucker S.L., et. al.: Combined use of clinical and pathologic staging variables to define outcomes for breast cancer patients treated with neoadjuvant therapy. J Clin Oncol 2008; 26: pp. 246-252.
3. Kuhl C.K.: The current status of breast MR imaging. Part I. Choice of technique, image interpretation, diagnostic accuracy, and transfer to clinical practice. Radiology 2007; 244: pp. 672-691.
4. Beresford M., Padhani A.R., Goh V., et. al.: Imaging breast cancer response during neoadjuvant systemic therapy. Expert Rev Anticancer Ther 2005; 5: pp. 893-905.
5. Makkat S., Luypaert R., Sourbron S., et. al.: Quantification of perfusion and permeability in breast tumors with a deconvolution-based analysis of second-bolus T1-DCE data. J Magn Reson Imaging 2007; 25: pp. 1159-1167.
6. Beresford M.J., Harris A.L., Ah-See M., et. al.: The relationship of the neo-angiogenic marker, endoglin, with response to neoadjuvant chemotherapy in breast cancer. Br J Cancer 2006; 95: pp. 1683-1688.
7. Kuhl C.K.: Current status of breast MR imaging. Part 2. Clinical applications. Radiology 2007; 244: pp. 672-691.
8. Kuhl C.K., Mielcareck P., Klaschik S., et. al.: Dynamic breast MR imaging: are signal intensity time course data useful for differential diagnosis of enhancing lesions?. Radiology 1999; 211: pp. 101-110.
9. Brix G., Kiessling F., Lucht R., et. al.: Microcirculation and microvasculature in breast tumors: pharmacokinetic analysis of dynamic MR image series. Magnet Res Med 2004; 52: pp. 420-429.
10. Makkat S., Luypaert R., Stadnik T., et. al.: Deconvolution-based dynamic contrast-enhanced MR imaging of breast tumors: correlation of tumor blood flow with human epidermal growth factor receptor 2 status and clinicopathologic findings—preliminary results. Radiology 2008; 249: pp. 471-482.
11. Ferretti G., Felici A., Papaldo P., et. al.: HER2/neu role in breast cancer: from a prognostic foe to a predictive friend. Curr Opin Obstet Gynecol 2007; 19: pp. 56-62.
12. Warm M., Kates R., Mallmann P., et. al.: Impact of tumor biological factors on response to pre-operative epirubicin and paclitaxel chemotherapy in primary breast cancer. Anticancer Res 2007; 27: pp. 1031-1038.
13. Chen S.C., Chang H.K., Lin Y.C., et. al.: High pathologic complete response in HER 2-positive locally advanced breast cancer after primary systemic chemotherapy with weekly docetaxel and epirubicin. Jpn J Clin Oncol 2008; 38: pp. 99-105.
14. Schlossbauer T., Leinsinger G., Wismuller A., et. al.: Classification of small contrast enhancing breast lesions in dynamic magnetic resonance imaging using a combination of morphological criteria and dynamic analysis based on unsupervised vector-quantization. Invest Radiol 2008; 43: pp. 56-64.
15. Leinsinger G., Schlossbauer T., Scherr M., et. al.: Cluster analysis of signal-intensity time course in dynamic breast MRI: does unsupervised vector quantization help to evaluate small mammographic lesions?. Eur Radiol 2006; 16: pp. 1138-1146.
16. Kim H.J., Im Y.H., Han B.K., et. al.: Accuracy of MRI for estimating residual tumor size after neoadjuvant chemotherapy in locally advanced breast cancer: relation to response patterns on MRI. Acta Oncol 2007; 46: pp. 996-1003.
17. Chou C.P., Wu M.T., Chang H.T., et. al.: Monitoring breast cancer response to neoadjuvant systemic chemotherapy using parametric contrast-enhanced MRI: a pilot study. Acad Radiol 2007; 14: pp. 561-573.
18. Sourbron S., Michaely H.J., Reiser M.F., et. al.: MRI-measurement of perfusion and glomerular filtration in the human kidney with a separable compartment model. Invest Radiol 2008; 43: pp. 40-48.
19. Makkat S., Luypaert R., Stadnik T., et. al.: Deconvolution-based dynamic contrast-enhanced MR imaging of breast tumors: correlation of tumor blood flow with human epidermal growth factor receptor 2 status and clinicopathologic findings—preliminary results. Radiology 2008; 249: pp. 471-482.
20. Remmele W., Stegner H.E.: Recommendation for uniform definition of an immunoreactive score (IRS) for immunohistochemical estrogen receptor detection (ER-ICA) in breast cancer tissue. Pathologe 1987; 8: pp. 138-140.
21. Drew P.J., Kerin M.J., Mahapatra T., et. al.: Evaluation of response to neoadjuvant chemotherapy for locally advanced breast cancer with dynamic contrast-enhanced MRI of the breast. Eur J Surg Oncol 2001; 27: pp. 617-620.
22. Cheung Y.C., Wan Y.L., Lo Y.F., et. al.: Preoperative magnetic resonance imaging evaluation for breast cancers after sonographically guided core-needle biopsy: a comparison study. Ann Surg Oncol 2004; 11: pp. 756-761.
23. Yeh E., Slanetz P., Kopans D.B., et. al.: Prospective comparison of mammography, sonography, and MRI in patients undergoing neoadjuvant chemotherapy for palpable breast cancer. Am J Roentgenol 2005; 184: pp. 868-877.
24. Akazawa K., Tamaki Y., Taguchi T., et. al.: Potential of reduction in total tumor volume measured with three-dimensional MRI as a prognostic factor for locally-advanced breast cancer patients treated with primary chemotherapy. Breast J 2008; 14: pp. 523-531.