
Rationale and Objectives
To evaluate the interchangeability of perfusion parameters between two software packages for the postprocessing of dynamic contrast-enhanced (DCE) computed tomographic images of head and neck tumors.
Materials and Methods
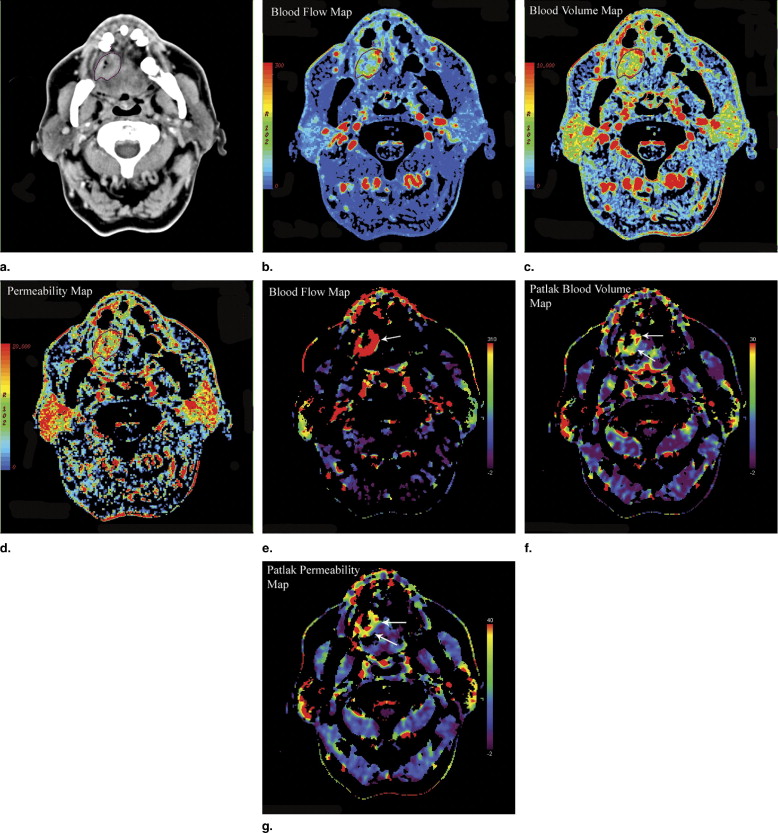
DCE computed tomographic images of 75 patients with head and neck tumors were postprocessed using a software package based on the maximum-slope approach and Patlak analysis, as well as a software package with deconvolution-based analysis incorporating an adiabatic approximation of tissue homogeneity (ATH) model. The evaluated perfusion parameters included blood flow ( F ), blood volume ( v ), and permeability–surface area product ( PS ). Region-of-interest (ROI) analysis of the tumors and the metastatic lymph nodes was performed. The perfusion parameters were compared using the Wilcoxon matched-pairs test and Bland-Altman plots.
Results
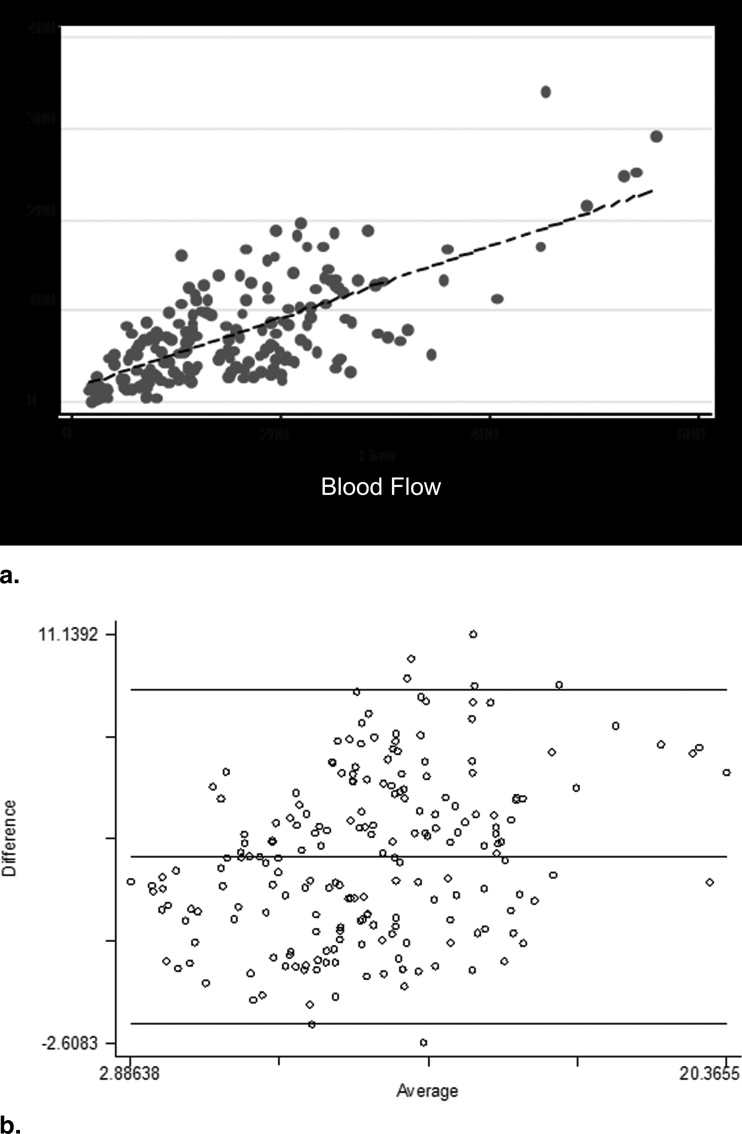
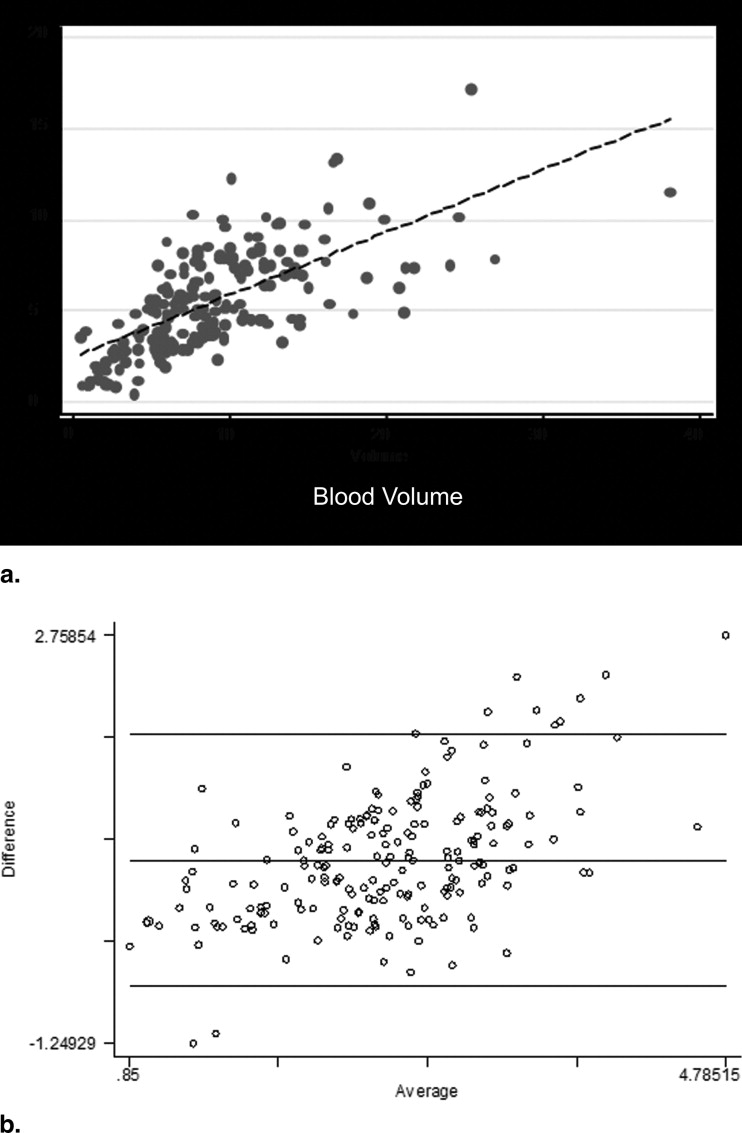
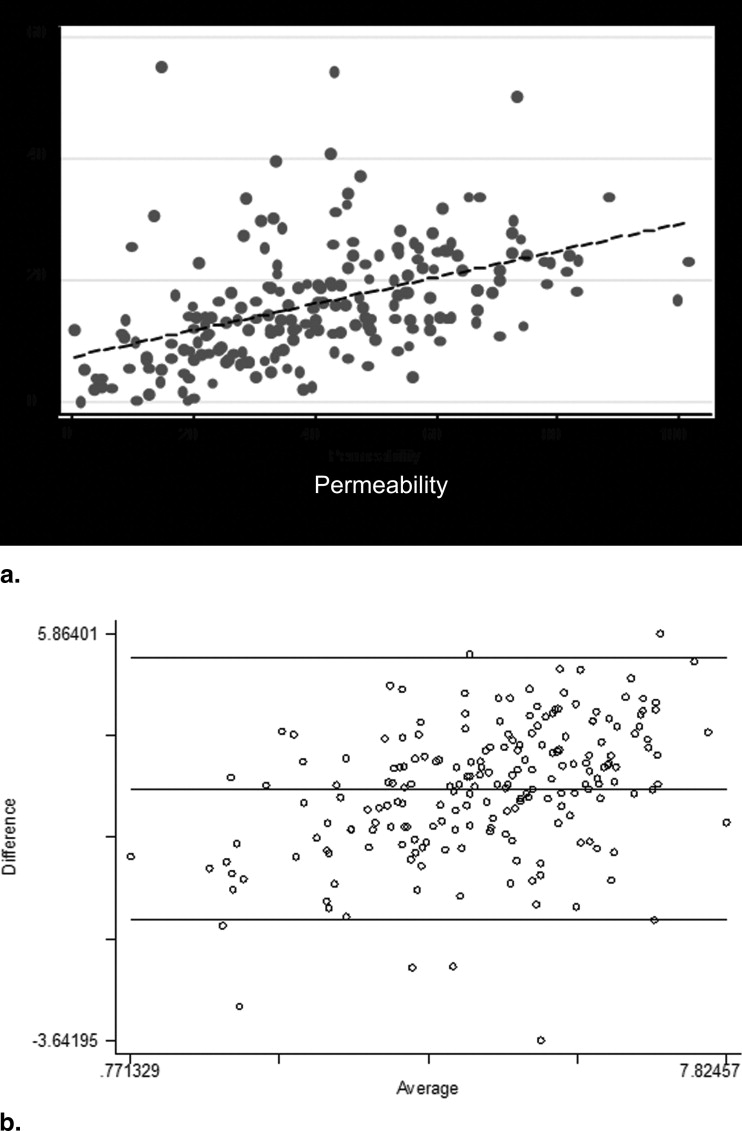
One hundred fifty-two ROIs of tumors and nodes were outlined and analyzed. Moderate to good correlations were demonstrated between the various perfusion values ( r = 0.56–0.72, P < .0001). The Wilcoxon test revealed a significant difference between the two methods ( P < .001), with the F , v , and PS values obtained using the maximum-slope approach and Patlak analysis higher than those obtained using deconvolution-based analysis with the assumptions of the ATH model. The Bland-Altman plots for F and v values revealed a proportionality trend with outliers, which were strongly associated with the magnitudes of the parameters. Analysis of the PS values did not show any systematic bias.
Conclusion
There were significant differences in the perfusion parameters obtained using the two software packages, and thus, these parameters are not directly interchangeable.
Since the proposal of dynamic contrast-enhanced (DCE) computed tomography (CT) to assess tissue perfusion in the late 1970s, developments in multislice computed tomographic technology have allowed DCE CT to achieve better coverage as well as higher temporal (approaching subsecond) and spatial (submillimeter) resolutions. Furthermore, advances in antiangiogenesis therapy for tumors have drawn more attention to the use of DCE CT to generate functional images of tumors, to guide therapeutic decisions, and to monitor treatment effects.
Commercially available software packages for deriving first-pass parameters using DCE CT often attempt to compute summary parameters, such as the area under the curve and time to peak, whereas other, more theoretical approaches are based on assumptions such as an initial time interval with no venous outflow, a single pass of tracer with no recirculation, and no efflux of tracer back into the capillaries ( ). More recently, deconvolution approaches that derive physiologic parameters from the impulse residue function, R ( t ), of the tissue have been increasingly used ( ). The numerical deconvolution method has been the method of choice in several studies reported recently in the literature on head and neck perfusion imaging ( ). However, numerical deconvolution is very sensitive to noise and thus requires regularization, which imposes assumptions on the noise present or the desirable shape of R ( t ) ( ). The tracer extravasation parameters, which are strongly associated with the phenomenon of neoangiogenesis, are currently assessed using two distinct approaches in commercial software packages: (1) Patlak analysis and (2) deconvolution analysis on the basis of an adiabatic approximation of tissue homogeneity (ATH) model ( ).
Get Radiology Tree app to read full this article<
Get Radiology Tree app to read full this article<
Materials and methods
Patients
Get Radiology Tree app to read full this article<
Perfusion Computed Tomographic Imaging Protocol
Get Radiology Tree app to read full this article<
Get Radiology Tree app to read full this article<
Postprocessing of the Perfusion Computed Tomographic Data
Get Radiology Tree app to read full this article<
Get Radiology Tree app to read full this article<
Get Radiology Tree app to read full this article<
Get Radiology Tree app to read full this article<
Statistical Analysis
Get Radiology Tree app to read full this article<
Results
Get Radiology Tree app to read full this article<
Get Radiology Tree app to read full this article<
Blood Flow
Get Radiology Tree app to read full this article<
Get Radiology Tree app to read full this article<
Blood Volume
Get Radiology Tree app to read full this article<
Get Radiology Tree app to read full this article<
Permeability Values
Get Radiology Tree app to read full this article<
Get Radiology Tree app to read full this article<
Discussion
Get Radiology Tree app to read full this article<
Get Radiology Tree app to read full this article<
Get Radiology Tree app to read full this article<
Get Radiology Tree app to read full this article<
Get Radiology Tree app to read full this article<
Get Radiology Tree app to read full this article<
Get Radiology Tree app to read full this article<
Appendix
Theoretical Background
Get Radiology Tree app to read full this article<
Get Radiology Tree app to read full this article<
Deconvolution Analysis Based on the Central Volume Principle and an ATH Model
Get Radiology Tree app to read full this article<
Q(t)=FCa(t)⊗R(t)=Ca(t)⊗FR(t), Q
(
t
)
=
F
C
a
(
t
)
⊗
R
(
t
)
=
C
a
(
t
)
⊗
F
R
(
t
),
where ⊗ is the convolution operator.
Get Radiology Tree app to read full this article<
Get Radiology Tree app to read full this article<
Get Radiology Tree app to read full this article<
Get Radiology Tree app to read full this article<
E=1−e−PSF. E
=
1
−
e
−
P
S
F
.
Get Radiology Tree app to read full this article<
Maximum-Slope Model and Patlak Graphic Analysis
Get Radiology Tree app to read full this article<
Q(t)=F∫t0Ca(t)dt−F∫t0Cv(t)dt, Q
(
t
)
=
F
∫
0
t
C
a
(
t
)
d
t
−
F
∫
0
t
C
v
(
t
)
d
t
,
where F is blood flow to the tissue. Assuming time t to be less than the minimum transit time needed for the contrast medium to traverse the tissue region and that all of the injected contrast medium will remain within the tissue (with no venous outflow), it is obvious that
dQ(t)dt=FCa(t), d
Q
(
t
)
d
t
=
F
C
a
(
t
),
from which F can be calculated as
F=dQ(t)dtCa(t), F
=
d
Q
(
t
)
d
t
C
a
(
t
)
,
or equivalently as
F=maximum initial slope ofQ(t)peak height ofCa(t). F
=
maximum initial slope of
Q
(
t
)
peak height of
C
a
(
t
)
.
Q ( t ) and C a ( t ) can be estimated from the tissue and arterial tissue density curves, respectively ( ).
Get Radiology Tree app to read full this article<
Get Radiology Tree app to read full this article<
Q(t)=VbCa(t)+K∫t0Ca(u)du. Q
(
t
)
=
V
b
C
a
(
t
)
+
K
∫
0
t
C
a
(
u
)
d
u
.
Get Radiology Tree app to read full this article<
Get Radiology Tree app to read full this article<
Get Radiology Tree app to read full this article<
References
1. Peters A.M., Brown J., Hartnell G.G., Myers M.J., Haskell C., Lavender J.P.: Non-invasive measurement of renal blood flow with 99mTc DTPA: comparison with radiolabelled microspheres. Cardiovasc Res 1987; 21: pp. 830-834.
2. Miles K.A.: Measurement of tissue perfusion by dynamic computed tomography. Br J Radiol 1991; 64: pp. 409-412.
3. Cenic A., Nabavi D.G., Craen R.A., Gelb A.W., Lee T.Y.: Dynamic CT measurement of cerebral blood flow: a validation study. AJNR Am J Neuroradiol 1999; 20: pp. 63-73.
4. Bisdas S., Baghi M., Smolarz A., et. al.: Quantitative measurements of perfusion and permeability of oropharyngeal and oral cavity cancer, recurrent disease, and associated lymph nodes using first-pass contrast-enhanced computed tomography studies. Invest Radiol 2007; 42: pp. 172-179.
5. Gandhi D., Hoeffner E.G., Carlos R.C., Case I., Mukherji S.K.: Computed tomography perfusion of squamous cell carcinoma of the upper aerodigestive tract. J Comput Assist Tomogr 2003; 27: pp. 687-693.
6. Rumboldt Z., Al-Okaili R., Deveikis J.P.: Perfusion CT for head and neck tumors: pilot study. AJNR Am J Neuroradiol 2005; 26: pp. 1178-1185.
7. Gamel J., Rousseau W.F., Katholi C.R., Mesel E.: Pitfalls in digital computation of the impulse response of vascular beds from indicator-dilution curves. Circ Res 1973; 32: pp. 516-523.
8. Patlak C.S., Blasberg R.G., Fenstermacher J.D.: Graphical evaluation of blood-to-brain transfer constants from multiple-time uptake data. J Cereb Blood Flow Metab 1983; 3: pp. 1-7.
9. St. Lawrence K.S., Lee T.Y.: An adiabatic approximation to the tissue homogeneity model for water exchange in the brain: I. Theoretical derivation. J Cereb Blood Flow Metab 1998; 18: pp. 1365-1377.
10. Goh V., Halligan S., Bartram C.I.: Quantitative tumor perfusion assessment with multidetector CT: are measurements from two commercial software packages interchangeable?. Radiology 2007; 242: pp. 777-782.
11. Bland J.M., Altman D.G.: Applying the right statistics: analyses of measurement studies. Ultrasound Obstet Gynecol 2003; 22: pp. 85-93.
12. Hermans R., Lambin P., Van den Bogaert W., Haustermans K., Van der Goten A., Baert A.L.: Non-invasive tumour perfusion measurement by dynamic CT: preliminary results. Radiother Oncol 1997; 44: pp. 159-162.
13. Gandhi D., Chepeha D.B., Miller T., et. al.: Correlation between initial and early follow-up CT perfusion parameters with endoscopic tumor response in patients with advanced squamous cell carcinomas of the oropharynx treated with organ-preservation therapy. AJNR Am J Neuroradiol 2006; 27: pp. 101-106.
14. Bisdas S., Baghi M., Wagenblast J., et. al.: Differentiation of benign and malignant parotid tumors using deconvolution-based perfusion CT imaging: feasibility of the method and initial results. Eur J Radiol 2007; 64: pp. 258-265.
15. Hermans R., Lambin P., Van der Goten A., et. al.: Tumoural perfusion as measured by dynamic computed tomography in head and neck carcinoma. Radiother Oncol 1999; 53: pp. 105-111.
16. Hermans R., Meijerink M., Van den Bogaert W., Rijnders A., Weltens C., Lambin P.: Tumor perfusion rate determined noninvasively by dynamic computed tomography predicts outcome in head-and-neck cancer after radiotherapy. Int J Radiat Oncol Biol Phys 2003; 57: pp. 1351-1356.
17. Miles K.A., Griffiths M.R.: Perfusion CT: a worthwhile enhancement?. Br J Radiol 2003; 76: pp. 220-231.
18. Hu C.H., Wu Q.D., Hu X.Y., Fang X.M., Zhang T.H., Ding Y.: Hemodynamic studies on brain CT perfusion imaging with varied injection rates. Clin Imaging 2007; 31: pp. 151-154.
19. Blomley M.J., Coulden R., Bufkin C., Lipton M.J., Dawson P.: Contrast bolus dynamic computed tomography for the measurement of solid organ perfusion. Invest Radiol 1993; 28: pp. S72-S77.
20. Koenig M., Klotz E., Luka B., Venderink D.J., Spittler J.F., Heuser L.: Perfusion CT of the brain: diagnostic approach for early detection of ischemic stroke. Radiology 1998; 209: pp. 85-93.
21. Kiessling F., Boese J., Corvinus C., et. al.: Perfusion CT in patients with advanced bronchial carcinomas: a novel chance for characterization and treatment monitoring?. Eur Radiol 2004; 14: pp. 1226-1233.
22. Miles K.A.: Perfusion CT for the assessment of tumour vascularity: which protocol?. Br J Radiol 2003; 76: pp. S36-S42.
23. Daldrup-Link H.E., Rydland J., Helbich T.H., et. al.: Quantification of breast tumor microvascular permeability with feruglose-enhanced MR imaging: initial phase II multicenter trial. Radiology 2003; 229: pp. 885-892.
24. Goh V., Halligan S., Hugill J.A., Gartner L., Bartram C.I.: Quantitative colorectal cancer perfusion measurement using dynamic contrast-enhanced multidetector-row computed tomography: effect of acquisition time and implications for protocols. J Comput Assist Tomogr 2005; 29: pp. 59-63.
25. Axel L.: Cerebral blood flow determination by rapid-sequence computed tomography: theoretical analysis. Radiology 1980; 137: pp. 679-686.
26. Meier P., Zierler K.L.: On the theory of the indicator-dilution method for measurement of blood flow and volume. J Appl Physiol 1954; 6: pp. 731-744.
27. Ostergaard L., Weisskoff R.M., Chesler D.A., Gyldensted C., Rosen B.R.: High resolution measurement of cerebral blood flow using intravascular tracer bolus passages. Magn Reson Med 1996; 36: pp. 715-725.
28. Ostergaard L., Sorensen A.G., Kwong K.K., Weisskoff R.M., Gyldensted C., Rosen B.R.: High resolution measurement of cerebral blood flow using intravascular tracer bolus passages. Magn Reson Med 1996; 36: pp. 726-736.
29. Bisdas S., Donnerstag F., Ahl B., Bohrer I., Weissenborn K., Becker H.: Comparison of perfusion computed tomography with diffusion-weighted magnetic resonance imaging in hyperacute ischemic stroke. J Comput Assist Tomogr 2004; 28: pp. 747-755.
30. Eastwood J.D., Lev M.H., Wintermark M., et. al.: Correlation of early dynamic CT perfusion imaging with whole-brain MR diffusion and perfusion imaging in acute hemispheric stroke. AJNR Am J Neuroradiol 2003; 24: pp. 1869-1875.
31. Wintermark M., Reichhart M., Thiran J.P., et. al.: Prognostic accuracy of cerebral blood flow measurement by perfusion computed tomography, at the time of emergency room admission, in acute stroke patients. Ann Neurol 2002; 51: pp. 417-432.
32. Johnson J.A., Wilson T.A.: A model for capillary exchange. Am J Physiol 1966; 210: pp. 1299-1303.
33. Larson K.B., Markham J., Raichle M.E.: Tracer-kinetic models for measuring cerebral blood flow using externally detected radiotracers. J Cereb Blood Flow Metab 1987; 7: pp. 443-463.
34. Peters A.M., Gunasekera R.D., Henderson B.L., et. al.: Noninvasive measurement of blood flow and extraction fraction. Nucl Med Commun 1987; 8: pp. 823-837.
35. Konig M., Klotz E., Heuser L.: Cerebral perfusion CT: theoretical aspects, methodical implementation and clinical experience in the diagnosis of ischemic cerebral infarction. Rofo 2000; 172: pp. 210-218.