
Rationale and Objectives
Evaluate qualitative dynamic contrast-enhanced magnetic resonance imaging (MRI) characteristics of normal central zone based on recently described central zone MRI features.
Materials and Methods
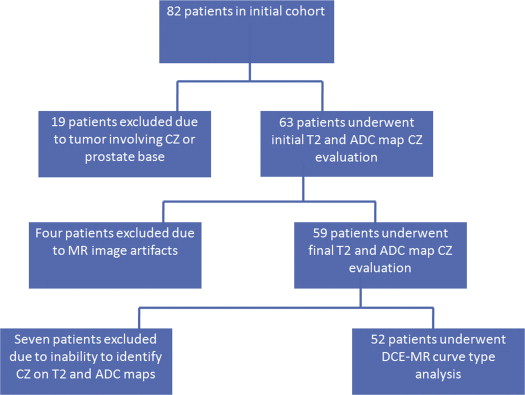
Institutional review board–approved, Health Insurance Portability and Accountability Act compliant study, 59 patients with prostate cancer, histopathology proven to not involve central zone or prostate base, underwent endorectal MRI before prostatectomy. Two readers independently reviewed T2-weighted images and apparent diffusion coefficient (ADC) maps identifying normal central zone based on low signal intensity and location. Next, two readers drew bilateral central zone regions of interest on dynamic contrast-enhanced magnetic resonance images in consensus and independently recorded enhancement curve types as type 1 (progressive), type 2 (plateau), and type 3 (wash-out). Identification rates of normal central zone and enhancement curve type were recorded and compared for each reviewer. The institutional review board waiver was approved and granted 05/2010.
Results
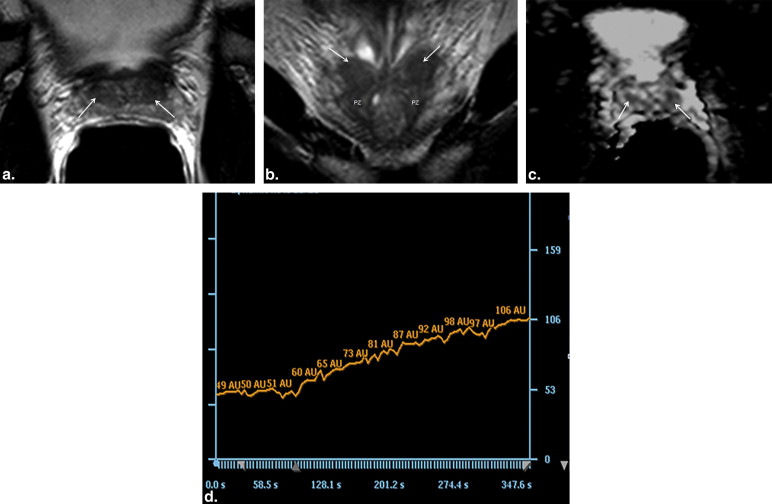
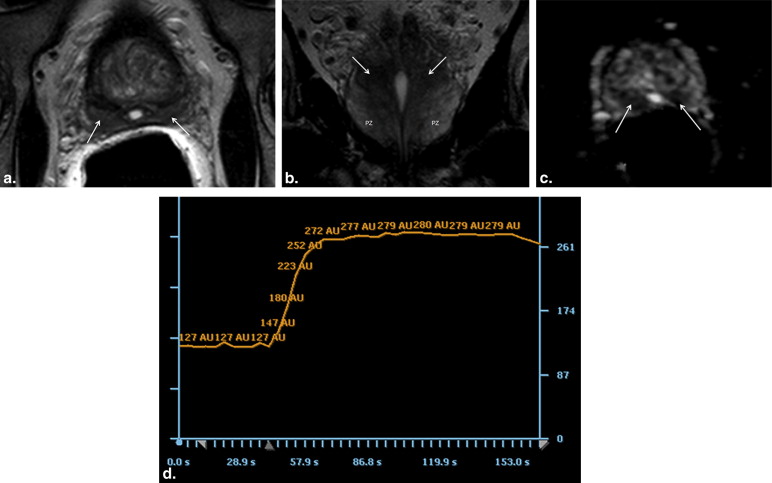
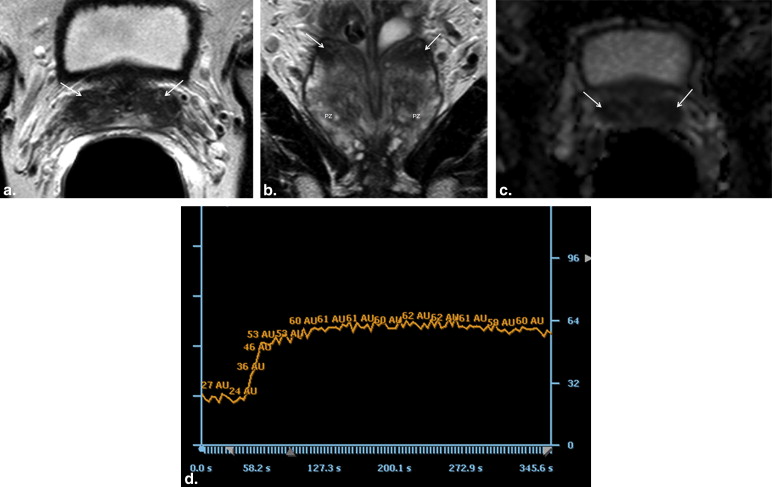
Central zone identified in 92%–93% of patients on T2-weighted images and 78%–88% on ADC maps without significant difference between identification rates ( P = .63 and P = .15 and inter-reader agreement (κ) is 0.64 and 0.29, for T2-weighted images and ADC maps, respectively). All central zones were rated either curve type 1 or curve type 2 by both radiologists. No statistically significant difference between the two radiologists ( P = .19) and inter-reader agreement was κ = 0.37.
Conclusions
Normal central zone demonstrates either type 1 (progressive) or type 2 (plateau) enhancement curves on dynamic contrast-enhanced MRI that can be potentially useful to differentiate central zone from prostate cancer that classically demonstrates a type 3 (wash-out) enhancement curve.
McNeal’s model of prostate anatomy is now over a quarter century old and widely accepted by pathologists, urologists, and radiologists who are involved in the management of prostate cancer (PCa) . According to McNeal, the prostate can be divided into three glandular zones (peripheral zone [PZ], transition zone [TZ], and central zone [CZ]) and one nonglandular zone (anterior fibromuscular stroma) based on histology, anatomic location, and embryologic features . TZ refers to the bilateral regions in the mid to base of the gland, which form two bulges on either side of the urethra that extend superiorly, anteriorly, and laterally from the verumontanum. The CZ is a flattened conical structure located posterior to the TZ and surrounds the ejaculatory ducts ( Fig 1 ). Embryologically, CZ derives from the Wolffian duct whereas TZ is a derivative of the urogenital sinus .
 Open full size image
Figure 1
Coronal prostate diagram adapted from McNeal’s model of prostate anatomy demonstrating the conical-shaped CZ extending from the base of the prostate to the level of the verumontanum. CZ, central zone; DU, distal urethra; E, ejaculatory duct; PZ, peripheral zone; V = verumontanum.
Get Radiology Tree app to read full this article<
Get Radiology Tree app to read full this article<
Get Radiology Tree app to read full this article<
Get Radiology Tree app to read full this article<
Materials and methods
Study Patients
Get Radiology Tree app to read full this article<
Get Radiology Tree app to read full this article<
MRI Protocols
Get Radiology Tree app to read full this article<
MRI Analysis
Analysis of T2-weighted images and ADC maps
Get Radiology Tree app to read full this article<
Get Radiology Tree app to read full this article<
Get Radiology Tree app to read full this article<
DCE-MRI Analysis
Get Radiology Tree app to read full this article<
Statistical Analysis
Get Radiology Tree app to read full this article<
Results
Identification of Normal CZ on T2-weighted Images and ADC Maps
Get Radiology Tree app to read full this article<
Table 1
CZ Identification Rates on T2-weighted Images and on ADC Maps
Modality Radiologist CZ Detection Rate (%) [95% Confidence Interval] T2-weighted A 93 (55/59) [84%–98%] B 92 (54/59) [81%–97%] ADC map A 88 (52/59) [77%–95%] B 78 (46/59) [65%–88%]
ADC, apparent diffusion coefficient; CZ, central zone.
Table 2
Agreement in CZ Identification on T2-weighted Images between the Two Radiologists
Radiologist B Identified Not Total A Identified 53 2 55 Not 1 3 4 Total 54 5 59
CZ, central zone.
Table 3
Agreement in CZ Identification on ADC Maps between the Two Radiologists
Radiologist B Identified Not Total A Identified 43 9 52 Not 3 4 7 Total 46 13 59
ADC, apparent diffusion coefficient; CZ, central zone.
Get Radiology Tree app to read full this article<
DCE-MRI Analysis
Get Radiology Tree app to read full this article<
Table 4
Agreement in DCE Time Curve Analysis between the Two Radiologists
Radiologist B Type 1 Type 2 Type 3 Total A Type 1 10 14 0 24 Type 2 7 73 0 80 Type 3 0 0 0 0 Total 17 87 0 104
DCE, dynamic contrast-enhanced.
Get Radiology Tree app to read full this article<
Discussion
Get Radiology Tree app to read full this article<
Get Radiology Tree app to read full this article<
Get Radiology Tree app to read full this article<
Get Radiology Tree app to read full this article<
Get Radiology Tree app to read full this article<
Get Radiology Tree app to read full this article<
Appendix
GE Healthcare Unit Protocol
Get Radiology Tree app to read full this article<
Philips Healthcare Unit Protocol
Get Radiology Tree app to read full this article<
Get Radiology Tree app to read full this article<
Get Radiology Tree app to read full this article<
References
1. Villers A., Steg A., Boccon-Gibod L.: Anatomy of the prostate: review of the different models. Eur Urol 1991; 20: pp. 261-268.
2. McNeal J.E.: Prostate.Mills S.E.Histology for the pathologist.2007.Lippincott Williams and WilkinsPhiladelphia:pp. p923-p963. Chapter 36
3. Jaffe W.I., Kaplan S.A., McConnell J.D.: Epidemiology and pathophysiology of benign prostatic hyperplasia.Scardino P.T.Slawin K.M.Atlas of the prostate.2006.Current Medicine LLCHong Kong:pp. p2-11. Chapter 1
4. McNeal J.E.: The zonal anatomy of the prostate. The prostate 1981; 2: pp. 35-49.
5. Quick C.M., Gokden N., Sangoi A.R., et. al.: The distribution of PAX-2 immunoreactivity in the prostate gland, seminal vesicle, and ejaculatory duct: comparison with prostatic adenocarcinoma and discussion of prostatic zonal embryogenesis. Hum Pathol 2010; 41: pp. 1145-1149.
6. McNeal J.E.: Normal histology of the prostate. Am J Surg Pathol 1988; 12: pp. 619-633.
7. McNeal J.E.: Cancer volume and site of origin of adenocarcinoma in the prostate: relationship to local and distant spread. Hum Pathol 1992; 23: pp. 258-266.
8. McNeal J.E.: Normal and pathologic anatomy of the prostate. Urology 1981; 17: pp. 11-16.
9. Reese J.H., McNeal J.E., Goldenberg S.L., et. al.: Distribution of lactoferrin in the normal and inflamed human prostate: an immunohistochemical study. Prostate 1992; 20: pp. 73-85.
10. Srodon M., Epstein J.I.: Central zone histology of the prostate: a mimicker of high grade prostatic intraepithelial neoplasia. Hum Pathol 2002; 33: pp. 518-523.
11. Prayer-Galetti T., Rossi G.P., Belloni A.S., et. al.: Gene expression and autoradiographic localization of endothelin-1 and its receptors A and B in the different zones of the human prostate. J Urol 1997; 157: pp. 2334-2339.
12. Lexander H., Franzen B., Hirschberg D., et. al.: Differential protein expression in anatomical zones of the prostate. Proteomics 2005; 5: pp. 2570-2576.
13. Laczko I., Hudson D.I., Freeman A., Feneley M.R., Masters J.R.: Comparison of the zones of the human prostate with the seminal vesicle: morphology, immunohistochemistry and cell kinetics. Prostate 2005; 62: pp. 260-266.
14. Hricak H., Dooms G.C., McNeal J.E., et. al.: MR imaging of the prostate gland: normal anatomy. AJR Am J Roentgenol 1987; 148: pp. 51-58.
15. Sommer F.G., McNeal J.E., Carrol C.L.: MR depiction of zonal anatomy of the prostate at 1.5T. J Comput Assist Tomogr 1986; 10: pp. 983-989.
16. Kim C.K., Park B.K., Lee H.M., et. al.: Value of diffusion-weighted imaging for the prediction of prostate cancer location at 3T using a phased-array coil: preliminary results. Invest Radiol 2007; 42: pp. 842-847.
17. Schiebler M.L., Tomaszewski J.E., Bezzi M., et. al.: Prostatic carcinoma and benign prostatic hyperplasia: correlation of high resolution MR and histopathologic findings. Radiology 1989; 172: pp. 131-137.
18. Vargas H.A., Akin O., Franiel T., et. al.: Normal central zone of the prostate and central zone involvement by prostate cancer: clinical and MR imaging implications. Radiology 2012; 262: pp. 894-902.
19. Barentsz J.O., Richenberg J., Clements R., et. al.: ESUR prostate MR guidelines 2012. Eur Radiol 2012; 22: pp. 746-757.
20. Verma S., Turkbey B., Muradyan N., et. al.: Overview of dynamic contrast-enhanced MRI in prostate cancer management. AJR Am J Roentgenol 2012; 198: pp. 1277-1288.
21. Landis J.R., Koch G.G.: The measurement of observer agreement for categorical data. Biometrics 1977; 33: pp. 159-174.
22. Zar J.H.: Biostatistical analysis.4th ed1999.Prentice-HallNew Jersey
23. Riffenburgh R.H.: Statistics in medicine.2nd ed2006.Elsevier Academic PressAmsterdam; Bostonpp. 274.
24. Bourne R.M., Kurniawan N., Cowin G., et. al.: Microscopic diffusivity compartmentation in formalin-fixed prostate tissue. Magn Reson Med 2012; 68: pp. 614-620.
25. Engelbrecht M.R., Huisman H.J., Laheij R.J., et. al.: Discrimination of prostate cancer from normal peripheral zone and central gland tissue by using dynamic contrast-enhanced MR imaging. Radiology 2003; 229: pp. 248-254.
26. Van Dorsten F.A., Van Der Graaf M., Engelbrecht M.R., et. al.: Combined quantitative dynamic contrast-enhanced MR imaging and (1)H MR spectroscopic imaging of human prostate cancer. J Magn Reson Imaging 2004; 20: pp. 279-287.
27. Padhani A.R., Gapinksi C.J., Macvicar D.A., et. al.: Dynamic contrast-enhanced MRI of prostate cancer: correlation with morphology and tumour stage, histologic grade and PSA. Clin Radiol 2000; 55: pp. 99-109.
28. McNeal J.E., Redwine E.A., Freiha F.S., et. al.: Zonal distribution of prostatic adenocarcinoma: correlation with histologic pattern and direction of spread. Am J Surg Pathol 1988; 12: pp. 897-906.
29. Cheng L., Jones T.D., Pan C.X., et. al.: Anatomic distribution and pathologic characterization of small-volume prostate cancer (<0.5ml) in whole-mount prostatectomy specimens. Mod Pathol 2005; 18: pp. 1022-1026.
30. Chen M.E., Johnston D.A., Tang K., et. al.: Detailed mapping of prostate carcinoma foci: biopsy strategy implications. Cancer 2000; 89: pp. 1800-1809.
31. Cohen R.J., Shannon B.A., Phillips M., et. al.: Central zone carcinoma of the prostate gland: a distinct tumor type with poor prognostic features. J Urol 2008; 179: pp. 1762-1767.