
Rationale and Objectives
The aim of this study was to compare tumor signal and contrast media uptake characteristics on contrast-enhanced T1-weighted sequences at 3 Tesla over 30 minutes after double-dose administration of different contrast agents in an animal model of brain glioma.
Materials and Methods
Nine rats underwent magnetic resonance imaging (MRI) after stereotactic F98 glioma cell implantation before and repetitively for 30 minutes after injection of gadobutrol, gadopentetate, and gadobenate, respectively. Signal-to-noise ratio (SNR) and tumor contrast-to-noise ratio (CNR) were evaluated and MRI-derived tumor volumes were compared to histology.
Results
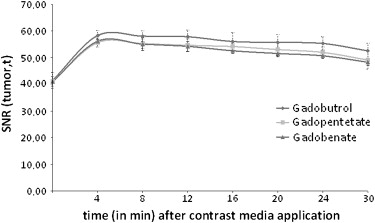
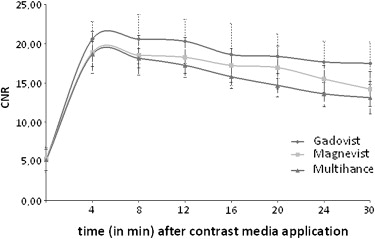
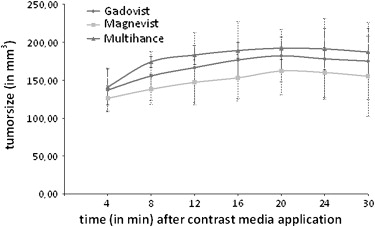
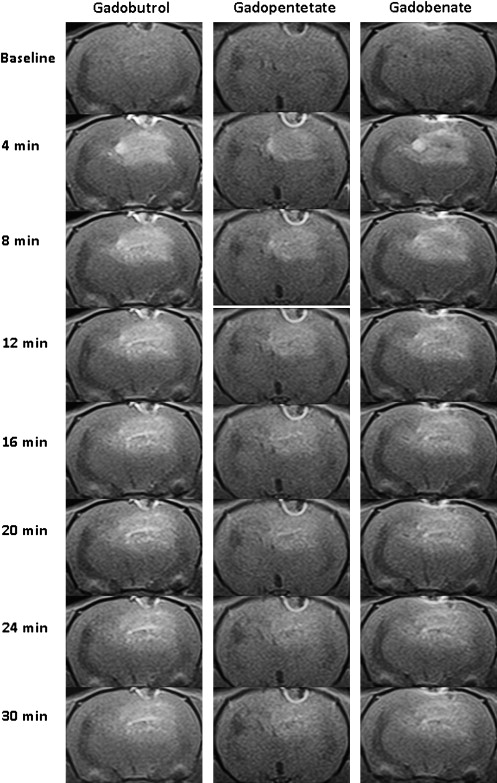
Postcontrast tumor SNR and CNR peaked at 4 minutes after contrast application. While contrast-enhancement within the tumor was fading, tumor volume increased by continuous contrast-uptake of peripheral parts between 4 minutes (137 ± 29 mm 3 , 126 ± 16 mm 3 , 141 ± 24 mm 3 ) and 20 minutes (182 ± 35 mm 3 , 164 ± 32 mm 3 , 191 ± 25 mm 3 ), respectively. At 8 and 12 minutes, 84% and 91% of the tumor volume were definable, respectively.
Conclusion
Optimal correlation between MRI-derived tumor volume and histology is achieved by imaging up to 20 minutes after contrast application. At 4 minutes (this delay is mostly used in clinical routine), only 75% of the enhancing tumor volume is assessable. A delay of 8 minutes already reveals 84% of the tumor and seems to be a practical clinical compromise.
Magnetic resonance imaging (MRI), in conjunction with injection of intravenous gadolinium-based contrast media, is the method of choice to pre- and postoperatively assess brain glioblastoma . Complete resection especially of the enhancing tumor bulk in T1-weighted sequences has to be the treatment goal, because residual tumor enhancement is known to be the most predictive prognostic factor of survival in patients with glioblastoma after additional radiation therapy . Hereby, identifiability and extent of the enhancing tumor depends on the contrast sensitivity of the applied MRI sequence, magnetic field strength, different properties of contrast media and its dosage, and the delay between contrast application and imaging. In the last years, several studies for brain metastases demonstrated, that use of double dose contrast media application, 3 Tesla MRI, and a delay of up to 20 minutes result in significantly improved detection rates and better assessment of the contrast-uptaking tumor bulk . In primary brain tumors, double-dose contrast application allows better differentiation between low- and high-grade gliomas , and a more reliable selection of representative biopsy sites . Still, systematic experimental data about the optimal delay between contrast application and imaging in brain glioma are lacking.
The low molecular paramagnetic contrast agents with low molecular weight used are gadolinium chelates. The prototypical complex of this class of agents is gadopentetate (Magnevist, Bayer Schering Pharma, Berlin, Germany), which was the first MRI contrast agent introduced into the market in 1988. In the meantime, other agents have been launched, basically showing only slight but notably different pharmacokinetic properties, resulting in comparable safety profiles and approvals for nearly the same indications.
Get Radiology Tree app to read full this article<
Materials and methods
Experimental Glioma Model
F98 glioma cell line
Get Radiology Tree app to read full this article<
Tumor induction
Get Radiology Tree app to read full this article<
Histological examination
Get Radiology Tree app to read full this article<
Study Design
Imaging
Get Radiology Tree app to read full this article<
Table 1
Animals were assigned to three different groups ( n = 3, each group) with a different contrast media sequence to avoid inaccuracy in calculating tumor volume due to ongoing growth between day 10 and day 12 after implantation
Groups Day 10 Day 11 Day 12 1 Gadobenate Gadopentetate Gadobutrol 2 Gadopentetate Gadobutrol Gadobenate 3 Gadobutrol Gadobenate Gadopentetate
Get Radiology Tree app to read full this article<
Postprocessing
Get Radiology Tree app to read full this article<
SNRbrain,t=SIbrain,t/SDair SN
R
brain,t
=
S
I
brain,t
/
S
D
air
SNRtumor,t=SItumor,t/SDair SN
R
tumor,t
=
SI
tumor,t
/
SD
air
CNR=(SItumor,post-SIbrain,post)/SDair CNR
=
(
SI
tumor,post
-
SI
brain,post
)
/
SD
air
SI tumor = tumor signal intensity at respective time point t (pre- or postcontrast), SI brain = brain signal intensity at respective time point t (pre- or postcontrast), and SD air = standard deviation (SD) of background signal.
Get Radiology Tree app to read full this article<
Get Radiology Tree app to read full this article<
Get Radiology Tree app to read full this article<
Get Radiology Tree app to read full this article<
Statistical Analysis
Get Radiology Tree app to read full this article<
Results
Get Radiology Tree app to read full this article<
Get Radiology Tree app to read full this article<
Brain SNR Values
Get Radiology Tree app to read full this article<
Table 2
Pre- and postcontrast SNR values (±SD) in normal brain tissue after double dose contrast media application
Time point of imaging Gadobutrol Gadopentetate Gadobenate Baseline 34.6 ± 2.0 34,7 ± 1.6 34.8 ± 1.8 4 minutes 37.7 ± 2.0 37.5 ± 1.7 37.6 ± 1.8 8 minutes 37.6 ± 1.8 37.4 ± 1.8 37.5 ± 1.6 12 minutes 37.5 ± 2.4 37.4 ± 1.6 37.3 ± 1.5 16 minutes 37.3 ± 2.3 37.2 ± 1.7 36.8 ± 1.3 20 minutes 37.1 ± 2.1 37.0 ± 1.3 36.8 ± 1.5 24 minutes 37.0 ± 2.2 37.0 ± 1.4 36.7 ± 1.7 30 minutes 37.0 ± 1.9 36.8 ± 1.9 36.5 ± 2.3
Get Radiology Tree app to read full this article<
Tumor SNR Values
Get Radiology Tree app to read full this article<
Get Radiology Tree app to read full this article<
CNR Values
Get Radiology Tree app to read full this article<
Get Radiology Tree app to read full this article<
Tumor Volumes
Get Radiology Tree app to read full this article<
Get Radiology Tree app to read full this article<
Get Radiology Tree app to read full this article<
Get Radiology Tree app to read full this article<
Discussion
Get Radiology Tree app to read full this article<
Get Radiology Tree app to read full this article<
Get Radiology Tree app to read full this article<
Get Radiology Tree app to read full this article<
Get Radiology Tree app to read full this article<
Get Radiology Tree app to read full this article<
Get Radiology Tree app to read full this article<
Get Radiology Tree app to read full this article<
Get Radiology Tree app to read full this article<
Get Radiology Tree app to read full this article<
Get Radiology Tree app to read full this article<
References
1. Trattnig S., Ba-Ssalamah A., Noebauer-Huhmann I.M., et. al.: MR contrast agent at high-field MRI (3 Tesla). Top Magn Reson Imaging 2003; 14: pp. 365-375.
2. Albert F.K., Forsting M., Sartor K., et. al.: Early postoperative magnetic resonance imaging of malignant glioma: objective evaluation of residual tumor and its influence on regrowth and prognosis. Neurosurgery 1994; 34: pp. 45-60.
3. Schneider G., Kirchin M.A., Pirovano G., et. al.: Gadobenate dimeglumine-enhanced magnetic resonance imaging of intracranial metastases: effect of dose on lesion detection and delineation. J Magn Reson Imaging 2001; 14: pp. 525-539.
4. Ba-Ssalamah A., Nöbauer-Huhmann I.M., Pinker K., et. al.: Effect of contrast dose and field strength in the magnetic resonance detection of brain metastases. Invest Radiol 2003; 38: pp. 415-422.
5. Erickson B.J., Campeau N.G., Schreiner S.A., et. al.: Triple-dose contrast/magnetization transfer suppressed imaging of “non-enhancing” brain gliomas. J Neurooncol 2002; 60: pp. 25-29.
6. Runge V.M., Parker J.R., Donovan M.: Double-blind, efficacy evaluation of gadobenate dimeglumine, a gadolinium chelate with enhanced relaxivity, in malignant lesions of the brain. Invest Radiol 2002; 37: pp. 269-280.
7. Engh J.A., Flickinger J.C., Niranjan A., et. al.: Optimizing intracranial metastasis detection for stereotactic radiosurgery. Stereotact Funct Neurosurg 2007; 85: pp. 162-168.
8. Reifenberger G., Bilzer T., Seitz R.J., et. al.: Expression of vimentin and glial fibrillary acidic protein in ethylnitrosourea-induced rat gliomas and glioma cell lines. Acta Neuropathol 1989; 78: pp. 270-282.
9. Barth R.F.: Rat brain tumor models in experimental neuro-oncology: the 9L, C6, T9, F98, RG2 (D74), RT-2 and CNS-1 gliomas. J Neurooncol 1998; 36: pp. 91-102.
10. Wintersperger B.J., Runge V.M., Biswas J., et. al.: Brain tumor enhancement in MR imaging at 3 Tesla. Comparison of SNR and CNR gain using TSE and GRE techniques. Invest Radiol 2007; 42: pp. 558-563.
11. Kim B., Chenevert T.L., Ross B.D.: Growth kinetics and treatment response of the intracerebral rat 9L brain tumor model: a quantitative in vivo study using magnetic resonance imaging. Clin Cancer Res 1995; 1: pp. 643-650.
12. Berens M.E., Giese A.: “Those left behind.” Biology and oncology of invasive glioma cells. Neoplasia 1999; 1: pp. 208-219.
13. von Deimling A., Louis D.N., Wiestler O.D.: Molecular pathways in the formation of gliomas. Glia 1995; 15: pp. 328-338.
14. Pinkernelle J., Teichgraeber U., Neumann F., et. al.: Imaging of single human carcinoma cells in vitro using a clinical whole-body magnetic resonance scanner at 3.0 T. Magn Reson Med 2005; 53: pp. 1187-1192.
15. Barth R.F.: Rat brain tumor models in experimental neurooncology: the 9L, C6, F98, RG2 (D74), RT-2 and CNS-1 gliomas. J Neurooncol 1998; 36: pp. 91-102.
16. Runge V.M., Biswas J., Wintersperger B.J., et. al.: The efficacy of gadobenate dimeglumine (Gd-BOPTA) at 3 Tesla in brain magnetic resonance imaging: comparison to 1.5 Tesla and a standard gadolinium chelate using a rat brain tumor model. Invest Radiol 2006; 41: pp. 244-248.
17. Yrjänä S.K., Vaara T., Karttunen A., et. al.: Pulse repetition time and contrast enhancement: simulation study of Gd-BOPTA and conventional contrast agent at different field strengths. Invest Radiol 2008; 43: pp. 267-275.
18. Rohrer M., Bauer H., Mintorovitch J., et. al.: Comparison of magnetic properties of MRI contrast media solutions at different magnetic field strengths. Invest Radiol 2005; 40: pp. 715-724.
19. Vonarbourg A., Sapin A., Lemaire L., et. al.: Characterization and detection of experimental rat gliomas using magnetic resonance imaging. MAGMA 2004; 17: pp. 133-139.