
Rationale and Objective
The objective of this study was to assess an optimized renal multiphase computed tomography angiography (MP-CTA) protocol regarding reduction of contrast volume.
Materials and Methods
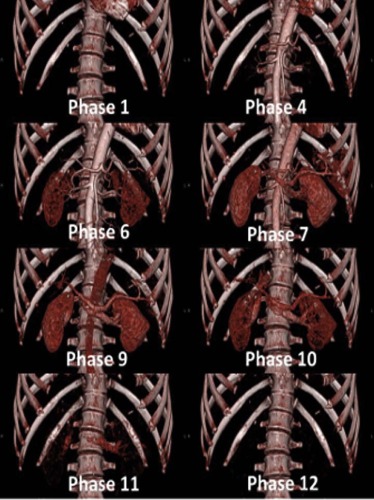
Thirty patients underwent MP-CTA (12 phases, every 3.5 seconds, 80 kV/120 mAs) using 30 mL of contrast medium. The quality of MP-CTA was assessed quantitatively measuring vessel attenuation, image noise, and contrast-to-noise ratio. MP-CTA was evaluated qualitatively regarding depiction of vessels, cortex differentiation, and motion artifacts (grades 1–4, 1 = best). Mean effective radiation dose was registered. Results were compared to standard renal computed tomography angiography (CTA) (80 mL). Student t test was applied, if variables followed normal distribution. For other variables, nonparametric Mann-Whitney U test was used.
Results
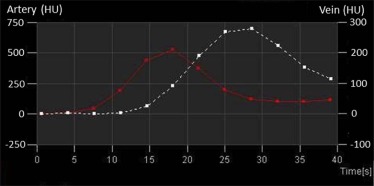
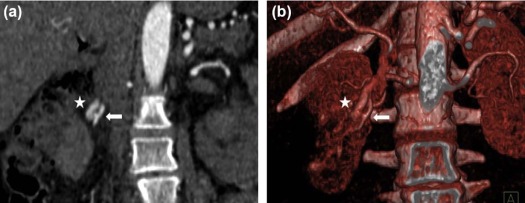
All acquisitions were successfully performed, and no patient had to be excluded from the study. MP-CTA enabled high attenuation (aorta: 503 ± 91 HU, renal arteries: 450 ± 73 HU/456 ± 72 HU) at adequate image noise (13.7 ± 1.5) and good contrast-to-noise ratio (34.2 ± 10.2). Good attenuation of renal veins was observed (286 ± 43 HU/282 ± 42 HU). Arterial enhancement was significantly higher compared to renal CTA (aorta: 396 ± 90 HU, renal arteries: 331 ± 74 HU/333 ± 80 HU; P < .001). MP-CTA protocol enabled good image quality of renal arteries (1.5 ± 0.6) and veins (1.7 ± 0.6). Cortex differentiation and motion artifacts were ranked 1.8 ± 0.8 and 1.6 ± 0.8. The mean effective radiation dose was 9 mSv (MP-CTA).
Conclusions
Compared to standard renal CTA, the renal MP-CTA enabled the significant reduction of contrast volume and simultaneously provided a significantly higher arterial attenuation.
Introduction
One of the main indications for renal computed tomography angiography (CTA) is the assessment of secondary hypertension, because a common cause of renovascular hypertension is renal artery stenosis (RAS). RAS is defined as a narrowing of the renal artery or of their branches and most often is caused by atherosclerosis (90%) . Usually, the plaque formation is located within 1 cm to the ostium and often begins in the aortic wall with progression into the renal artery lumen . Less frequently, RAS is related to fibromuscular dysplasia, which is a vascular disease of medium-sized arteries and most commonly affects renal arteries . During the clinical course, typical signs of renal, rather than essential, hypertension include an acute increase in hypertension, severe hypertension, or a refractory hypertension . Moreover, age, female gender, reduced renal function, increased systolic blood pressure, and peripheral arterial disease are associated with RAS . In a patient collective with the findings mentioned previously, a noninvasive screening is indicated. CTA represents a highly reliable technique for detection of RAS that can be used as a screening test and for interventional treatment planning like percutaneous transluminal angioplasty . Because of its advantages, such as noninvasiveness and high spatial resolution, CTA has also demonstrated strength in the evaluation of other vascular complications such as renal artery embolisms, renal arterial aneurysms, and renal arterial dissections . Regarding the assessment of living renal transplant donors, CTA enables a highly accurate evaluation of the vascular anatomy . Although CTA is a reliable and noninvasive diagnostic tool, application of contrast medium is necessary and, with respect to contrast-induced acute kidney injury (CI-AKI), can be problematic in case of renal impairment . The incidence of CI-AKI varies, depending on the definition of CI-AKI and contrast agents used, and is associated with significantly higher morbidity and mortality, as well as an increased length of hospital stay and costs . Most patients sent for evaluation of renal disease have impaired renal function and also have, on average, become older and therefore have increased risk factors for CI-AKI. Thus, the constant risk of CI-AKI represents a significant problem in contemporary medical care and especially in radiological diagnostics of the kidneys. However, CI-AKI is dose dependent and can be reduced by decreasing the volume of contrast medium applied . Therefore, a CTA protocol that allows for substantial dose reduction would be desirable. The aim of the present study was to compare a new renal multiphase computed tomography angiography (MP-CTA) protocol with significantly reduced contrast volume with a standard renal CTA protocol.
Materials and Methods
The present study was designed as a nonrandomized, retrospective, clinical cohort study. The study was authorized by the local ethics committee and all patients provided written informed consent. The control group consisted of subjects from the clinical database that underwent a standard renal CTA protocol. To guarantee comparability, the gender ratio of the control group was the same as in the study group. Furhtermore, the cutoffs regarding age, weight, and body mass index (BMI) were set below the maximum values of the study group.
Computed Tomography (CT) Data Acquisition and Reconstruction
Get Radiology Tree app to read full this article<
Get Radiology Tree app to read full this article<
Get Radiology Tree app to read full this article<
Get Radiology Tree app to read full this article<
Get Radiology Tree app to read full this article<
Image Analysis
Get Radiology Tree app to read full this article<
Get Radiology Tree app to read full this article<
Get Radiology Tree app to read full this article<
Get Radiology Tree app to read full this article<
Get Radiology Tree app to read full this article<
Statistics
Get Radiology Tree app to read full this article<
Results
Get Radiology Tree app to read full this article<
TABLE 1
Patient Demographics of the Study Group and the Control Group in Detail: Generally there is a Good Matching of the two Groups. However, The Study Group on Average Had Slightly Higher BMI and Body Weight Compared to the Control Group
Study Group Control Group SignificanceAge [years] 58.8 ± 11.9 (22–78) 60.6 ± 9.9 (22–76) p = 0.526Women (No.) 22 22 –Men (No.) 8 8 –Height [cm] 166.7 ± 8.8 (151–187) 166.3 ± 9.3 (142–184) p = 0.887Weight [kg] 69.7 ± 9.7 (50–88) 66.7 ± 11.2 (41–85) p = 0.271BMI [kg/m 2 ] 25.1 ± 3.0 (19.5–31.6) 24.1 ± 3.5 (18.0–31.2) p = 0.230BMI < 25 (No.) 18 18 –BMI ≥ 25 (No.) 12 12 –
Get Radiology Tree app to read full this article<
Get Radiology Tree app to read full this article<
Get Radiology Tree app to read full this article<
Get Radiology Tree app to read full this article<
TABLE 2
CTA Parameters and Quantitative Measurements of the Study Group and the Control Group in Detail
Study Group Control Group SignificanceTube voltage [kV] 80 120 –Tube current-time product [mAs] 120 Care Dose 4D –Contrast volume [ml] 30 80 p < 0.001Flow rate [ml/s] 5 4 –NaCl bolus volume [ml] 100 100 –Flow rate [ml/s] 3 4 –Max. attenuation Aorta [HU] 503 ± 91 396 ± 90 p < 0.001Max. attenuation right renal artery [HU] 450 ± 73 331 ± 74 p < 0.001Max. attenuation left renal artery [HU] 456 ± 72 333 ± 80 p < 0.001Max. attenuation right renal vein [HU] 286 ± 43 – –Max. attenuation left renal vein [HU] 282 ± 42 – –Image-noise [HU] 13.7 ± 1.5 11.5 ± 1.8 p < 0.001Contrast-to-noise-ratio 34.2 ± 10.2 31.3 ± 9.6 p = 0.237
Get Radiology Tree app to read full this article<
Get Radiology Tree app to read full this article<
TABLE 3
Subgroup Evaluation of the Study Group Divided Into Patients with BMI < 25 and BMI ≥ 25
BMI < 25 BMI ≥ 25 SignificanceMax. attenuation Aorta [HU] 533 ± 89 460 ± 77 p = 0.012Max. attenuation right renal artery [HU] 473 ± 65 415 ± 72 p = 0.018Max. attenuation left renal artery [HU] 480 ± 66 421 ± 67 p = 0.013Max. attenuation right renal vein [HU] 301 ± 34 263 ± 48 p = 0.016Max. attenuation left renal vein [HU] 293 ± 40 265 ± 42 p = 0.037Image-noise [HU] 13.2 ± 1.6 14.5 ± 1.1 p = 0.014Contrast-to-noise ratio 37.9 ± 10.7 28.8 ± 6.6 p = 0.007
There was a significantly higher attenuation for all intravascular measurements in nonoverweight patients.
Get Radiology Tree app to read full this article<
Get Radiology Tree app to read full this article<
Get Radiology Tree app to read full this article<
Get Radiology Tree app to read full this article<
Get Radiology Tree app to read full this article<
Get Radiology Tree app to read full this article<
Get Radiology Tree app to read full this article<
Discussion
Get Radiology Tree app to read full this article<
Get Radiology Tree app to read full this article<
Get Radiology Tree app to read full this article<
Get Radiology Tree app to read full this article<
Get Radiology Tree app to read full this article<
Get Radiology Tree app to read full this article<
Get Radiology Tree app to read full this article<
Get Radiology Tree app to read full this article<
Get Radiology Tree app to read full this article<
Get Radiology Tree app to read full this article<
Get Radiology Tree app to read full this article<
Get Radiology Tree app to read full this article<
Get Radiology Tree app to read full this article<
Get Radiology Tree app to read full this article<
Conclusions
Get Radiology Tree app to read full this article<
References
1. Safian R.D., Textor S.C.: Renal-artery stenosis. N Engl J Med 2001; 344: pp. 431-442.
2. Quaia E.: Radiological imaging of the kidney.2014.Springer Berlin Heidelberg
3. Buller C.E., Nogareda J.G., Ramanathan K., et. al.: The profile of cardiac patients with renal artery stenosis. J Am Coll Cardiol 2004; 43: pp. 1606-1613.
4. Fleischmann D.: Multiple detector-row CT angiography of the renal and mesenteric vessels. Eur J Radiol 2003; 45: pp. S79-S87.
5. Kaatee R., Beek F.J., de Lange E.E., et. al.: Renal artery stenosis: detection and quantification with spiral CT angiography versus optimized digital subtraction angiography. Radiology 1997; 205: pp. 121-127.
6. Paul J.F., Blacher J., Blancher J.F., et. al.: Spontaneous renal artery dissection revealed by helical CT angiography. Eur Radiol 2000; 10: pp. 783-785.
7. Engelken F., Friedersdorff F., Fuller T.F., et. al.: Pre-operative assessment of living renal transplant donors with state-of-the-art imaging modalities: computed tomography angiography versus magnetic resonance angiography in 118 patients. World J Urol 2013; 31: pp. 983-990.
8. McCullough P.A., Wolyn R., Rocher L.L., et. al.: Acute renal failure after coronary intervention: incidence, risk factors, and relationship to mortality. Am J Med 1997; 103: pp. 368-375.
9. Subramanian S., Tumlin J., Bapat B., et. al.: Economic burden of contrast-induced nephropathy: implications for prevention strategies. J Med Econ 2007; 10: pp. 119-134.
10. Keaney J.J., Hannon C.M., Murray P.T.: Contrast-induced acute kidney injury: how much contrast is safe. Nephrol Dial Transplant 2013; 28: pp. 1376-1383.
11. Brown J.R., Robb J.F., Block C.A., et. al.: Does safe dosing of iodinated contrast prevent contrast-induced acute kidney injury. Circ Cardiovasc Interv 2010; 3: pp. 346-350.
12. Helck A., Bamberg F., Sommer W.H., et. al.: Optimized contrast volume for dynamic CT angiography in renal transplant patients using a multiphase CT protocol. Eur J Radiol 2011; 80: pp. 692-698.
13. Schwarz F., Grandl K., Arnoldi A., et. al.: Lowering radiation exposure in CT angiography using automated tube potential selection and optimized iodine delivery rate. AJR Am J Roentgenol 2013; 200: pp. W628-W634.
14. Bongartz G., Golding S.J., Jurik A.G., et. al.: European Guidelines on Quality Criteria Computed Tomography: Appendix C. Funded by the European Commission. Contract No. FIGM-CT2000–20078-CT-TIP; Available at: http://www.drs.dk/guidelines/ct/quality/
15. Helck A., Sommer W.H., Klotz E., et. al.: Determination of glomerular filtration rate using dynamic CT-angiography: simultaneous acquisition of morphological and functional information. Invest Radiol 2010; 45: pp. 387-392.
16. Helck A., Wessely M., Notohamiprodjo M., et. al.: CT perfusion technique for assessment of early kidney allograft dysfunction: preliminary results. Eur Radiol 2013; 23: pp. 2475-2481.
17. Samtleben W.: Nephrogene systemische fibrose. Radiologe 2007; 47: pp. 778-784.
18. Rydahl C., Thomsen H.S., Marckmann P.: High prevalence of nephrogenic systemic fibrosis in chronic renal failure patients exposed to gadodiamide, a gadolinium-containing magnetic resonance contrast agent. Invest Radiol 2008; 43: pp. 141-144.
19. Altun E., Semelka R.C., Cakit C.: Nephrogenic systemic fibrosis and management of high-risk patients. Acad Radiol 2009; 16: pp. 897-905.
20. Heverhagen J.T., Krombach G.A., Gizewski E.: Application of extracellular gadolinium-based MRI contrast agents and the risk of nephrogenic systemic fibrosis. Rofo 2014; 186: pp. 661-669.
21. McDonald R.J., McDonald J.S., Kallmes D.F., et. al.: Intracranial gadolinium deposition after contrast-enhanced MR imaging. Radiology 2015; 275: pp. 772-782.
22. Kanda T., Ishii K., Kawaguchi H., et. al.: High signal intensity in the dentate nucleus and globus pallidus on unenhanced T1-weighted MR images: relationship with increasing cumulative dose of a gadolinium-based contrast material. Radiology 2014; 270: pp. 834-841.
23. Stojanov D., Aracki-Trenkic A., Benedeto-Stojanov D.: Gadolinium deposition within the dentate nucleus and globus pallidus after repeated administrations of gadolinium-based contrast agents-current status. Neuroradiology 2016; 58: pp. 433-441.
24. Jönsson M., Ceberg S., Nordström F., et. al.: Technical evaluation of a laser-based optical surface scanning system for prospective and retrospective breathing adapted computed tomography. Acta Oncol 2015; 54: pp. 261-265.
25. Heinz C., Reiner M., Belka C., et. al.: Technical evaluation of different respiratory monitoring systems used for 4D CT acquisition under free breathing. J Appl Clin Med Phys 2015; 16: pp. 4917.
26. Fischer T., Dieckhofer J., Muhler M., et. al.: The use of contrast-enhanced US in renal transplant: first results and potential clinical benefit. Eur Radiol 2005; 15: pp. E109-E116.
27. Wentland A.L., Sadowski E.A., Djamali A., et. al.: Quantitative MR measures of intrarenal perfusion in the assessment of transplanted kidneys: initial experience. Acad Radiol 2009; 16: pp. 1077-1085.
28. Attenberger U.I., Sourbron S.P., Schoenberg S.O., et. al.: Comprehensive MR evaluation of renal disease: added clinical value of quantified renal perfusion values over single MR angiography. J Magn Reson Imaging 2010; 31: pp. 125-133.
29. Artz N.S., Wentland A.L., Sadowski E.A., et. al.: Comparing kidney perfusion using noncontrast arterial spin labeling MRI and microsphere methods in an interventional swine model. Invest Radiol 2011; 46: pp. 124-131.
30. Helck A., Schonermarck U., Habicht A., et. al.: Determination of split renal function using dynamic CT-angiography: preliminary results. PLoS ONE 2014; 9: e91774
31. Gates G.F.: Glomerular filtration rate: estimation from fractional renal accumulation of 99mTc-DTPA (stannous). AJR Am J Roentgenol 1982; 138: pp. 565-570.
32. Mulay A.V., Gokhale S.M.: Comparison of serum creatinine-based estimating equations with gates protocol for predicting glomerular filtration rate in Indian population. Indian J Nephrol 2017; 27: pp. 124-128.
33. Xie P., Huang J., Liu X., et. al.: (99m)Tc-DTPA renal dynamic imaging method may be unsuitable to be used as the reference method in investigating the validity of CDK-EPI equation for determining glomerular filtration rate. PLoS ONE 2013; 8: e62328
34. Zhang J.L., Rusinek H., Chandarana H., et. al.: Functional MRI of the kidneys. J Magn Reson Imaging 2013; 37: pp. 282-293.
35. Kinkel B., Parusel M., Hedde J.P.: AV-Fistel eines Nierentransplantates, MR-angiographie, DSA und interventionelle therapie. Rofo 2000; 172: pp. 787-788.
36. Rountas C., Vlychou M., Vassiou K., et. al.: Imaging modalities for renal artery stenosis in suspected renovascular hypertension. prospective intraindividual comparison of color Doppler US, CT angiography, GD-enhanced MR angiography, and digital subtraction angiography. Ren Fail 2009; 29: pp. 295-302.
37. Kaza R.K., Platt J.F., Goodsitt M.M., et. al.: Emerging techniques for dose optimization in abdominal CT. Radiographics 2014; 34: pp. 4-17.
38. Sigal-Cinqualbre A.B., Hennequin R., Abada H.T., et. al.: Low-kilovoltage multi-detector row chest CT in adults: feasibility and effect on image quality and iodine dose. Radiology 2004; 231: pp. 169-174.