
Rationale and Objectives
The enhancement pattern of malignant tumors has been studied in short-term animal models (7–14 days), but the reported results have been variable and inconsistent. The purpose of this study was to investigate the changing blood flow characteristics of VX2 tumors implanted in rabbit livers with contrast-enhanced multidetector computed tomography (MDCT) to establish a predictable pattern of vascular evolution over an extended 28-day growth period.
Materials and Methods
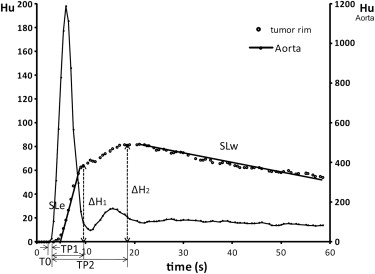
VX2 carcinoma was implanted in livers of 10 male New Zealand White rabbits. Dynamic CT (2/seconds × 60 seconds) was conducted on days 7, 14, 21, and 28 after tumor implantation. Enhancement parameters of time-density curve (TDC), time to start (T0), time to peak (TP), maximum enhancement (ΔH), slope of enhancement (SLe), and washout (SLw) in tumor center, tumor rim, and normal liver were analyzed. Tumor samples corresponding to CT images of one tumor on days 14 and 21 and seven tumors on day 28 were stained with hematoxylin and eosin and anti-CD31 monoclonal antibody. The relationship between enhancement parameters and histology parameters (thickness of tumor border, extent of blood stasis, and luminar vessel density) was analyzed.
Results
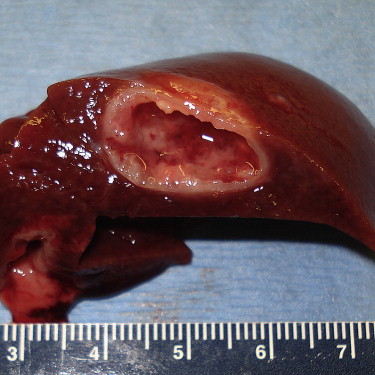
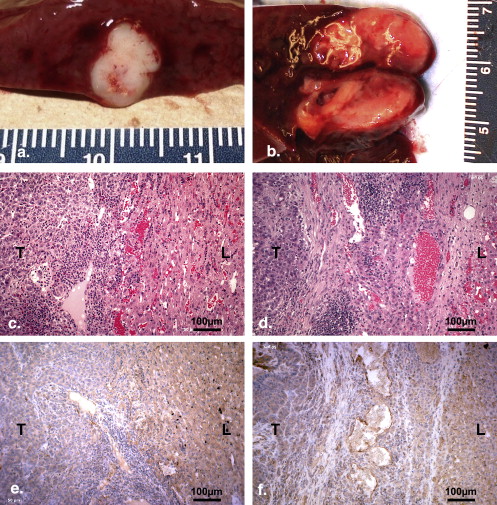
Consistent growth, appearance, and vascular changes occurred in 7 of 10 animals over the 4-week observation period. Peripheral rim-like enhancement was noted in CT images. TDC analysis showed that tumor rim enhancement was pronounced and more rapid than normal liver initially but this difference diminished with tumor progression. The SLe, SLw, and ΔH decreased from 10.03 ± 3.25 Hu/second, 0.42 ± 0.25 Hu/sec, and 58.00 ± 25.27 Hu on day 7 to 5.86 ± 2.73 Hu/second, 0.10 ± 0.13 Hu/second, and 37.78 ± 8.89 Hu/second on day 28, respectively. TP increased from 12.71 ± 4.85 seconds on day 7 to 25.57 ± 7.75 seconds on day 28. No significant changes were noted on the TDC parameters in normal liver. The maximum density difference between tumor rim and normal liver (D rim-liver ) appeared 10.5 ± 2.1 seconds after contrast injection. The maximum D rim-liver decreased from 54.33 ± 37.86 Hu on day 7 to 11.16 ± 13.03 Hu on day 28. On histological analysis, viable tumor cells were found in tumor rim with few luminar vessels. The tumor border showed desmoplastic reaction, vascular dilation and proliferation, inflammatory cell infiltration, and blood stasis. These findings were more obvious on day 28 than those on day 14. TP showed significant positive correlations with the extent of blood stasis in tumor border and adjacent liver and the maximum thickness of the tumor border ( r = 0.945 and 0.893 respectively, P < .05).
Conclusion
The rabbit VX2 liver tumor is a hypovascular tumor with perilesional enhancement over its lifespan as imaged by MDCT. Consistent changes in the measured vascular parameters correlated with the size/age of the tumor implants. These findings suggest that the accuracy of CT enhancement imaging for VX2 liver tumor detection might be decreased with tumor development.
With the increasing speed of imaging technology, dynamic contrast-enhanced computed tomography (CT) and magnetic resonance imaging (MRI) have been widely used in the characterization of solid tumors, particularly for tumors of the liver, kidney, and breast . Among these studies, analyzing the enhancement pattern of the liver tumor was used as a vital approach to differentiate malignant from benign lesions , evaluate tumor vascularity , and response to treatment . However, the degree of the tumor enhancement was varied. This variation was reported to be due to the differences of tumor vasculature and permeability , the extent of peritumoral inflammatory reactions , the existence of arterioportal shunts , and the circulation time of contrast in the systemic and portal systems .
Numerous studies have shown that tumor growth and angiogenesis are complex processes that involve the expression of many growth factors, nutrient and oxygen delivery, metabolic waste drainage, and immunoreactions of the host . With tumor development, the effect of these factors likely changes. Previous studies reported that serum VEGF levels were positively correlated with the stage of ovarian cancer . Au et al found that the mRNA levels of glucose transporter 1 and glucose transporter 3 of ascites tumor cells increased progressively in the tumor during development. Stewart et al explored the relationship between glucose metabolism and growth of VX2 liver tumors using fluorine 18 fluorodeoxyglucose positron emission tomography/CT scan and found that the glucose utilization of tumors increased with tumor growth. We hypothesize that tumor perfusion will change with the stage or development of the liver tumor.
Get Radiology Tree app to read full this article<
Materials and methods
Overall Experiment Design
Get Radiology Tree app to read full this article<
VX2 Tumor Model
Get Radiology Tree app to read full this article<
Dynamic CT
Get Radiology Tree app to read full this article<
TDC Analysis
Get Radiology Tree app to read full this article<
Get Radiology Tree app to read full this article<
Get Radiology Tree app to read full this article<
Tumor Growth Monitoring and Tumor Size Determination
Get Radiology Tree app to read full this article<
Histology and Immunohistochemistry
Get Radiology Tree app to read full this article<
Get Radiology Tree app to read full this article<
Data Analysis
Get Radiology Tree app to read full this article<
Results
Progression of Tumor Growth
Get Radiology Tree app to read full this article<
Get Radiology Tree app to read full this article<
Get Radiology Tree app to read full this article<
Table 1
Change in VX2 Tumor Size as Determined by Computed Tomography
Tumor Age (Days) 7 14 21 28 Tumor diameter (cm) 0.83 ± 0.27 1.41 ± 0.41 1.77 ± 0.53 2.05 ± 0.75 Tumor area (cm 2 ) 0.55 ± 0.31 1.50 ± 0.72 2.55 ± 1.70 3.11 ± 1.99 Necrosis area (cm 2 ) 0.13 ± 0.11 0.63 ± 0.39 1.56 ± 1.32 2.02 ± 1.63 Tumor rim area (cm 2 ) 0.42 ± 0.22 0.88 ± 0.36 0.98 ± 0.39 1.09 ± 0.42
Get Radiology Tree app to read full this article<
TDC Analysis
Get Radiology Tree app to read full this article<
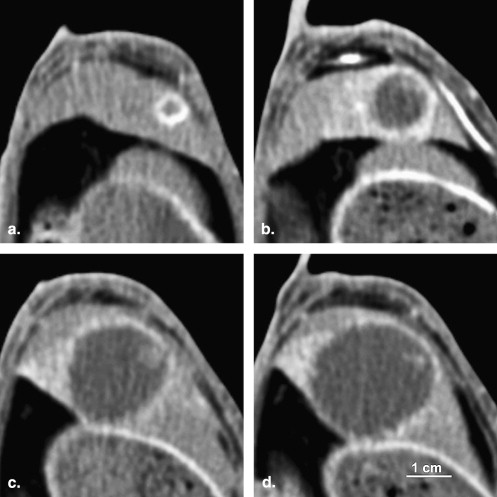
Table 2
Time-density Curve Parameters Changes in Different ROIs of VX2 Liver Tumor
Tumor Age (Days) 7 14 21 28 Tumor center T0 (seconds) 1.50 ± 0.76 2.54 ± 2.64 9.43 ± 10.80 8.93 ± 6.11 TP1 (seconds) 4.93 ± 1.95 16.18 ± 13.90 10.3 ± 5.56 14.71 ± 6.48 TP2 (seconds) 4.93 ± 1.95 16.18 ± 13.90 13.80 ± 8.33 14.71 ± 6.48 ΔH1 (Hu) 43.63 ± 20.82 9.43 ± 7.60 5.28 ± 3.17 1.68 ± 1.90 ΔH2 (Hu) 43.63 ± 20.82 9.43 ± 7.60 5.33 ± 3.24 1.68 ± 1.90 SLe (Hu/second) 11.09 ± 5.81 1.47 ± 1.91 0.71 ± 0.77 0.19 ± 0.23 SLw (Hu/second) -0.11 ± 0.21 -0.09 ± 0.15 0.04 ± 0.06 0.01 ± 0.02 Tumor rim T0 (seconds) 1.57 ± 0.61 1.14 ± 0.85 1.46 ± 0.82 1.79 ± 0.70 TP1 (seconds) 5.21 ± 1.65 5.79 ± 1.32 5.61 ± 1.64 6.21 ± 3.01 TP2 (seconds) 12.71 ± 4.85 13.79 ± 6.94 17.39 ± 6.14 25.57 ± 7.75 ∗ ΔH1 (Hu) 50.18 ± 18.99 48.62 ± 14.09 32.83 ± 13.29 29.45 ± 12.69 ∗ ΔH2 (Hu) 58.00 ± 25.27 56.92 ± 12.24 41.50 ± 13.56 37.78 ± 8.89 SLe (Hu/second) 10.03 ± 3.25 10.25 ± 3.93 7.21 ± 2.86 5.86 ± 2.73 ∗ SLw (Hu/second) -0.42 ± 0.25 -0.41 ± 0.25 -0.10 ± 0.11 -0.10 ± 0.13 ∗ Normal liver T0 (seconds) 3.71 ± 1.55 3.86 ± 2.90 4.36 ± 2.82 4.50 ± 2.69 TP1 (seconds) 16.79 ± 6.51 21.86 ± 10.42 26.64 ± 11.76 19.71 ± 10.37 TP2 (seconds) 16.79 ± 6.51 24.79 ± 7.76 26.64 ± 11.76 23.50 ± 7.75 ΔH1 (Hu) 49.65 ± 14.80 45.52 ± 11.41 49.67 ± 13.28 48.67 ± 25.15 ΔH2 (Hu) 49.65 ± 14.80 48.26 ± 10.81 49.67 ± 13.28 56.29 ± 19.58 SLe (Hu/second) 2.94 ± 1.26 3.67 ± 2.38 2.42 ± 1.17 3.88 ± 3.06 SLw (Hu/second) -0.44 ± 0.25 -0.49 ± 0.19 -0.51 ± 0.32 -0.44 ± 0.11 Rim-liver Baseline (Hu) -9.12 ± 1.70 -14.9 ± 4.62 -11.82 ± 6.03 -13.66 ± 4.72 TP (seconds) 10.79 ± 1.75 11.36 ± 2.27 9.64 ± 1.80 10.29 ± 2.40 Max. (Hu) 54.33 ± 37.86 37.06 ± 11.98 16.45 ± 12.45 11.16 ± 13.03 ∗
SLe: slope of enhancement; SLw: slope of washout.
Get Radiology Tree app to read full this article<
Get Radiology Tree app to read full this article<
Get Radiology Tree app to read full this article<
Table 3
The Distribution of Enhancement Patterns in VX2 Liver Tumor Rim
Type Day I II III IV 7 0 0 6 1 14 0 1 5 1 21 1 4 2 0 28 2 2 3 0
Get Radiology Tree app to read full this article<
Get Radiology Tree app to read full this article<
Get Radiology Tree app to read full this article<
Histology Findings
Get Radiology Tree app to read full this article<
Get Radiology Tree app to read full this article<
Correlation between Enhancement Parameters and Histology
Get Radiology Tree app to read full this article<
Discussion
Get Radiology Tree app to read full this article<
Get Radiology Tree app to read full this article<
Get Radiology Tree app to read full this article<
Get Radiology Tree app to read full this article<
Get Radiology Tree app to read full this article<
Get Radiology Tree app to read full this article<
Get Radiology Tree app to read full this article<
Get Radiology Tree app to read full this article<
Get Radiology Tree app to read full this article<
Get Radiology Tree app to read full this article<
Get Radiology Tree app to read full this article<
Get Radiology Tree app to read full this article<
Acknowledgment
Get Radiology Tree app to read full this article<
Get Radiology Tree app to read full this article<
References
1. Ippolito D., Sironi S., Pozzi M., et. al.: Hepatocellular carcinoma in cirrhotic liver disease: functional computed tomography with perfusion imaging in the assessment of tumor vascularization. Acad Radiol 2008; 15: pp. 919-927.
2. Huang J.S., Pan H.B., Chou C.P., et. al.: Optimizing scanning phases in detecting small (<2 cm) hepatocellular carcinoma: whole-liver dynamic study with multidetector row CT. J Comput Assist Tomogr 2008; 32: pp. 341-346.
3. Yu J.S., Rofsky N.M.: Hepatic metastases: perilesional enhancement on dynamic MRI. AJR Am J Roentgenol 2006; 186: pp. 1051-1058.
4. Wang J.H., Min P.Q., Wang P.J., et. al.: Dynamic CT evaluation of tumor vascularity in renal cell carcinoma. AJR Am J Roentgenol 2006; 186: pp. 1423-1430.
5. Tozaki M., Uno S., Kobayashi T., et. al.: Histologic breast cancer extent after neoadjuvant chemotherapy: comparison with multidetector-row CT and dynamic MRI. Radiat Med 2004; 22: pp. 246-253.
6. Murakami T., Kim T., Hori M., Federle M.P.: Double arterial phase multi-detector row helical CT for detection of hypervascular hepatocellular carcinoma. Radiology 2003; 229: pp. 931-932.
7. Murakami T., Kim T., Takamura M., et. al.: Hypervascular hepatocellular carcinoma: detection with double arterial phase multi-detector row helical CT. Radiology 2001; 218: pp. 763-767.
8. Yamashita Y., Ogata I., Urata J., et. al.: Cavernous hemangioma of the liver: pathologic correlation with dynamic CT findings. Radiology 1997; 203: pp. 121-125.
9. Mitchell D.G., Saini S., Weinreb J., et. al.: Hepatic metastases and cavernous hemangiomas: distinction with standard- and triple-dose gadoteridol-enhanced MR imaging. Radiology 1994; 193: pp. 49-57.
10. Kanematsu M., Semelka R.C., Leonardou P., et. al.: Angiogenesis in hepatocellular nodules: correlation of MR imaging and vascular endothelial growth factor. J Magn Reson Imaging 2004; 20: pp. 426-434.
11. Tsuda M., Majima K., Yamada T., et. al.: Hepatocellular carcinoma after radiofrequency ablation therapy: dynamic CT evaluation of treatment. Clin Imaging 2001; 25: pp. 409-415.
12. Zhao J.G., Feng G.S., Kong X.Q., et. al.: Changes of tumor microcirculation after transcatheter arterial chemoembolization: first pass perfusion MR imaging and Chinese ink casting in a rabbit model. World J Gastroenterol 2004; 10: pp. 1415-1420.
13. Kwak B.K., Shim H.J., Park U.S., et. al.: Correlation of VEGF with contrast enhancement on dual-phase dynamic helical CT in liver tumors: preliminary study. J Korean Med Sci 2001; 16: pp. 83-87.
14. Semelka R.C., Hussain S.M., Marcos H.B., et. al.: Perilesional enhancement of hepatic metastases: correlation between MR imaging and histopathologic findings-initial observations. Radiology 2000; 215: pp. 89-94.
15. Ueda K., Matsui O., Kawamori Y., et. al.: Hypervascular hepatocellular carcinoma: evaluation of hemodynamics with dynamic CT during hepatic arteriography. Radiology 1998; 206: pp. 161-166.
16. Kim S., Kim J.H., Han J.K., et. al.: Prediction of optimal injection protocol for tumor detection in contrast-enhanced dynamic hepatic CT using simulation of lesion-to-liver contrast difference. Comput Med Imaging Graph 2000; 24: pp. 317-327.
17. Stacker S.A., Achen M.G.: From anti-angiogenesis to anti-lymphangiogenesis: emerging trends in cancer therapy. Lymphat Res Biol 2008; 6: pp. 165-172.
18. Denko N.C.: Hypoxia, HIF1 and glucose metabolism in the solid tumour. Nat Rev Cancer 2008; 8: pp. 705-713.
19. Eren F., Celikel C., Gulluoglu B.: Neuroendocrine differentiation in gastric adenocarcinomas; correlation with tumor stage and expression of VEGF and p53. Pathol Oncol Res 2004; 10: pp. 47-51.
20. Li L., Wang L., Zhang W., et. al.: Correlation of serum VEGF levels with clinical stage, therapy efficacy, tumor metastasis and patient survival in ovarian cancer. Anticancer Res 2004; 24: pp. 1973-1979.
21. Au K.K., Liong E., Li J.Y., et. al.: Increases in mRNA levels of glucose transporters types 1 and 3 in Ehrlich ascites tumor cells during tumor development. J Cell Biochem 1997; 67: pp. 131-135.
22. Stewart E.E., Chen X., Hadway J., et. al.: Correlation between hepatic tumor blood flow and glucose utilization in a rabbit liver tumor model. Radiology 2006; 239: pp. 740-750.
23. Weinberg B.D., Blanco E., Lempka S.F., et. al.: Combined radiofrequency ablation and doxorubicin-eluting polymer implants for liver cancer treatment. J Biomed Mater Res A 2007; 81: pp. 205-213.
24. Park H.S., Chung J.W., Jae H.J., et. al.: FDG-PET for evaluating the antitumor effect of intraarterial 3-bromopyruvate administration in a rabbit VX2 liver tumor model. Korean J Radiol 2007; 8: pp. 216-224.
25. Burgener F.A., Violante M.R.: Comparison of hepatic VX2-carcinomas after intra-arterial, intraportal and intraparenchymal tumor cell injection. An angiographic and computed tomographic study in the rabbit. Invest Radiol 1979; 14: pp. 410-414.
26. Tanaka H., Taniguchi H., Mugitani T., et. al.: Intra-arterial administration of the angiogenesis inhibitor TNP-470 blocks liver metastasis in a rabbit model. Br J Cancer 1995; 72: pp. 650-653.
27. Li J., Dong B., Yu X., Li C.: Ultrasonographic portography with low mechanical index gray-scale imaging in hepatic VX2 tumor. Ultrasound Med Biol 2006; 32: pp. 641-647.
28. Maruyama H., Matsutani S., Saisho H., et. al.: Sonographic shift of hypervascular liver tumor on blood pool harmonic images with definity: time-related changes of contrast-enhanced appearance in rabbit VX2 tumor under extra-low acoustic power. Eur J Radiol 2005; 56: pp. 60-65.
29. Jiang H.J., Zhang Z.R., Shen B.Z., et. al.: Functional CT for assessment of early vascular physiology in liver tumors. Hepatobiliary Pancreat Dis Int 2008; 7: pp. 497-502.
30. Morimoto K., Sakaguchi H., Tanaka T., et. al.: Transarterial chemoembolization using cisplatin powder in a rabbit model of liver cancer. Cardiovasc Intervent Radiol 2008; 31: pp. 981-985.
31. Kuszyk B.S., Bluemke D.A., Choti M.A., et. al.: 1999 ARRS Executive Council Award. Contrast-enhanced CT of small hypovascular hepatic tumors: effect of lesion enhancement on conspicuity in rabbits. American Roentgen Ray Society. AJR Am J Roentgenol 2000; 174: pp. 471-475.
32. Jia H.S., Quan X.Y., Zeng S., Wen Z.B.: [Dynamic evaluation of rabbit VX2 hepatic carcinoma with CT and MRI]. Di Yi Jun Yi Da Xue Xue Bao 2002; 22: pp. 141-144.
33. Kanematsu M., Matsuo M., Yamada Y., et. al.: Perilesional hyperintense rim of malignant hepatic tumors on ferumoxide-enhanced T1-weighted gradient-echo MR images: correlation between MR imaging and histopathologic findings. J Magn Reson Imaging 2003; 18: pp. 40-48.
34. Itai Y., Irie T.: Metastatic liver tumor: circumferential versus wedge-shaped perilesional enhancement and quantitative image and pathologic correlation. Radiology 2001; 219: pp. 298-300.
35. Itai Y., Matsui O.: Blood flow and liver imaging. Radiology 1997; 202: pp. 306-314.
36. Buadu L.D., Murakami J., Murayama S., et. al.: Breast lesions: correlation of contrast medium enhancement patterns on MR images with histopathologic findings and tumor angiogenesis. Radiology 1996; 200: pp. 639-649.
37. Mahfouz A.E., Hamm B., Wolf K.J.: Peripheral washout: a sign of malignancy on dynamic gadolinium-enhanced MR images of focal liver lesions. Radiology 1994; 190: pp. 49-52.
38. Kanematsu M., Hoshi H., Yamada T., et. al.: Overestimating the size of hepatic malignancy on helical CT during arterial portography: equilibrium phase CT and pathology. J Comput Assist Tomogr 1997; 21: pp. 713-719.
39. Kan Z., Ivancev K., Lunderquist A., et. al.: In vivo microscopy of hepatic tumors in animal models: a dynamic investigation of blood supply to hepatic metastases. Radiology 1993; 187: pp. 621-626.
40. Burgener F.A., Hamlin D.J.: Contrast enhancement of focal hepatic lesions in CT: effect of size and histology. AJR Am J Roentgenol 1983; 140: pp. 297-301.
41. Kapanen M.K., Halavaara J.T., Hakkinen A.M.: Assessment of vascular physiology of tumorous livers: comparison of two different methods. Acad Radiol 2003; 10: pp. 1021-1029.
42. Stewart E.E., Chen X., Hadway J., et. al.: Hepatic perfusion in a tumor model using DCE-CT: an accuracy and precision study. Phys Med Biol 2008; 53: pp. 4249-4267.