
Rationale and Objectives
We sought to assess changes in liver perfusion parameters induced by transjugular intrahepatic portosystemic shunt (TIPS) creation in cirrhotic patients with refractory ascites using dynamic MR perfusion measurements.
Materials and Methods
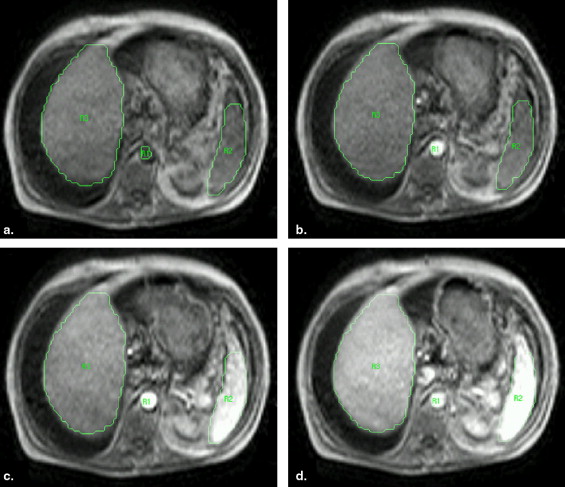
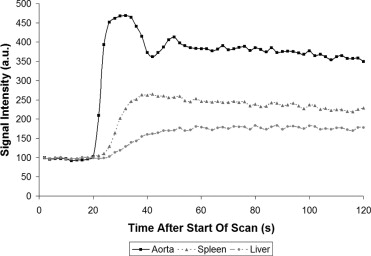
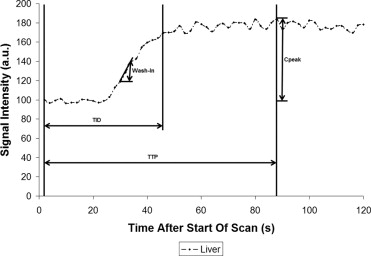
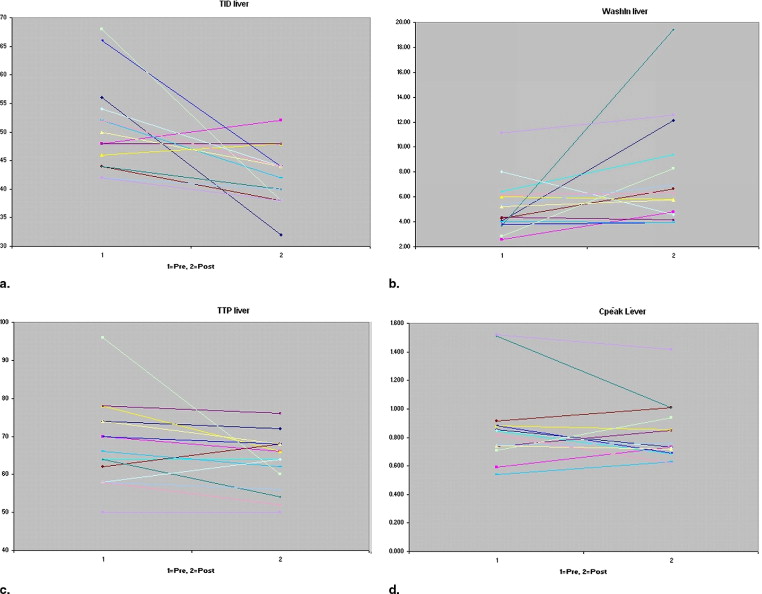
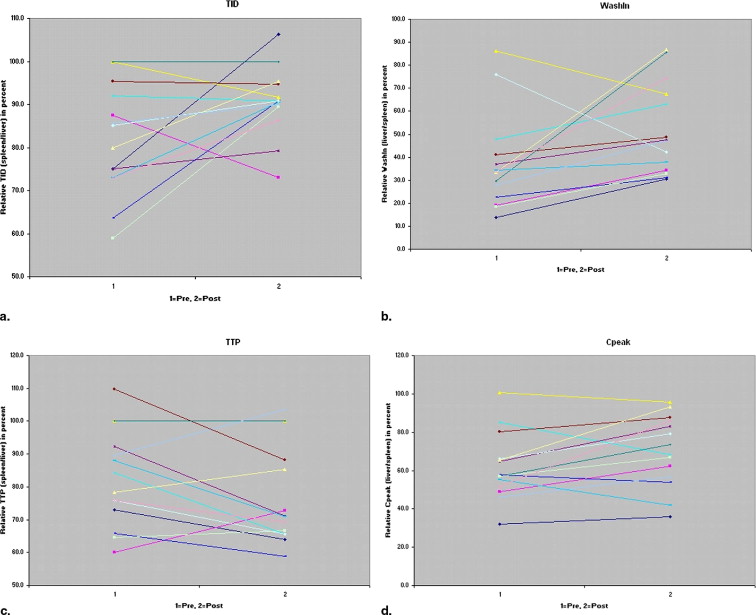
MR perfusion measurements were performed before and after TIPS creation in 15 cirrhotic patients all with refractory ascites. Measurements were performed over a time period of 120 seconds providing 60 images for each examination and calculations were done in both liver and splenic parenchyma. Different perfusion parameters were assessed: time to peak (TTP), time to inflow deceleration (TID), maximal or peak perfusion (C-peak) and the wash-in rate.
Results
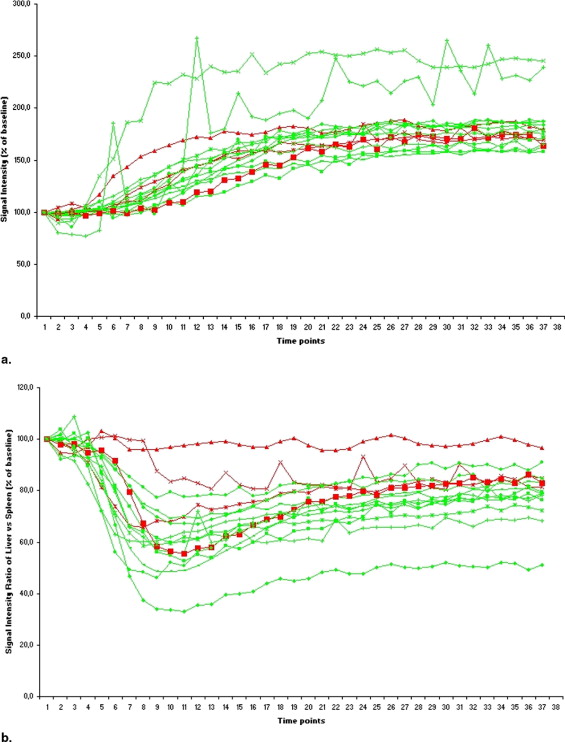
TIPS procedures were successful in all 15 patients but were complicated by hepatic encephalopathy in 3 patients (20%), and in another 4 patients (26%), persistent refractory ascites was still noted during follow-up. Overall, liver TID values decreased significantly ( P = .001) after TIPS creation; liver wash-in values increased significantly ( P = .04) after TIPS. TTP values did not decrease significantly ( P = .16) and liver C-peak values did not change equally ( P = .99).
Conclusion
In cirrhotic patients with refractory ascites, TIPS induced a faster, but not an increased, contrast enhancement in the liver.
Transjugular intrahepatic portosystemic shunt (TIPS) has become an accepted interventional treatment modality for portal hypertension−related complications such as variceal bleeding and refractory ascites ( ). Symptomatic relief and survival after TIPS creation mainly depend on residual liver function and shunt (dys)function. The latter problem has become marginal owing to the introduction of e-PTFE−covered endoprostheses ( ), but clinical response and even survival after TIPS, especially in ascitic patients with a poor liver function, remain unpredictable. Several scoring and classification systems were designed to better select patients for TIPS and to better predict outcome after TIPS. Most of them, like the Child-Pugh classification or the MELD score ( ), are based on clinical and biochemical parameters. Although clinically useful, these scoring systems are not unfailing, and some patients presenting with an acceptable score may not respond to the shunt procedure, and vice versa. Recently, some imaging studies were performed on patients before TIPS creation in order to predict survival after TIPS placement based on flow velocity measurements in the hepatic artery ( ) and on liver perfusion parameters, especially in cirrhotic patients with refractory ascites ( ). According to Walser et al. ( ), blunted arterial-type hepatic enhancement significantly lower than renal enhancement seems to be predictive for poor clinical outcome after TIPS. The aim of this study is to evaluate, by dynamic MR imaging, perfusion parameters of the liver and spleen before and after TIPS placement in cirrhotic patients with refractory ascites. Additionally, we aim to assess the potential of these MR imaging parameters for prediction of clinical response before TIPS placement.
Materials and methods
Patient Population
Fifteen patients (13 male and 2 female; mean age, 52.5 years; age range, 36–69 years) underwent a TIPS procedure to treat portal hypertension-related ascites refractory to conservative medical therapy. In four patients (26%), an additional hepatic hydrothorax was noted. The underlying liver disease was cirrhosis owing to alcohol abuse (n = 12), hepatitis C infection (n = 1), and nonalcoholic steatohepatitis (NASH) (n = 2). Assessment of Child-Pugh score was performed: Child-Pugh A (n = 1), Child-Pugh B (n = 7), and Child-Pugh C (n = 7). All included patients had a Child-Pugh score equal to or less than 12 points.
Get Radiology Tree app to read full this article<
Get Radiology Tree app to read full this article<
TIPS Procedure
Get Radiology Tree app to read full this article<
Dynamic MR Measurements Before and After TIPS Placement
Get Radiology Tree app to read full this article<
NormalizedTIDtissue=TIDtissue−(TIDaif.average−TIDaif.patient) Normalized
TID
tissue
=
TID
tissue
−
(
TID
aif
.average
−
TID
aif
.
patient
)
where aif is arterial input function. The parameters C-peak and wash-in were normalized as follows:
NormalizedC-peaktissue=C-peaktissue×(C-peakaif.average/C-peakaif.patient) Normalized
C-peak
tissue
=
C-peak
tissue
×
(
C-peak
aif
.average
/
C-peak
aif
.patient
)
Get Radiology Tree app to read full this article<
Get Radiology Tree app to read full this article<
Table 1
Absolute and Relative Measurements of TTP Before and After TIPS
Absolute Relative Patient 1 62.0 70.0 + Patient 1 75.0 106.3 + Patient 2 62.0 58.0 + Patient 2 87.5 73.1 + Patient 3 62.0 50.0 − Patient 3 100.0 91.7 − Patient 4 62.0 62.0 − Patient 4 92.0 90.9 − Patient 5 62.0 60.0 − Patient 5 75.0 79.2 − Patient 6 60.0 68.0 + Patient 6 95.5 94.7 + Patient 7 42.0 48.0 + Patient 7 100.0 100.0 + Patient 8 64.0 74.0 + Patient 8 63.6 90.9 + Patient 9 74.0 68.0 + Patient 9 73.1 90.5 + Patient 10 74.0 80.0 + Patient 10 85.2 90.9 + Patient 11 114.0 72.0 + Patient 11 58.8 89.5 + Patient 12 68.0 68.0 − Patient 12 80.0 95.5 − Patient 13 58.0 46.0 + Patient 13 85.7 90.0 + Patient 14 66.0 78.0 + Patient 14 73.1 86.4 + Patient 15 74.0 70.0 + Patient 15 NA NA +
NA (not available): in patient 15, the splenic parenchyma was outside the field of view, making the calculation of relative values impossible.
+, Responders; −, nonresponders.
Table 2
Absolute and Relative Measurements of TID Before and After TIPS
Absolute Relative Patient 1 46.0 22.0 + Patient 1 73.0 63.9 + Patient 2 52.0 54.0 + Patient 2 60.0 72.7 + Patient 3 32.0 34.0 − Patient 3 100.0 100.0 − Patient 4 62.0 38.0 − Patient 4 84.4 65.6 − Patient 5 34.0 34.0 − Patient 5 92.3 71.1 − Patient 6 38.0 30.0 + Patient 6 109.7 88.2 + Patient 7 42.0 40.0 + Patient 7 100.0 100.0 + Patient 8 56.0 36.0 + Patient 8 65.7 58.8 + Patient 9 48.0 38.0 + Patient 9 87.9 71.0 + Patient 10 52.0 42.0 + Patient 10 75.9 65.6 + Patient 11 62.0 36.0 + Patient 11 64.6 66.7 + Patient 12 46.0 38.0 − Patient 12 78.4 85.3 − Patient 13 26.0 22.0 + Patient 13 89.7 103.6 + Patient 14 40.0 38.0 + Patient 14 75.9 69.2 + Patient 15 43.7 34.8 + Patient 15 NA NA +
NA (not available): in patient 15, the splenic parenchyma was outside the field of view, making the calculation of relative values impossible.
+, Responders; −, nonresponders.
Table 3
Absolute and Relative Measurements of C-peak Before and After TIPS
Absolute Relative Patient 1 0.406 0.365 + Patient 1 32.0 35.8 + Patient 2 0.889 0.967 + Patient 2 49.0 62.4 + Patient 3 0.447 0.393 − Patient 3 100.7 95.8 − Patient 4 0.585 0.584 − Patient 4 85.0 68.3 − Patient 5 0.783 0.939 − Patient 5 64.6 83.1 − Patient 6 0.617 0.672 + Patient 6 80.2 87.8 + Patient 7 0.723 0.451 + Patient 7 56.8 73.5 + Patient 8 1.089 0.849 + Patient 8 57.8 54.0 + Patient 9 0.974 1.081 + Patient 9 55.4 41.7 + Patient 10 0.581 0.458 + Patient 10 66.1 79.3 + Patient 11 0.948 1.313 + Patient 11 57.1 66.9 + Patient 12 0.660 0.693 − Patient 12 65.4 93.4 − Patient 13 0.433 0.428 + Patient 13 46.0 56.5 + Patient 14 0.662 0.737 + Patient 14 51.9 86.0 + Patient 15 0.517 0.372 + Patient 15 NA NA +
NA (not available): in patient 15, the splenic parenchyma was outside the field of view, making the calculation of relative values impossible.
+, Responders; −, nonresponders.
Table 4
Absolute and Relative Measurements of Wash-in Before and After TIPS
Absolute Relative Patient 1 2.05 4.77 + Patient 1 13.7 30.6 + Patient 2 3.88 6.94 + Patient 2 19.0 34.4 + Patient 3 3.63 3.02 − Patient 3 86.3 67.5 − Patient 4 3.48 4.65 − Patient 4 47.8 63.1 − Patient 5 5.95 7.02 − Patient 5 36.9 47.6 − Patient 6 3.98 7.19 + Patient 6 41.1 48.7 + Patient 7 13.00 4.75 + Patient 7 29.5 85.7 + Patient 8 5.17 6.01 + Patient 8 22.4 31.1 + Patient 9 3.85 5.06 + Patient 9 34.4 37.8 + Patient 10 3.37 2.20 + Patient 10 76.1 42.3 + Patient 11 4.38 9.66 + Patient 11 18.6 32.8 + Patient 12 3.42 2.79 − Patient 12 33.5 86.7 − Patient 13 3.50 5.41 + Patient 13 27.7 47.3 + Patient 14 4.85 6.70 + Patient 14 33.7 74.5 + Patient 15 4.03 2.65 + Patient 15 NA NA +
NA (not available): in patient 15, the splenic parenchyma was outside the field of view, making the calculation of relative values impossible.
+, Responders; −, nonresponders.
Get Radiology Tree app to read full this article<
Statistical Analysis
Get Radiology Tree app to read full this article<
Results
Clinical and Radiologic Follow-up
Get Radiology Tree app to read full this article<
Get Radiology Tree app to read full this article<
MR Imaging and Perfusion Measurements
Get Radiology Tree app to read full this article<
Get Radiology Tree app to read full this article<
Get Radiology Tree app to read full this article<
Get Radiology Tree app to read full this article<
Discussion
Get Radiology Tree app to read full this article<
Get Radiology Tree app to read full this article<
Get Radiology Tree app to read full this article<
Get Radiology Tree app to read full this article<
Conclusion
Get Radiology Tree app to read full this article<
References
1. Boyer T.D., Haskal Z.J.: American Association for the Study of Liver Diseases Practice Guidelines: The role of transjugular intrahepatic portosystemic shunt creation in the management of portal hypertension. J Vasc Interv Radiol 2005; 16: pp. 615-629.
2. Maleux G., Nevens F., Wilmer A., et. al.: Early and long-term clinical and radiological follow-up results of expanded-polytetrafluoroethylene-covered stent-grafts for transjugular intrahepatic portosystemic shunt procedures. Eur Radiol 2004; 14: pp. 1842-1850.
3. Malinchoc M., Kamath P.S., Gordon F.D., Peine C.J., Rank J., terBorg P.C.J.: A model to predict poor survival in patients undergoing transjugulat intrahepatic portosystemic shunts. Hepatology 2000; 31: pp. 864-871.
4. Patel N.H., Sasadeusz K.J., Seshadri R., et. al.: Increase in hepatic arterial blood flow after transjugular intrahepatic portosystemic shunt creation and its potential predictive value of postprocedural encephalopathy and mortality. J Vasc Interv Radiol 2001; 12: pp. 1279-1284.
5. Walser E.M., DeLa Pena R., Villanueva-Meyer J., Ozkan O., Soloway R.: Hepatic perfusion before and after the transjugular intrahepatic portosystemic shunt procedure: Impact on survival. J Vasc Interv Radiol 2000; 11: pp. 913-918.
6. Walser E., Ozkan O.S., Raza S., Soloway R., Gajula L.: Hepatic perfusion as a predictor of mortality after transjugular intrahepatic portosystemic shunt creation in patients with refractory ascites. J Vasc Interv Radiol 2003; 14: pp. 1251-1257.
7. Coenegrachts K., Van Steenbergen W., De Keyzer F., et. al.: Dynamic contrast-enhanced MRI of the pancreas: Initial results in healthy volunteers and patients with chronic pancreatitis. J Magn Reson Imaging 2004; 20: pp. 990-997.
8. Peron J.M., Barange K., Otal P., et. al.: Transjugular intrahepatic portosystemic shunts in the treatment of refractory ascites: Results in 48 consecutive patients. J Vasc Interv Radiol 2000; 11: pp. 1211-1216.
9. Ferral H., Bjarnason H., Wegryn S.A., et. al.: Refractory ascites: Early experience in treatment with transjugular intrahepatic portosystemic shunt. Radiology 1993; 189: pp. 795-801.
10. Weidekamm C., Cejna M., Kramer L., Peck-Radosavljevic M., Bader T.R.: Effects of TIPS on liver perfusion measured by dynamic CT. AJR Am J Roentgenol 2005; 184: pp. 505-510.