
Rationale and Objectives
This study aimed to evaluate the effects of educating radiology residents and radiographers about radiation exposure on reduction of dose area product (DAP) and fluoroscopy time in diagnostic fluoroscopy of the gastrointestinal (GI) tract in adult patients.
Materials and Methods
In April 2015, we offered 1 hour of education to radiology residents and radiographers on how to reduce radiation doses during fluoroscopic examinations. Fluoroscopic examinations of the GI tracts of adult patients performed from June 2014 to February 2016 were evaluated. A total of 2326 fluoroscopic examinations (779 and 1547 examinations before and after education, respectively) were performed, including 10 kinds of examinations. Fluoroscopy time and DAP were collected. A radiologist evaluated the number of spot images, captured images, cine video, captured video, and the use of collimation or magnification. We used the Mann-Whitney U test to assess the difference in fluoroscopy-related factors before and after education.
Results
Median DAP decreased significantly after education, from 21.1 to 18.2 Gy∙cm 2 ( P < .001) in all examinations. After education DAP decreased significantly in defecography ( P < .001) and fluoroscopy time decreased significantly in upper gastrointestinal series with water-soluble contrast ( P < .001). Spot and cine images that increased the radiation dose were used less frequently after education than before in some kinds of examinations, especially in defecography ( P < .001). More images were collimated after education in barium swallow than before ( P < .001).
Conclusions
Educating radiologist residents and radiographers could reduce DAP in fluoroscopy examinations of the GI tract in adult patients.
Introduction
Radiation exposure from medical examinations has been increasing consistently . Although computed tomography is regarded as an important source of radiation, fluoroscopy should also be considered . Fluoroscopy is still used for functional evaluations, but radiation exposure from fluoroscopy is often neglected . Many studies have focused on radiation exposure from fluoroscopy in children, but few studies have paid attention to radiation exposure in adults . Fluoroscopy examinations of adult patients should also follow the as-low-as-reasonably-achievable principle to decrease radiation exposure.
A noticeable feature of fluoroscopy examination is that radiation exposure can depend on who performs the examination . The protocols for fluoroscopy examinations can be flexible depending on the circumstances of each examination, including patient condition, anatomical variants, and the purpose of the examination. Because radiologists and nonradiologist physicians operate fluoroscopy machines regardless of their experience or knowledge about radiation protection and reduction exposure during fluoroscopy, less experienced trainees and radiographers may not have optimal fluoroscopic technique which could therefore lead to increased radiation dose. Radiographers’ awareness of radiation is also important as they assist during fluoroscopic examinations carried out according to nonradiologists’ instructions. Different levels of knowledge about radiation have been reported among medical staff from different professions and workplaces, as well as among doctors with different specialties, positions, and experience .
Get Radiology Tree app to read full this article<
Get Radiology Tree app to read full this article<
Materials and Methods
Get Radiology Tree app to read full this article<
Get Radiology Tree app to read full this article<
Get Radiology Tree app to read full this article<
Statistical Analysis
Get Radiology Tree app to read full this article<
Get Radiology Tree app to read full this article<
Get Radiology Tree app to read full this article<
Results
Get Radiology Tree app to read full this article<
TABLE 1
Demographic Factors of Patients Who Received Fluoroscopy Examination Before and After Education for Radiology Residents and Radiographers
Before After_P_ Value Age (y) 62.7 ± 15.4 63.7 ± 15.4 .137 Weight (kg) 59.4 ± 12.0 59.6 ± 11.6 .283 Height (cm) 163.0 ± 8.5 163.4 ± 8.6 .596 BMI (kg/m 2 ) 22.3 ± 3.7 22.3 ± 3.5 .872
BMI, body mass index.
TABLE 2
Number of Examinations Before and After Education
Before After Total Colon study, WSC 39 35 74 Colon study, barium 4 50 54 Defecography 47 20 67 Esophagography, WSC 55 62 117 Esophagography, barium 104 173 277 SBS, WSC 90 109 199 SBS, barium 8 16 24 UGI, WSC 143 180 323 UGI, barium 6 20 26 Barium swallow 283 882 1165
SBS, small bowel series; UGI, upper gastrointestinal series; WSC, water-soluble contrast.
Get Radiology Tree app to read full this article<
Get Radiology Tree app to read full this article<
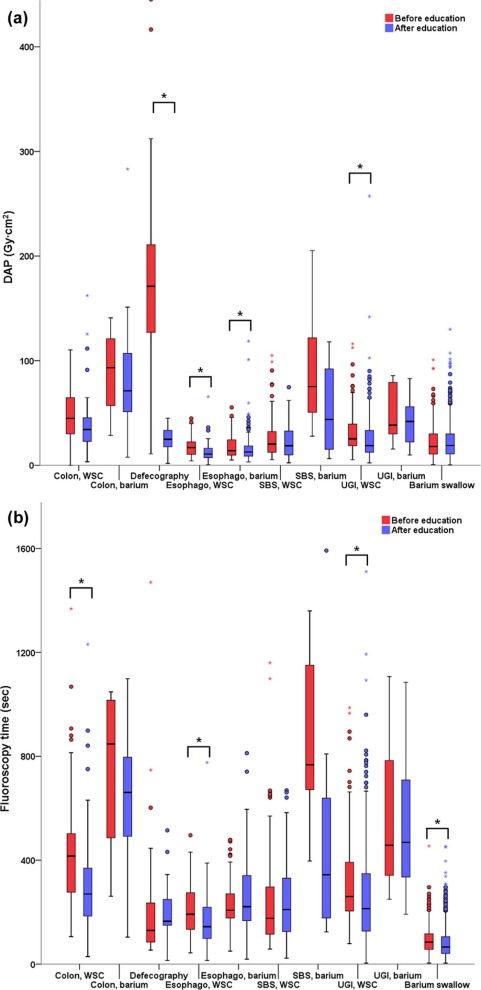
TABLE 3
Changes in the Number of Total Images, Proportion of Spot Images in the Sum of Spot and Captured Images, and Proportion of Time for Cine Images in the Time for Cine and Captured Video Images
Number of Total Images Proportion of Spot Image (%) Proportion of Time to Obtain Cine Images (%) Before Education After Education_P_ Value Before Education After Education_P_ Value Before Education After Education_P_ Value Colon study, WSC 23.3 ± 9.5
(22, 16–29) 19.5 ± 8.1
(19, 13–25) .064 37.3 ± 23.9
(38.1, 18.2–50.0) 45.9 ± 25.5
(47.2, 30.8–60.0) .102 — — Colon study, barium 27.8 ± 9.9
(30, 17.5–35.8) 29.2 ± 9.4
(30, 24–34.3) .987 75.8 ± 17.8
(71.2, 61.6–94.5) 71.7 ± 20.3
(78.4, 57.9–85.3) .974 — — Defecography 10.7 ± 3.6
(10, 8–13) 10.7 ± 2.5
(11, 9–12) .619 76.4 ± 24.3
(83.3, 57.1–100.0) 0.7 ± 3.2
(0, 0–0) <.001 91.7 ± 22.3
(100.0, 95.0–100.0) 0
(0, 0–0) <.001 Esophagography, WSC 14.9 ± 6.3
(14, 11–18) 13.6 ± 8.0
(13, 9–15) .070 59.5 ± 24.5
(57.1, 40.0–77.8) 58.2 ± 29.8
(42.9, 22.2–60.0) .671 78.8 ± 35.5
(100.0, 74.0–100.0) 41.1 ± 37.6
(38.0, 0–71.0) <.001 Esophagography, barium 20.2 ± 7.3
(19, 15.3–24) 18.8 ± 6.8
(18, 14–22) .157 58.7 ± 24.4
(56.5, 38.4–76.9) 71.6 ± 21.7
(72.2, 55.9–90.5) <.001 85.2 ± 30.4
(100.0, 100.0–100.0) 29.7 ± 0.38
(0, 0–52.0) <.001 SBS, WSC 17.4 ± 9.0
(15, 12–21) 16.1 ± 7.5
(14, 10.5–20) .402 52.2 ± 23.4
(45.8, 37.8–64.4) 56.0 ± 26.9
(56.5, 33.3–76.8) .289 50.0 ± 51.9
(50.0, 0–100.0) 7.6 ± 23.4
(0, 0–0) .001 SBS, barium 46.0 ± 18.2
(40.5, 32.3–66.8) 41.0 ± 16.8
(38, 30–48) .528 39.5 ± 20.6
(38.4, 19.6–57.1) 71.2 ± 31.2
(85.0, 61.7–91.3) .016 — — UGI, WSC 22.0 ± 9.7
(20, 16–26) 17.1 ± 8.8
(15, 12–19) <.001 47.7 ± 21.9
(43.8, 33.3–60.0) 54.8 ± 27.0
(31.8, 55.6–76.7) .017 25.3 ± 41.8
(0, 0–71.0) 30.0 ± 40.2
(0, 0–67.0) .257 UGI, barium 27.5 ± 10.5
(23.5, 20.8–33.8) 28.0 ± 11.5
(29, 20–32) .783 74.8 ± 23.7
(78.8, 52.6–96.3) 68.4 ± 31.0
(78.4, 44.1–92.1) .790 Barium swallow 8.4 ± 4.0
(8, 6–11) 7.9 ± 3.5
(8, 5–10) .074 79.9 ± 29.0
(100.0, 50.0–100.0) 84.5 ± 28.6
(100.0, 96.4–100.0) .005 96.8 ± 0.08
(100.0, 96.0–100.0) 97.8 ± 9.4
(100.0, 100.0–100.0) <.001
SBS, small bowel series; UGI, upper gastrointestinal series; WSC, water-soluble contrast.
Data are presented as mean ± standard deviation (median, range).
TABLE 4
Change in Ratio of Collimated Images and Magnified Images to Total Images in Each Type of Examination
Collimation/Total (%) Magnification/Total (%) Before After_P_ Value Before After_P_ Value Colon study, WSC 75.7 ± 19.1
(80.0, 71.0–88.0) 71.3 ± 21.1
(78.0, 56.0–88.0) .392 17.9 ± 25.5
(5.0, 0–33.0) 19.2 ± 25.8
(0, 6.0–35.0) .863 Colon study, barium 50.8 ± 35.8
(56.0, 14.0–82.2) 64.3 ± 26.9
(73.5, 49.0–84.3 .396 24.8 ± 21.3
(27.5, 3.5–43.3) 31.2 ± 22.8
(31.5, 10.8–50.5) .534 Defecography 97.6 ± 3.4
(100.0, 100.0–100.0) 100.0 ± 0
(100.0, 100.0–100.0) .052 33.3 ± 12.6
(0, 0–0) 0
(0, 0–0) .097 Esophagography, WSC 82.6 ± 10.9
(85.0, 75.0–90.0) 85.9 ± 9.0
(87.0, 80.8–93.0) .138 16.1 ± 26.7
(0, 0–24.0) 9.9 ± 19.9
(0, 0–11.5) .186 Esophagography, barium 90.1 ± 7.3
(93.0, 88.0–94.0) 90.1 ± 11.3
(92.0, 88.0–95.0) .509 21.1 ± 18.9
(21.5, 0–35.0) 29.9 ± 20.8
(29.0, 18.5–43.0) <.001 SBS, WSC 62.1 ± 22.2
(69.0, 50.0–77.3) 62.1 ± 24.0
(65.0, 46.0–79.0) .878 6.1 ± 15.2
(0, 0–0) 12.3 ± 20.7
(0, 0–18.0) .010 SBS, barium 43.1 ± 34.5
(34.0, 14.5–82.3) 59.7 ± 32.3
(75.5, 22.3–87.0) .452 34.3 ± 27.3
(36.5, 4.8–59.8) 46.5 ± 33.5
(51.0, 10.3–76.8) .350 UGI, WSC 71.1 ± 20.9
(77.0, 61.0–87.0) 73.4 ± 19.6
(75.0, 64.0–88.80) .565 14.6 ± 21.5
(0, 0–26.0) 18.4 ± 26.7
(0, 0–40.3) .473 UGI, barium 76.7 ± 15.2
(76.5, 65.5–92.3) 81.3 ± 18.5
(1.5, 0–12.3) .421 37.2 ± 36.5
(35.5, 0–71.0) 24.1 ± 29.7
(12.5, 0–48.5) .494 Barium swallow 4.9 ± 16.3
(0, 0–0) 65.7 ± 44.4
(0, 100.0–100.0) <.001 0.7 ± 7.7
(0, 0–0) 0
(0, 0–0) .012
SBS, small bowel series; UGI, upper gastrointestinal series; WSC, water-soluble contrast.
Data are presented as mean ± standard deviation (median, range).
Get Radiology Tree app to read full this article<
Discussion
Get Radiology Tree app to read full this article<
Get Radiology Tree app to read full this article<
Get Radiology Tree app to read full this article<
Get Radiology Tree app to read full this article<
Get Radiology Tree app to read full this article<
Get Radiology Tree app to read full this article<
Get Radiology Tree app to read full this article<
References
1. Scanff P., Donadieu J., Pirard P., et. al.: Population exposure to ionizing radiation from medical examinations in France. Br J Radiol 2008; 81: pp. 204-213.
2. Hart D., Hillier M.C., Shrimpton P.C.. Doses to patients from radiographic and flouroscopic x-ray imaging procedures in the UK - 2010 review. HPA-CRCE-0342012; 2012.
3. Hart D., Wall B.F.: Radiation exposure of the UK population from medical and dental X-ray examinations. NRPB-W4 Report. Chilton, UK: National Radiological Protection Board2002.
4. Livingstone R.S., Koshy C.G., Raj D.V.: Evaluation of work practices and radiation dose during adult micturating cystourethrography examinations performed using a digital imaging system. Br J Radiol 2004; 77: pp. 927-930.
5. Arbique G.M., Gilleran J.P., Guild J.B., et. al.: Radiation exposure during standing voiding cystourethrography in women. Urology 2006; 67: pp. 269-274.
6. Lederman H.M., Khademian Z.P., Felice M., et. al.: Dose reduction fluoroscopy in pediatrics. Pediatr Radiol 2002; 32: pp. 844-848.
7. Bernhardt P., Lendl M., Deinzer F.: New technologies to reduce pediatric radiation doses. Pediatr Radiol 2006; 36: pp. 212-215.
8. Leschied J.R., Glazer D.I., Bailey J.E., et. al.: Improving our PRODUCT: a quality and safety improvement project demonstrating the value of a preprocedural checklist for fluoroscopy. Acad Radiol 2015; 22: pp. 400-407.
9. Ghodadra A., Bartoletti S.: Reducing radiation dose in pediatric diagnostic fluoroscopy. J Am Coll Radiol 2016; 13: pp. 55-58.
10. Lee R.K., Chu W.C., Graham C.A., et. al.: Knowledge of radiation exposure in common radiological investigations: a comparison between radiologists and non-radiologists. Emerg Med J 2012; 29: pp. 306-308.
11. Wong C.S., Huang B., Sin H.K., et. al.: A questionnaire study assessing local physicians, radiologists and interns’ knowledge and practice pertaining to radiation exposure related to radiological imaging. Eur J Radiol 2012; 81: pp. e264-e268.
12. Ramanathan S., Ryan J.: Radiation awareness among radiology residents, technologists, fellows and staff: where do we stand?. Insights Imaging 2015; 6: pp. 133-139.
13. Szarmach A., Piskunowicz M., Swieton D., et. al.: Radiation safety awareness among medical staff. Pol J Radiol 2015; 80: pp. 57-61.
14. Hernanz-Schulman M., Goske M.J., Bercha I.H., et. al.: Pause and pulse: ten steps that help manage radiation dose during pediatric fluoroscopy. AJR Am J Roentgenol 2011; 197: pp. 475-481.
15. Frederick-Dyer K.C., Faulkner A.R., Chang T.T., et. al.: Online training on the safe use of fluoroscopy can result in a significant decrease in patient dose. Acad Radiol 2013; 20: pp. 1272-1277.
16. Kuon E., Weitmann K., Hoffmann W., et. al.: Efficacy of a minicourse in radiation-reducing techniques in invasive cardiology: a multicenter field study. JACC Cardiovasc Interv 2014; 7: pp. 382-390.
17. Strauss K.J.: Pediatric interventional radiography equipment: safety considerations. Pediatr Radiol 2006; 36: pp. 126-135.
18. Strauss K.J., Kaste S.C.: ALARA in pediatric interventional and fluoroscopic imaging: striving to keep radiation doses as low as possible during fluoroscopy of pediatric patients—a white paper executive summary. J Am Coll Radiol 2006; 3: pp. 686-688.
19. Yu S.K., Cheung Y.K., Chan T.L., et. al.: Reduction of radiation dose to patients undergoing barium enema by dose audit. Br J Radiol 2001; 74: pp. 162-165.
20. Duncan J.R., Street M., Strother M., et. al.: Optimizing radiation use during fluoroscopic procedures: a quality and safety improvement project. J Am Coll Radiol 2013; 10: pp. 847-853.
21. Lim R., Khawaja R.D., Nimkin K., et. al.: Relationship between radiologist training level and fluoroscopy time for voiding cystourethrography. AJR Am J Roentgenol 2013; 200: pp. 645-651.
22. Belanger B., Boudry J.: Management of pediatric radiation dose using GE fluoroscopic equipment. Pediatr Radiol 2006; 36: pp. 204-211.
23. Hernandez R.J., Goodsitt MM.: Reduction of radiation dose in pediatric patients using pulsed fluoroscopy. AJR Am J Roentgenol 1996; 167: pp. 1247-1253.
24. Mahesh M., Detorie N., Strauss K.J.: ALARA in pediatric fluoroscopy. J Am Coll Radiol 2007; 4: pp. 931-933.