
Rationale and Objectives
To analyze the effect of a computer-aided diagnosis (CAD) system on clinicians’ performance in detection of small acute intracranial hemorrhage (AIH) on computed tomography (CT).
Materials and Methods
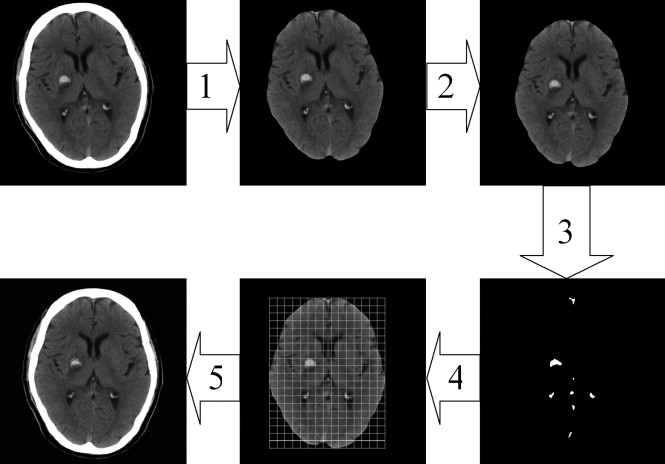
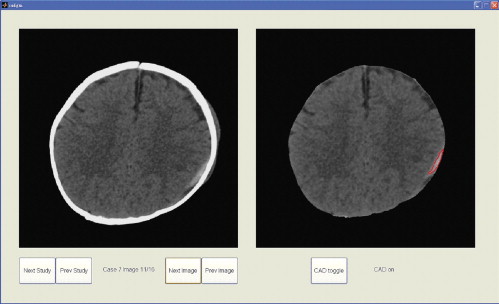
The authors have developed a CAD scheme that used both image processing techniques and anatomic knowledge based classification system to improve diagnosis of small AIH on CT. A multiple-reader, multiple-case receiver operating characteristic (ROC) study was performed. Twenty clinicians, including seven emergency physicians, seven radiology residents, and six radiology specialists were recruited as readers of 60 sets of brain CT, including 30 cases that show AIH smaller than 1 cm, and 30 controls. Each reader read the same 60 cases twice, first without, then with the prompts produced by the CAD system. The clinicians ranked their confidence in diagnosing a case of showing AIH, which produced the ROC curves.
Results
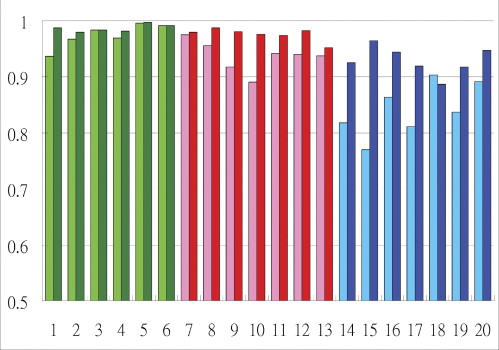
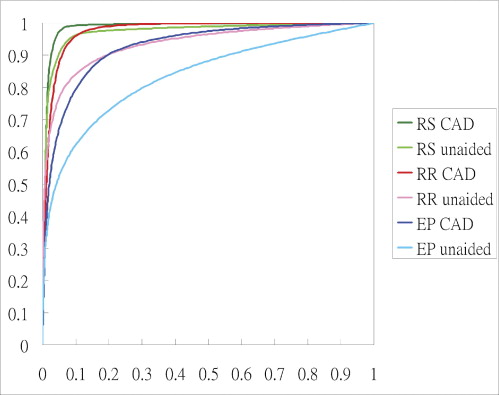
Significantly improved performance is observed in emergency physicians, average area under the ROC curve (Az) increased from 0.8422 to 0.9294 ( P = .0107) when they make the diagnosis without and with the support of CAD. Az for radiology residents increased from 0.9371 to 0.9762 ( P = .0088). Az for radiology specialists increased from 0.9742 to 0.9868, but was statistically insignificant ( P = .1755).
Conclusions
CAD can improve the clinicians’ performance in detecting AIH on CT. In particular, emergency physicians can benefit most from the CAD and improve their performance to a level approaching that of the average radiology residents.
Acute intracranial hemorrhage (AIH) is recent (<72 hours) bleeding inside skull. It can be the result of stroke or complication of head injury. The presence or absence of AIH requires different treatment strategies and its identification is of prime importance for triage of patients suffering from acute neurologic disturbance or head injury. However, it is well recognized that clinical findings cannot accurately differentiate between patients with AIH and those who suffer from other neurologic emergencies. Therefore neuroimaging findings are essential for immediate management decision making ( ). Computed tomography (CT) has been the modality of choice for evaluating suspected AIH because it is widely available, quick to perform, and compatible with most life support devices. On CT images, acute blood clot shows higher attenuation than normal brain parenchyma ( ). The contrast between AIH and the adjacent structures depends on intrinsic physical properties of blood clot including the density, volume, location; relationship to surrounding structures; and technical factors including scanning angle, slice thickness, and windowing ( ). Although diagnosis of AIH on CT is usually straightforward, identification of the demonstrable AIH on CT can become difficult when the lesion is inconspicuous (eg, small or being masked by normal structures, or when the reader is inexperienced).
In most parts of the world outside the United States, acute care physicians, including emergency physicians, internists, or neural surgeons, are the only ones to read the CT images at odd hours, when radiologists’ expertise may not be immediately available. This may not be a desirable arrangement because the skill of acute care physicians regarding interpretation of brain CT has been shown to be imperfect ( ). Even radiology residents can, albeit infrequently, overlook hemorrhage on brain CT ( ). Therefore the authors have developed a CAD system that identifies small AIH to help in the management of patients suffering from acute neurologic disturbance or head injury in an emergent setting ( ).
Get Radiology Tree app to read full this article<
Materials and methods
Computed-assisted Diagnosis Algorithm
Get Radiology Tree app to read full this article<
Get Radiology Tree app to read full this article<
Get Radiology Tree app to read full this article<
Get Radiology Tree app to read full this article<
Get Radiology Tree app to read full this article<
Get Radiology Tree app to read full this article<
Get Radiology Tree app to read full this article<
Get Radiology Tree app to read full this article<
Get Radiology Tree app to read full this article<
Get Radiology Tree app to read full this article<
Get Radiology Tree app to read full this article<
Get Radiology Tree app to read full this article<
Get Radiology Tree app to read full this article<
Get Radiology Tree app to read full this article<
CAD Evaluation
Get Radiology Tree app to read full this article<
Observer Performance Study
Get Radiology Tree app to read full this article<
Get Radiology Tree app to read full this article<
Get Radiology Tree app to read full this article<
Get Radiology Tree app to read full this article<
Get Radiology Tree app to read full this article<
Get Radiology Tree app to read full this article<
Get Radiology Tree app to read full this article<
Get Radiology Tree app to read full this article<
Get Radiology Tree app to read full this article<
Get Radiology Tree app to read full this article<
Results
Get Radiology Tree app to read full this article<
Get Radiology Tree app to read full this article<
Get Radiology Tree app to read full this article<
Get Radiology Tree app to read full this article<
Get Radiology Tree app to read full this article<
Get Radiology Tree app to read full this article<
Get Radiology Tree app to read full this article<
Table 1
Average Performance Indicators Including Sensitivity, Specificity, Positive Predictive Value, and Negative Predictive Value for Different Clinician Groups With and Without Computer-Assisted Diagnosis Support
% Emergency Physicians Radiology Residents Board-Certified Radiology Specialists Unaided Computer-Assisted Diagnosis Unaided Computer-Assisted Diagnosis Unaided Computer-Assisted Diagnosis Sensitivity 73.3 80.4 86.2 93.8 92.2 95.0 Specificity 81.4 90.5 88.1 92.9 93.3 94.4 Positive predictive value 80.0 89.5 88.4 93.0 93.3 94.5 Negative predictive value 75.7 82.5 86.7 93.8 92.6 95.1
All indicators in all clinician groups are improved after use of computer-assisted diagnosis.
Get Radiology Tree app to read full this article<
Get Radiology Tree app to read full this article<
Get Radiology Tree app to read full this article<
Get Radiology Tree app to read full this article<
Get Radiology Tree app to read full this article<
Get Radiology Tree app to read full this article<
Table 2
Number of Cases in Which Clinicians Change Their Diagnostic Decision After CAD
EP RR RS Correct change (% of actual no. of change) 46 (79.3%) 29 (90.6%) 7 (100%) Incorrect change (% of actual no. of change) 12 (20.7%) 3 (9.4%) 0 (0%) Frequency of change in decision 58 32 7 % Change in decision/total possible change 13.8% (58/420) 7.6% (32/420) 1.9% (7/360)
CAD: computed-assisted diagnosis; EP: emergency physician; RR: radiology residents; RS: radiology specialists.
The proportion of correct change relative to incorrect change increased from EP to RR to RS. The total and relative number of change decreased from EP to RR to RS.
Get Radiology Tree app to read full this article<
Discussion
CAD for Clinicians Other Than Radiologists
Get Radiology Tree app to read full this article<
Get Radiology Tree app to read full this article<
Get Radiology Tree app to read full this article<
Get Radiology Tree app to read full this article<
Get Radiology Tree app to read full this article<
Choice of Small Lesion in Development and Validation of the CAD
Get Radiology Tree app to read full this article<
Get Radiology Tree app to read full this article<
Limitations of the Study
Get Radiology Tree app to read full this article<
Get Radiology Tree app to read full this article<
Get Radiology Tree app to read full this article<
Get Radiology Tree app to read full this article<
Get Radiology Tree app to read full this article<
Get Radiology Tree app to read full this article<
Get Radiology Tree app to read full this article<
Future Improvement
Get Radiology Tree app to read full this article<
Get Radiology Tree app to read full this article<
Get Radiology Tree app to read full this article<
Get Radiology Tree app to read full this article<
Conclusion
Get Radiology Tree app to read full this article<
References
1. Broderick J.P., Connolly S., Feldman E., et. al.: Guidelines for the management of spontaneous intracerebral hemorrhage: a statement for healthcare professionals from a special writing group of the Stroke Council, American Heart Association. Stroke 1999; 30: pp. 905-915.
2. Panagos P.D., Jauch E.C., Broderick J.P.: Intracerebral hemorrhage. Emerg Med Clin North Am 2002; 20: pp. 631-655.
3. Mullins M.E.: Modern emergent stroke imaging: pearls, protocols, and pitfalls. Radiol Clin North Am 2006; 44: pp. 41-62.
4. Jagoda A.S., Cantrill S.V., Wears R.L., et. al.: Clinical policy: neuroimaging and decisionmaking in adult mild traumatic brain injury in the acute setting. Ann Emerg Med 2002; 40: pp. 231-249.
5. Norman D., Price D., Boyd D., et. al.: Quantitative aspects of computed tomography of the blood and cerebrospinal fluid. Radiology 1977; 123: pp. 335-338.
6. Cohen W., Wayman L.: Computed tomography of intracranial hemorrhage. Neuroimaging Clin N Am 1992; 2: pp. 75-87.
7. Schriger D.L., Kalafut M., Starkman S., et. al.: Cranial computed tomography interpretation in acute stroke: physician accuracy in determining eligibility for thrombolytic therapy. JAMA 1998; 279: pp. 1293-1297.
8. Wysoki M.G., Nassar C.J., Koenigsberg R.A., et. al.: Head trauma: CT scan interpretation by radiology residents versus staff radiologists. Radiology 1998; 208: pp. 125-128.
9. Chan T., Huang H.K.: Computer aided detection of small acute intracranial hemorrhage on computer tomography of brain. Comput Med Imaging Graph 2007; 31: pp. 285-298.
10. Ducan J., Ayache N.: Medical image analysis: progress over two decades and the challenges ahead. IEEE Trans Pattern Anal Machine Intel 2000; 22: pp. 85-106.
11. Erickson B.J., Bartholmai B.: Computer-aided detection and diagnosis at the start of the third millennium. J Digit Imaging 2002; 15: pp. 59-68.
12. Talairach J., Tournoux P.: Co-planar stereotaxic atlas of the human brain: 3-dimensional proportional system: an approach to cerebral imaging.1988.G. ThiemeNew York
13. Doi K.: Current status and future potential of computer-aided diagnosis in medical imaging. Br J Radiol 2005; 78: pp. S3-S19.
14. Dorfman D.D., Berbaum K.S., Metz C.E.: Receiver operating characteristic rating analysis. Invest Radiol 1992; 27: pp. 723-731.
15. Wagner R.F., Beiden S.V., Campbell G., et. al.: Assessment of medical imaging and computer-assist systems: lessons from recent experience. Acad Radiol 2002; 9: pp. 1264-1277.
16. Lev M.H., Farkas J., Gemmete J.J., et. al.: Acute stroke: improved nonenhanced CT detection—benefits of soft-copy interpretation by using variable window width and center level settings. Radiology 1999; 213: pp. 150-155.
17. LABMRMC: http://xray.bsd.uchicago.edu/krl/KRL_ROC/software_index.htm Accessed November 5, 2007
18. Alberdi E., Povykalo A., Strigini L., et. al.: Effects of incorrect computer-aided detection (CAD) output on human decision-making in mammography. Acad Radiol 2004; 11: pp. 909-918.
19. Metz C.E.: Some practical issues of experimental design and data analysis in radiological ROC studies. Invest Radiol 1989; 24: pp. 234-245.
20. Kobayashi T., Xu X.W., MacMahon M., et. al.: Effect of a computer-aided diagnosis scheme on radiologists’ performance in detection of lung nodules on radiographs. Radiology 1996; 199: pp. 843-848.
21. Metz C.E.: Handbook of medical imaging. Vol 1. Physics and psychophysics.Beutel J.Kundel H.L.Van Metter R.L.Fundamental ROC analysis.2000.SPIE PressBellingham, Wash:pp. 751-769.
22. Beiden S.V., Wagner R.F., Doi K., et. al.: Independent versus sequential reading in ROC studies of computer-assist modalities: analysis of components of variance. Acad Radiol 2002; 9: pp. 1036-1043.
23. Gur D.: ROC-type assessments of medical imaging and CAD technologies: a perspective. Acad Radiol 2003; 10: pp. 402-403.
24. Partain C.L., Chan H.P., Gelovani J.G., et. al.: Biomedical Imaging Research Opportunities Workshop II: report and recommendations. Radiology 2005; 236: pp. 389-403.