
Rationale and Objectives
To evaluate the effect of automatic tube current modulation on radiation dose and image quality for low tube voltage computed tomography (CT) angiography.
Materials and Methods
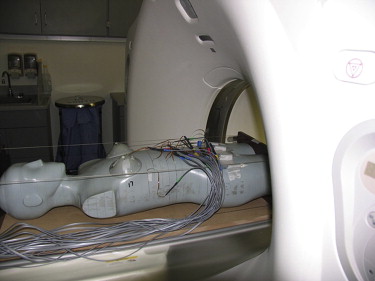
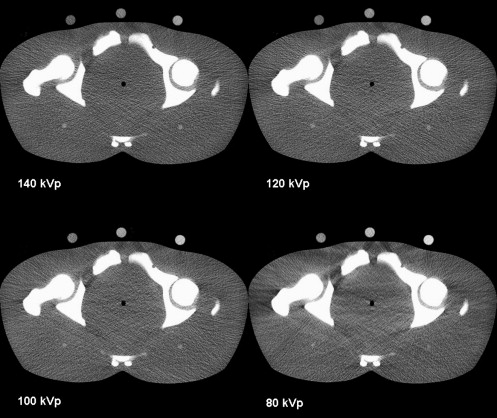
An anthropomorphic phantom was scanned with a 64-section CT scanner using following tube voltages: 140 kVp (Protocol A), 120 kVp (Protocol B), 100 kVp (Protocol C), and 80 kVp (Protocol D). To achieve similar noise, combined z-axis and xy-axes automatic tube current modulation was applied. Effective dose (ED) for the four tube voltages was assessed. Three plastic vials filled with different concentrations of iodinated solution were placed on the phantom’s abdomen to obtain attenuation measurements. The signal-to-noise ratio (SNR) was calculated and a figure of merit (FOM) for each iodinated solution was computed as SNR 2 /ED.
Results
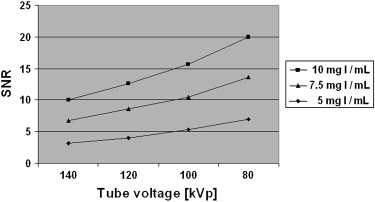
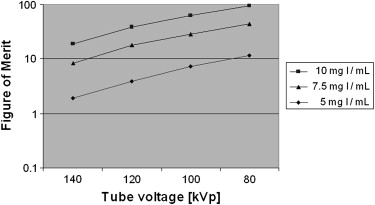
The ED was kept similar for the four different tube voltages: (A) 5.4 mSv ± 0.3, (B) 4.1 mSv ± 0.6, (C) 3.9 mSv ± 0.5, and (D) 4.2 mSv ± 0.3 ( P > .05). As the tube voltage decreased from 140 to 80 kVp, image noise was maintained (range, 13.8–14.9 HU) ( P > .05). SNR increased as the tube voltage decreased, with an overall gain of 119% for the 80-kVp compared to the 140-kVp protocol ( P < .05). The FOM results indicated that with a reduction of the tube voltage from 140 to 120, 100, and 80 kVp, at constant SNR, ED was reduced by a factor of 2.1, 3.3, and 5.1, respectively, (P < .001).
Conclusions
As tube voltage decreases, automatic tube current modulation for CT angiography yields either a significant increase in image quality at constant radiation dose or a significant decrease in radiation dose at a constant image quality.
Within the last decade, multidetector row computed tomography (CT) angiography has become a major diagnostic imaging tool to evaluate noninvasively the arterial system of the brain, heart, and body, including the extremities. The main shortcoming of CT angiography remains patient exposure to ionizing radiation. To reduce radiation dose to the patient, various authors have suggested lowering the peak tube voltage to 100 or 90 kVp for CT angiography of the pulmonary arteries, aortoiliac system, and circle of Willis (1–4). Besides decreasing radiation dose, the low tube voltage technique improves vascular enhancement because iodinated contrast material demonstrates higher attenuation levels at lower x-ray tube voltages owing to a greater photoelectric effect (closer to the k edge of iodine) and decreased Compton scattering. The disadvantage of low tube voltage CT angiography is its greater image noise, although this can be offset by increasing the tube current to maintain image quality.
Some of the published studies on low tube voltage CT angiography relied on the manual adjustment of the tube current setting by the operator . However, current state-of-the-art multidetector row CT scanners include automatic tube current modulation, which modulates the tube current according to the x-ray attenuation of the patient section being scanned to keep the radiation exposure as low as possible and to obtain images with a constant, prespecified image noise. The technique also automatically increases the tube current to match lower tube voltages to maintain a constant image noise. To date, very limited data on low tube voltage CT angiography with automatic tube current modulation are available . To optimize low tube voltage CT angiography protocols using automatic tube current modulation, the maximum efficacy of the technique on radiation dose and image quality has to be assessed. These data can be only acquired in an in vitro study because of the high risk of accumulated radiation dose to investigated patients.
Get Radiology Tree app to read full this article<
Materials and methods
Anthropomorphic Phantom
Get Radiology Tree app to read full this article<
Get Radiology Tree app to read full this article<
CT Scanning
Get Radiology Tree app to read full this article<
Radiation Dose Assessment and Statistical Analysis
Get Radiology Tree app to read full this article<
Get Radiology Tree app to read full this article<
Get Radiology Tree app to read full this article<
Get Radiology Tree app to read full this article<
Image Quality Assessment and Statistical Analysis
Get Radiology Tree app to read full this article<
SNR=ROIIS/noise SNR
=
ROI
IS
/
noise
where ROI IS is the mean attenuation value of the iodinated solution, and noise is the mean image noise.
Get Radiology Tree app to read full this article<
Get Radiology Tree app to read full this article<
FOM=SNR2/ED FOM
=
SNR
2
/
ED
for each of the three iodinated solutions at each of the four tube voltages.
Get Radiology Tree app to read full this article<
Get Radiology Tree app to read full this article<
Results
Effective Dose
Get Radiology Tree app to read full this article<
Table 1
Radiation Dose, Image Noise, Mean Tube Current, Range of Tube Current, and Signal-to-noise Ratio
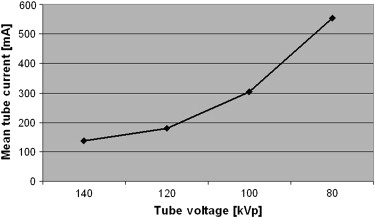
Protocol A (140 kVp) Protocol B (120 kVp) Protocol C (100 kVp) Protocol D (80 kVp) Effective dose (mSv) 5.38 ± 0.33 4.06 ± 0.61 3.89 ± 0.46 4.15 ± 0.30 Image noise (HU) 14.0 ± 0.6 13.8 ± 0.3 14.2 ± 0.6 14.9 ± 0.5 Mean tube current (mA) 132.2 ± 50.3 173.0 ± 66.7 293.4 ± 112.1 538.1 ± 172.9 Tube current range (mA) 59–179 76–235 131–398 270–670 SNR: Tube 1 (5 mg I/mL) 3.2 ± 0.2 4.0 ± 0.1 5.3 ± 0.9 7.0 ± 0.6 Tube 2 (7.5 mg I/mL) 6.7 ± 0.3 8.6 ± 0.3 10.5 ± 1.1 13.7 ± 1.0 Tube 3 (10 mg I/mL) 10.1 ± 0.3 12.6 ± 0.1 15.7 ± 1.3 20.0 ± 0.9
Note.—Data are mean values ± standard deviation of the means.
Get Radiology Tree app to read full this article<
Image Quality Assessment
Get Radiology Tree app to read full this article<
Get Radiology Tree app to read full this article<
Get Radiology Tree app to read full this article<
Get Radiology Tree app to read full this article<
Get Radiology Tree app to read full this article<
Get Radiology Tree app to read full this article<
Discussion
Get Radiology Tree app to read full this article<
Get Radiology Tree app to read full this article<
Get Radiology Tree app to read full this article<
Get Radiology Tree app to read full this article<
Get Radiology Tree app to read full this article<
Get Radiology Tree app to read full this article<
References
1. Schueller-Weidekamm C., Schaefer-Prokop C.M., et. al.: CT angiography of pulmonary arteries to detect pulmonary embolism: improvement of vascular enhancement with low kilovoltage settings. Radiology 2006; 241: pp. 899-907.
2. Waaijer A., Prokop M., Velthuis B.K., et. al.: Circle of Willis at CT angiography: dose reduction and image quality—reducing tube voltage and increasing tube current settings. Radiology 2007; 242: pp. 832-839.
3. Heyer C.M., Mohr P.S., Lemburg S.P., Peters S.A., Nicolas V.: Image quality and radiation exposure at pulmonary CT angiography with 100- or 120-kVp protocol: prospective randomized study. Radiology 2007; 245: pp. 577-583.
4. Wintersperger B., Jakobs T., Herzog P., et. al.: Aorto-iliac multidetector-row CT angiography with low kV settings: improved vessel enhancement and simultaneous reduction of radiation dose. Eur Radiol 2005; 15: pp. 334-341.
5. Nakayama Y., Awai K., Funama Y., et. al.: Lower tube voltage reduces contrast material and radiation doses on 16-MDCT aortography. AJR Am J Roentgenol 2006; 187: pp. W490-W497.
6. Sahani D.V., Kalva S.P., Hahn P.F., Saini S.: 16-MDCT angiography in living kidney donors at various tube potentials: impact on image quality and radiation dose. AJR Am J Roentgenol 2007; 188: pp. 115-120.
7. Herzog C., Mulvihill D.M., Nguyen S.A., et. al.: Pediatric cardiovascular CT angiography: radiation dose reduction using automatic anatomic tube current modulation. AJR Am J Roentgenol 2008; 190: pp. 1232-1240.
8. Szucs-Farkas Z., Verdun F.R., von Allmen G., Mini R.L., Vock P.: Effect of X-ray tube parameters, iodine concentration, and patient size on image quality in pulmonary computed tomography angiography: a chest-phantom-study. Investigative radiology 2008; 43: pp. 374-381.
9. Rizzo S., Kalra M., Schmidt B., et. al.: Comparison of angular and combined automatic tube current modulation techniques with constant tube current CT of the abdomen and pelvis. AJR Am J Roentgenol 2006; 186: pp. 673-679.
10. International Commission on Radiological Protection (ICRP) : Recommendations of the International Commission on Radiological Protection. ICRP Publication 60. Oxford EP 1991;
11. Hurwitz L.M., Yoshizumi T.T., Goodman P.C., et. al.: Effective dose determination using an anthropomorphic phantom and metal oxide semiconductor field effect transistor technology for clinical adult body multidetector array computed tomography protocols. J Comput Assist Tomogr 2007; 31: pp. 544-549.
12. Schindera S.T., Nelson R.C., Toth T.L., et. al.: Effect of patient size on radiation dose for abdominal MDCT with automatic tube current modulation: phantom study. AJR Am J Roentgenol 2008; 190: pp. W100-W105.
13. Samei E., Dobbins J.T., Lo J.Y., Tornai M.P.: A framework for optimising the radiographic technique in digital X-ray imaging. Radiat Protect Dosim 2005; 114: pp. 220-229.
14. Huda W., Scalzetti E.M., Levin G.: Technique factors and image quality as functions of patient weight at abdominal CT. Radiology 2000; 217: pp. 430-435.
15. Kalva S.P., Sahani D.V., Hahn P.F., Saini S.: Using the K-edge to improve contrast conspicuity and to lower radiation dose with a 16-MDCT: a phantom and human study. J Comput Assist Tomogr 2006; 30: pp. 391-397.
16. Briguori C., Tavano D., Colombo A.: Contrast agent–associated nephrotoxicity. Progress in cardiovascular diseases 2003; 45: pp. 493-503.
17. Hipp A., Desai S., Lopez C., et. al.: The incidence of contrast-induced nephropathy in trauma patients. Eur J Emerg Med 2008; 15: pp. 134-139.
18. Holmquist F., Nyman U.: Eighty-peak kilovoltage 16-channel multidetector computed tomography and reduced contrast-medium doses tailored to body weight to diagnose pulmonary embolism in azotaemic patients. Eur Radiol 2006; 16: pp. 1165-1176.
19. Utsunomiya D., Awai K., Tamura Y., et. al.: 16-MDCT aortography with a low-dose contrast material protocol. AJR Am J Roentgenol 2006; 186: pp. 374-378.
20. Kubo S., Tadamura E., Yamamuro M., et. al.: Thoracoabdominal-aortoiliac MDCT angiography using reduced dose of contrast material. AJR Am J Roentgenol 2006; 187: pp. 548-554.