
Rationale and Objectives
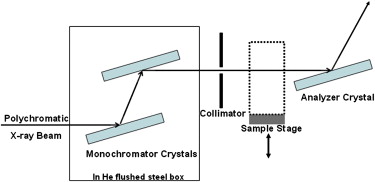
Conventional mammography can not distinguish between transmitted, scattered, or refracted x-rays, thus requiring breast compression to decrease tissue depth and separate overlapping structures. Diffraction-enhanced imaging (DEI) uses monochromatic x-rays and perfect crystal diffraction to generate images with contrast based on absorption, refraction, or scatter. Because DEI possesses inherently superior contrast mechanisms, the current study assesses the effect of breast compression on lesion characteristic visibility with DEI imaging of breast specimens.
Materials and Methods
Eleven breast tissue specimens, containing a total of 21 regions of interest, were imaged by DEI uncompressed, half-compressed, or fully compressed. A fully compressed DEI image was displayed on a soft-copy mammography review workstation, next to a DEI image acquired with reduced compression, maintaining all other imaging parameters. Five breast imaging radiologists scored image quality metrics considering known lesion pathology, ranking their findings on a 7-point Likert scale.
Results
When fully compressed DEI images were compared to those acquired with approximately a 25% difference in tissue thickness, there was no difference in scoring of lesion feature visibility. For fully compressed DEI images compared to those acquired with approximately a 50% difference in tissue thickness, across the five readers, there was a difference in scoring of lesion feature visibility. The scores for this difference in tissue thickness were significantly different at one rocking curve position and for benign lesion characterizations. These results should be verified in a larger study because when evaluating the radiologist scores overall, we detected a significant difference between the scores reported by the five radiologists.
Conclusions
Reducing the need for breast compression might increase patient comfort during mammography. Our results suggest that DEI may allow a reduction in compression without substantially compromising clinical image quality.
Breast cancer imparts distinct and measurable changes in breast tissue at the cellular level. Conventional mammography attempts to detect these changes by using absorption contrast based on the spatial distribution of x-ray attenuation. This contrast mechanism requires compression of the breast between radiolucent plates to decrease x-ray path length and separate overlapping breast structures, while creating more uniform thickness for even exposure levels throughout the breast. This technique effectively reduces scatter, decreases subject radiation dose and dramatically improves image quality. The American College of Radiology suggests a maximum compression force for mammography between 25 and 40 pounds . Many women report pain associated with breast compression, potentially contributing to noncompliance with annual screening mammography recommendations for women in the United States older than age 40 .
A recent study that used Monte Carlo simulations suggested that the typical level of breast compression for digital mammography (DM) could be decreased by approximately 10% with minimal impact on image quality . However, even with maximal breast compression, absorption contrast does not always provide sufficient contrast because of minimal differences in physical and electron density between normal and cancerous tissues. The microscopic and macroscopic alterations induced by cancer in breast tissue may cause x-ray refraction, minute changes in the direction of x-ray propagation. Phase contrast imaging techniques that acquire images based on x-ray refraction contrast may have applications in breast imaging .
Get Radiology Tree app to read full this article<
Get Radiology Tree app to read full this article<
Get Radiology Tree app to read full this article<
Materials and methods
Get Radiology Tree app to read full this article<
Specimen Selection
Get Radiology Tree app to read full this article<
Get Radiology Tree app to read full this article<
DEI
Get Radiology Tree app to read full this article<
Get Radiology Tree app to read full this article<
Get Radiology Tree app to read full this article<
Get Radiology Tree app to read full this article<
Get Radiology Tree app to read full this article<
Get Radiology Tree app to read full this article<
Full-field Digital Mammography
Get Radiology Tree app to read full this article<
Specimen Assessment
Get Radiology Tree app to read full this article<
Reader Study
Get Radiology Tree app to read full this article<
Get Radiology Tree app to read full this article<
Statistical Methods
Get Radiology Tree app to read full this article<
Get Radiology Tree app to read full this article<
Get Radiology Tree app to read full this article<
Get Radiology Tree app to read full this article<
Results
Get Radiology Tree app to read full this article<
Table 1
Measured Specimen Thicknesses and Percent Densities
Glandular (%) Adipose (%) Uncompressed Thickness (cm) Half- compressed Thickness (cm) Fully Compressed Thickness (cm) Specimen 1 10 90 3.9 2.9 2.0 Specimen 2 20 80 3.9 2.9 2.0 Specimen 3 30 70 3.9 2.9 2.0 Specimen 4 40 60 3.9 2.9 2.0 Specimen 5 90 10 6.7 6.1 3.4 Specimen 6 30 70 5.8 4.3 2.9 Specimen 7 50 50 5.1 3.8 2.5 Specimen 8 10 90 7.1 5.3 3.6 Specimen 9 40 60 6.5 4.9 4.0 Specimen 10 20 80 6.0 4.7 3.2 Specimen 11 30 70 8.0 6.7 5.5
Specimens were compressed an average of 24.7 ± 1.2 (%) of resting thickness at half-compression and 46.6 ± 4.6 (%) of resting thickness at full compression. The glandular/fatty composition of each specimen was assessed by an experienced radiologist.
Get Radiology Tree app to read full this article<
Get Radiology Tree app to read full this article<
Get Radiology Tree app to read full this article<
Get Radiology Tree app to read full this article<
![Figure 5, Trend in lesion perception as tissue thickness increases. The average scores reported by the radiologists were plotted as a function of the difference in tissue thickness, measured in cm. The score values could range from −3 (the fully compressed diffraction-enhanced imaging [DEI] image displays lesion feature visibility supportive of the diagnosis significantly worse than the DEI image acquired with reduced compression), to 0 (no difference between either image), to +3 (the fully compressed DEI image displays lesion feature visibility supportive of the diagnosis significantly better than the DEI image acquired with reduced compression). Linear trendlines, calculated individually for DEI absorption and DEI refraction, are shows as solid lines. Although the scores could have ranged from −3 to +3, when the scores were averaged for DEI refraction images and DEI absorption images for a specific difference in tissue thickness, these scores did not occupy the entire possible range. Moreover, the standard deviation led to some error bars that rose above the +3 maximum possible score.](https://storage.googleapis.com/dl.dentistrykey.com/clinical/EffectofBreastCompressiononLesionCharacteristicVisibilitywithDiffractionEnhancedImaging/4_1s20S1076633209005923.jpg)
Get Radiology Tree app to read full this article<
Get Radiology Tree app to read full this article<
Get Radiology Tree app to read full this article<
Table 2
Reader Study Results: Effect of Specimen Type
Difference in Tissue Thickness Mean Standard Error 95% CI_P_ Value Cadaveric 25% 0.3863 0.3357 (−0.273, 1.046) .2504 50% 0.9678 0.3357 (0.308, 1.627).0041 Mastectomy 25% 0.1019 0.2331 (−0.356, 0.560) .6623 50% 0.2212 0.2331 (−0.237, 0.679) .3430
The P values were calculated based on the calculated means, standard errors, and a 95% confidence interval (CI). Radiologist perception of lesion visibility for a 50% difference in tissue thickness in cadaveric specimens approached significance (bold).
Get Radiology Tree app to read full this article<
Get Radiology Tree app to read full this article<
Table 3
Reader Study Results: Effect of Rocking Curve Position
Difference in Tissue Thickness Mean Standard Error 95% CI_P_ Value −½W D 25% 0.2631 0.2002 (−0.130, 0.656) .1892 50% 0.7818 0.2002 (0.389, 1.175).0001 Peak 25% 0.1679 0.2002 (−0.225, 0.561) .4020 50% 0.5056 0.2002 (0.113, 0.899).0118 +½W D 25% 0.3012 0.2002 (−0.092, 0.694) .1329 50% 0.4961 0.2002 (0.103, 0.889).0135
The P values were calculated based on the calculated means, standard errors, and a 95% confidence interval (CI). For a 50% difference in tissue thickness, radiologist perception of lesion visibility was different for each rocking curve position, but we only found statistical significance at the −½ W D position (bold). The reported means and standard error values are estimates from the mixed effect model.
Get Radiology Tree app to read full this article<
Get Radiology Tree app to read full this article<
Table 4
Reader Study Results: Effect of Lesion Type
Difference in Tissue Thickness Mean Standard Error 95% CI_P_ Value Atypical 25% 0.3052 0.4643 (−0.607, 1.217) .5113 50% 0.5500 0.4643 (−0.362, 1.462) .2367 Benign 25% 0.3719 0.1454 (0.086, 0.657).0108 50% 0.6389 0.1454 (0.353, 0.925)<.0001 In situ 25% 0.3941 0.2932 (−0.182, 0.970) .1794 50% 0.7723 0.2932 (0.196, 1.348).0087 Malignant 25% −0.09481 0.2641 (−0.614, 0.424) .71975 50% 0.4167 0.2651 (−0.102, 0.935) .1152
The P values were calculated based on the calculated means, standard errors, and a 95% confidence interval (CI). Difference in the perception of benign lesion visibility approached significance for a 25% difference in tissue thickness, and achieved significance at a 50% difference in tissue thickness (bold). In situ lesion visibility also approached significance for a 50% difference in tissue thickness.
Get Radiology Tree app to read full this article<
Get Radiology Tree app to read full this article<
Discussion
Get Radiology Tree app to read full this article<
Get Radiology Tree app to read full this article<
Get Radiology Tree app to read full this article<
Get Radiology Tree app to read full this article<
Get Radiology Tree app to read full this article<
Get Radiology Tree app to read full this article<
Get Radiology Tree app to read full this article<
Get Radiology Tree app to read full this article<
Get Radiology Tree app to read full this article<
Acknowledgments
Get Radiology Tree app to read full this article<
References
1. Hendrick R.E., Bassett L., Botsco M.A., et. al.: Patient positioning and compression.ACR Committee on Quality Assurance in Mammography Mammography quality control manual.1999.American College of RadiologyReston, VA:
2. Keemers-Gels M.E., Groenendijk R.P., van den Heuvel J.H., et. al.: Pain experienced by women attending breast cancer screening. Breast Cancer Res Treat 2000; 60: pp. 235-240.
3. Poulos A., McLean D., Rickard M., et. al.: Breast compression in mammography: how much is enough?. Australas Radiol 2003; 47: pp. 121-126.
4. Sapir R., Patlas M., Strano S.D., et. al.: Does mammography hurt?. J Pain Symptom Manage 2003; 25: pp. 53-63.
5. Saunders R.S., Samei E.: The effect of breast compression on mass conspicuity in digital mammography. Med Phys 2008; 35: pp. 4464-4473.
6. Arfelli F., Assante M., Bonvicini V., et. al.: Low-dose phase contrast x-ray medical imaging. Phys Med Biol 1998; 43: pp. 2845-2852.
7. Briedis D., Siu K.K., Paganin D.M., et. al.: Analyzer-based mammography using single-image reconstruction. Phys Med Biol 2005; 50: pp. 3599-3611.
8. Lewis R.A.: Medical phase contrast x-ray imaging: current status and future prospects. Phys Med Biol 2004; 49: pp. 3573-3583.
9. Matsuo S., Katafushi T., Tohyama K., et. al.: Evaluation of edge effect due to phase contrast imaging for mammography. Med Phys 2005; 32: pp. 2690-2697.
10. Tanaka T., Honda C., Matsuo S., et. al.: The first trial of phase contrast imaging for digital full-field mammography using a practical molybdenum x-ray tube. Invest Radiol 2005; 40: pp. 385-396.
11. Pisano E.D., Johnson R.E., Chapman D., et. al.: Human breast cancer specimens: diffraction-enhanced imaging with histologic correlation-improved conspicuity of lesion detail compared to digital radiography. Radiology 2000; 214: pp. 895.
12. Chapman D., Thomlinson W., Arfelli F., et. al.: Mammography imaging studies using a Laue crystal analyzer. Rev Sci Instrum 1996; (CD suppl):57
13. Chapman D., Thomlinson W., Johnston R.E., et. al.: Diffraction-enhanced x-ray imaging. Phys Med Biol 1997; 42: pp. 2015-2025.
14. Chapman D., Pisano E., Thomlinson W., et. al.: Medical applications of diffraction-enhanced imaging. Breast Dis 1998; 10: pp. 197-207.
15. Hasnah M.O., Zhong Z., Oltulu O., et. al.: Diffraction-enhanced imaging contrast mechanisms in breast cancer specimens. Med Phys 2002; 29: pp. 2216.
16. Kiss M.Z., Sayers D.E., Zhong Z., et. al.: Improved image contrast of calcifications in breast tissue specimens using diffraction-enhanced imaging. Phys Med Biol 2004; 49: pp. 3427-3439.
17. Fernandez M., Keyriläinen J., Serimaa R., et. al.: Human breast cancer in vitro: matching histo-pathology with small-angle x-ray scattering and diffraction-enhanced x-ray imaging. Phys Med Biol 2005; 50: pp. 2991-3006.
18. Liu C., Yan X., Zhang X., et. al.: Evaluation of x-ray diffraction-enhanced imaging in the diagnosis of breast cancer. Phys Med Biol 2007; 52: pp. 419-427.
19. Arfelli F., Bonvicini V., Bravin A., et. al.: Mammography with synchrotron radiation: phase-detection techniques. Radiology 2000; 215: pp. 286-293.
20. Boone J.M.: Glandular breast dose for monoenergetic and high-energy x-ray beams: Monte Carlo assessment. Radiology 1999; 213: pp. 23-37.
21. Johnston E., Washburn D., Pisano E., et. al.: Mammographic phantom studies with synchrotron radiation. Radiology 1996; 200: pp. 659-663.
22. Kimme-Smith C.: New digital mammography systems may require different x-ray spectra and, therefore, more general normalized glandular dose values. Radiology 1999; 213: pp. 7-10.
23. Lawaczeck R., Arkadiev V., Diekmann F., et. al.: Monochromatic x-rays in digital mammography. Invest Radiol 2005; 40: pp. 33-39.
24. Gang L., Zhihua C., Ziyu W., et. al.: Image quality dependence on thickness of sliced rat kidney taken by a simplest DEI construction. Nucl Instrum Methods Phys Res A 2005; 548: pp. 200-206.
25. Zhong Z., Thomlinson W., Chapman D., et. al.: Implementation of diffraction-enhanced imaging experiments: at the NSLS and APS. Nucl Instrum Methods Phys Res A 2000; 450: pp. 556-567.
26. Kelemen L.E., Pankratz V.S., Sellers T.A., et. al.: Age-specific trends in mammographic density: the Minnesota Breast Cancer Family Study. Am J Epidemiol 2008; 167: pp. 1027-1036.
27. Dibble S.L., Israel J., Nussey B., et. al.: Mammography with breast cushions. Womens Health Issues 2005; 15: pp. 55-63.
28. Dullum J.R., Lewis E.C., Mayer J.A.: Rates and correlates of discomfort associated with mammography. Radiology 2000; 214: pp. 546-552.
29. Markle L., Roux S., Sayre J.W.: Reduction of discomfort during mammography utilizing a radiolucent cushioning pad. Breast J 2004; 10: pp. 345-349.
30. Miller D., Livingstone V., Herbison P.: Interventions for relieving the pain and discomfort of screening mammography. Cochrane Database Syst Rev 2008; 1: CD002942
31. Montgomery P., Conlon M.: Review: preprocedure information, breast cushions, and patient-controlled breast compression reduce mammography pain. Evid Based Nurs 2008; 11: pp. 111.
32. Parham C., Connor D.M., Pisano E.D., et. al.: Design and implementation of a compact low-dose diffraction-enhanced medical imaging system. Acad Radiol 2009; 16: pp. 911-917.
33. Faulconer L.S., Parham C.A., Connor D.M., et. al.: X-Ray tube-based diffraction-enhanced imaging: prototype images of full-thickness breast specimens with a radiologist reader study evaluation. Acad Radiol 2009; 16: pp. 1329-1337.