
Rationale and Objectives
To retrospectively investigate the effect of a computer-aided detection (CAD) system on radiologists’ performance for detecting small pulmonary nodules in computed tomography (CT) examinations, with a panel of expert radiologists serving as the reference standard.
Materials and Methods
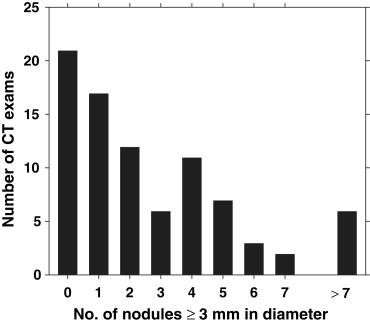
Institutional review board approval was obtained. Our dataset contained 52 CT examinations collected by the Lung Image Database Consortium, and 33 from our institution. All CTs were read by multiple expert thoracic radiologists to identify the reference standard for detection. Six other thoracic radiologists read the CT examinations first without and then with CAD. Performance was evaluated using free-response receiver operating characteristics (FROC) and the jackknife FROC analysis methods (JAFROC) for nodules above different diameter thresholds.
Results
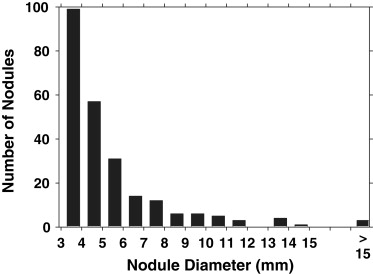
A total of 241 nodules, ranging in size from 3.0 to 18.6 mm (mean, 5.3 mm) were identified as the reference standard. At diameter thresholds of 3, 4, 5, and 6 mm, the CAD system had a sensitivity of 54%, 64%, 68%, and 76%, respectively, with an average of 5.6 false positives (FPs) per scan. Without CAD, the average figures of merit (FOMs) for the six radiologists, obtained from JAFROC analysis, were 0.661, 0.729, 0.793, and 0.838 for the same nodule diameter thresholds, respectively. With CAD, the corresponding average FOMs improved to 0.705, 0.763, 0.810, and 0.862, respectively. The improvement achieved statistical significance for nodules at the 3 and 4 mm thresholds ( P = .002 and .020, respectively), and did not achieve significance at 5 and 6 mm ( P = .18 and .13, respectively). At a nodule diameter threshold of 3 mm, the radiologists’ average sensitivity and FP rate were 0.56 and 0.67, respectively, without CAD, and 0.67 and 0.78 with CAD.
Conclusion
CAD improves thoracic radiologists’ performance for detecting pulmonary nodules smaller than 5 mm on CT examinations, which are often overlooked by visual inspection alone.
Although there is controversy over whether screening with computed tomography (CT) may reduce lung cancer mortality , there is little doubt that thin-slice multidetector row CT allows the detection of more lung nodules, often of smaller size, than both thicker section CT examinations and chest radiographic images . Multidetector row CT examinations of the thorax are now commonly reconstructed at 1–3 mm slice thickness and often with overlapping intervals , resulting in a large number of images to be interpreted. Fatigue caused by the increased workload of reviewing more images per examination, combined with pressures to be time-efficient, may result in false negatives (ie, missed lung nodules). Computer-aided detection (CAD) may help reduce false negatives at a lower cost than double reading by a second radiologist.
With increased interest in the detection and evaluation of lung nodules on CT examinations, a number of research groups have been investigating the development of CAD systems for pulmonary nodules , and the effect of CAD on radiologists’ performance . Several CAD systems have been approved to be used as a “second reader” for applications in mammography and lung imaging . In a second reader paradigm, the radiologist first interprets the image without CAD, and then reinterprets it after the CAD prompts are shown . If the radiologist does not discard his or her previous findings in the reinterpretation, the nodule detection sensitivity and the number of false positives (FPs) when reading with CAD will not be lower than that when reading without CAD. It is important to measure the potential increase in FPs with CAD that may adversely impact the clinical management, as well as the potential increase in sensitivity. Because many cases contain multiple nodules, it is also important to evaluate the effect of CAD on a per-nodule basis, as opposed to a per-scan-only basis. Finally, with the goal of detecting cancer at an earlier stage, it is important to analyze the effect of CAD based on nodule size. To address these issues, we designed a free-response receiver operating characteristic (FROC) experiment to compare the detection of lung nodules on CT examinations with and without CAD, and to analyze the dependence of the performance results on nodule size.
Materials and methods
Dataset
Get Radiology Tree app to read full this article<
Get Radiology Tree app to read full this article<
Get Radiology Tree app to read full this article<
Get Radiology Tree app to read full this article<
Table 1
The Manufacturer and Model of the Computed Tomography Scanners and the Reconstruction Filter Type for the 85 Examinations in our Dataset
Manufacturer/model Number of scans Filter type GE LightSpeed QX/I 17 Bone GE LightSpeed Ultra 1 Bone GE LightSpeed Ultra 35 Standard GE LightSpeed 16 5 Standard Philips Brilliance 16 3 D ∗ Siemens Emotion 6 4 B31s † Siemens Sensation 16 15 B30f ‡ Siemens Sensation 64 5 B30f
Get Radiology Tree app to read full this article<
Get Radiology Tree app to read full this article<
Get Radiology Tree app to read full this article<
Get Radiology Tree app to read full this article<
The Reference Standard
Get Radiology Tree app to read full this article<
First phase
Get Radiology Tree app to read full this article<
Get Radiology Tree app to read full this article<
Second phase
Get Radiology Tree app to read full this article<
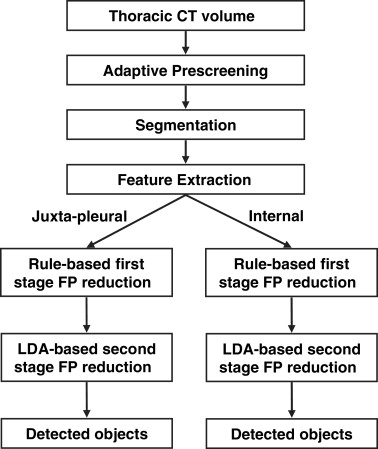
Computerized Nodule Detection System
Get Radiology Tree app to read full this article<
Get Radiology Tree app to read full this article<
Get Radiology Tree app to read full this article<
Get Radiology Tree app to read full this article<
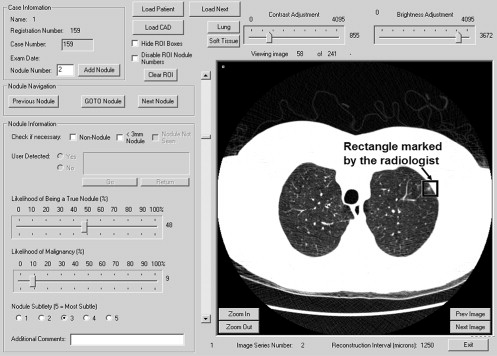
Observer Performance Study
Get Radiology Tree app to read full this article<
Get Radiology Tree app to read full this article<
Get Radiology Tree app to read full this article<
Get Radiology Tree app to read full this article<
Statistical Analysis
Get Radiology Tree app to read full this article<
Get Radiology Tree app to read full this article<
Get Radiology Tree app to read full this article<
Results
Get Radiology Tree app to read full this article<
Get Radiology Tree app to read full this article<
Get Radiology Tree app to read full this article<
Table 2
Computer Detection Sensitivities for Nodule Diameter Thresholds of 3, 4, 5, and 6mm and the FP Rate
Average sensitivity at nodule diameter threshold FP rate (average no. of FPs per scan) 3 mm 4 mm 5 mm 6 mm 5.6 54% 64% 68% 76%
FP, false positive.
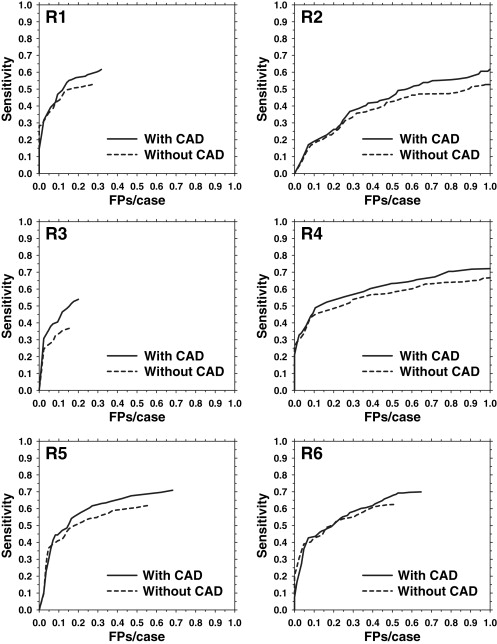
Table 3
The FOM by JAFROC Analysis in the Without- and With-CAD Modes at a Nodule Diameter Threshold of D = 3mm
Radiologist FOM without-CAD FOM with-CAD Increase with CAD R1 0.697 0.736 0.039 R2 0.538 0.587 0.049 R3 0.628 0.713 0.085 R4 0.690 0.72 0.030 R5 0.706 0.741 0.035 R6 0.708 0.731 0.023 Average 0.661 (0.622–0.698) 0.705 (0.664–0.743) 0.044
FOM, figure of merit; CAD, computed-aided diagnosis.
Numbers in parentheses indicate the 95% confidence interval.
Get Radiology Tree app to read full this article<
Get Radiology Tree app to read full this article<
Table 4
Average FOM by JAFROC Analysis of the Six Study Radiologists for Nodule Diameter Thresholds of 3, 4, 5, and 6mm
Nodule diameter threshold (mm) Average FOM without-CAD (95% confidence interval) Average FOM with-CAD (95% confidence interval) Increase with CAD_P_ value 3 0.661 (0.662–0.698) 0.705 (0.664–0.743) 0.044 .002 4 0.729 (0.685–0.770) 0.763 (0.717–0.805) 0.034 .020 5 0.793 (0.743–0.836) 0.810 (0.759–0.853) 0.017 .18 6 0.838 (0.782–0.884) 0.862 (0.808–0.905) 0.024 .13
FOM, figure of merit; JAFROC, jackknife free-response receiver operating characteristic; CAD, computer-aided diagnosis.
Get Radiology Tree app to read full this article<
Get Radiology Tree app to read full this article<
Table 5
Average FP Rate and Sensitivity of the Six Study Radiologists for Nodule Diameter Thresholds of 3, 4, 5, and 6mm
Average sensitivity at nodule diameter threshold FP rate (average no. of FPs per scan) 3mm 4mm 5mm 6mm Without-CAD 0.667 (0.153-1.259) 0.559 (0.369-0.676) 0.670 (0.507–0.782) 0.773 (0.635–0.847) 0.836 (0.741–0.889) With-CAD 0.778 (0.200-1.412) 0.665 (0.544-0.755) 0.758 (0.662–0.838) 0.825 (0.753–0.894) 0.901 (0.815–0.963) % increase with CAD 16.8% 18.9% 13.1% 6.9% 7.7%P value .003 .001 .003 .023 .019
FP, false positive; CAD, computer-aided diagnosis.
A likelihood of nodule (LN) threshold of 0 was used to determine which marking corresponded to a true positive, FP, or of no consequence. Numbers in parentheses indicate the range. The statistical significances of the differences in sensitivities and FP rates between the without- and with-CAD modes were estimated with the Student’s paired t -test for the six radiologists.
Get Radiology Tree app to read full this article<
Get Radiology Tree app to read full this article<
Get Radiology Tree app to read full this article<
Get Radiology Tree app to read full this article<
Get Radiology Tree app to read full this article<
Discussion
Get Radiology Tree app to read full this article<
Get Radiology Tree app to read full this article<
Get Radiology Tree app to read full this article<
Get Radiology Tree app to read full this article<
Get Radiology Tree app to read full this article<
Get Radiology Tree app to read full this article<
Get Radiology Tree app to read full this article<
Get Radiology Tree app to read full this article<
Get Radiology Tree app to read full this article<
Get Radiology Tree app to read full this article<
Get Radiology Tree app to read full this article<
Get Radiology Tree app to read full this article<
Get Radiology Tree app to read full this article<
References
1. Henschke C.I., Yankelevitz D.F., Libby D.M., et. al.: Survival of patients with stage I lung cancer detected on CT screening. N Engl J Med 2006; 355: pp. 1763-1771.
2. Bach P.B., Jett J.R., Pastorino U., et. al.: Computed tomography screening and lung cancer outcomes. JAMA 2007; 297: pp. 953-961.
3. Buckley J.A., Scott W.W., Siegelman S.S., et. al.: Pulmonary nodules: effect of increased data sampling on detection with spiral CT and confidence in diagnosis. Radiology 1995; 196: pp. 395-400.
4. Ko J.P., Naidich D.P.: Lung nodule detection and characterization with multislice CT. Radiol Clin North Am 2003; 41: pp. 575-597.
5. Sone S., Yang Z.G., Takashima S., et. al.: Characteristics of small lung cancers invisible on conventional chest radiography and detected by population based screening using spiral CT. Br J Radiol 2000; 73: pp. 137-145.
6. Fischbach F., Knollmann F., Griesshaber V., Freund T., Akkol E., Felix R.: Detection of pulmonary nodules by multislice computed tomography: improved detection rate with reduced slice thickness. Eur Radiol 2003; 13: pp. 2378-2383.
7. Cagnon C.H., Cody D.D., McNitt-Gray M.F., et. al.: Description and implementation of a quality control program in an imaging-based clinical trial. Acad Radiol 2006; 13: pp. 1431-1441.
8. Xu D.M., van Klaveren R.J., de Bock G.H., et. al.: Limited value of shape, margin and CT density in the discrimination between benign and malignant screen detected solid pulmonary nodules of the NELSON trial. Eur J Radiol 2008; 68: pp. 347-352.
9. Veronesi G., Bellomi M., Mulshine J.L., et. al.: Lung cancer screening with low-dose computed tomography: a non-invasive diagnostic protocol for baseline lung nodules. Lung Cancer 2008; 61: pp. 340-349.
10. Reeves A.P., Kostis W.J.: Computer-aided diagnosis for lung cancer. Radiol Clin North Am 2000; 38: pp. 497-509.
11. Gurcan M.N., Sahiner B., Petrick N., et. al.: Lung nodule detection on thoracic computed tomography images: preliminary evaluation of a computer-aided diagnosis system. Med Phys 2002; 29: pp. 2552-2558.
12. Wormanns D., Fiebich M., Saidi M., Diederich S., Heindel W.: Automatic detection of pulmonary nodules at spiral CT: clinical application of a computer-aided diagnosis system. Eur Radiol 2002; 12: pp. 1052-1057.
13. Brown M.S., Goldin J.G., Suh R.D., et. al.: Lung micronodules: automated method for detection at thin-section CT - initial experience. Radiology 2003; 226: pp. 256-262.
14. Suzuki K., Armato S.G., Li F., et. al.: Massive training artificial neural network (MTANN) for reduction of false positives in computerized detection of lung nodules in low-dose computed tomography. Med Phys 2003; 30: pp. 1602-1617.
15. Armato S.G., Roy A.S., MacMahon H., et. al.: Evaluation of automated lung nodule detection on low-dose computed tomography scans from a lung cancer screening program. Acad Radiol 2005; 12: pp. 337-346.
16. Bae K.T., Kim J.-S., Na Y.-H., et. al.: Pulmonary nodules: automated detection on CT images with morphologic matching algorithm—preliminary results. Radiology 2005; 236: pp. 286-293.
17. Lee J.W., Goo J.M., Lee H.J., et. al.: The potential contribution of a computer-aided detection system for lung nodule detection in multidetector row computed tomography. Investig Radiol 2004; 39: pp. 649-655.
18. Yuan R., Vos P.M., Cooperberg P.L.: Computer-aided detection in screening CT for pulmonary nodules. AJR Am J Roentgenol 2006; 186: pp. 1280-1287.
19. Rubin G.D., Lyo J.K., Paik D.S., et. al.: Pulmonary nodules on multi-detector row CT scans: performance comparison of radiologists and computer-aided detection. Radiology 2005; 234: pp. 274-283.
20. Awai K., Murao K., Ozawa A., et. al.: Pulmonary nodules at chest CT: effect of computer-aided diagnosis on radiologists’ detection performance. Radiology 2004; 230: pp. 347-352.
21. Li F., Arimura H., Suzuki K., et. al.: Computer-aided detection of peripheral lung cancers missed at CT: ROC analyses without and with localization. Radiology 2005; 237: pp. 684-690.
22. Brown M.S., Goldin J.G., Rogers S., et. al.: Computer-aided lung nodule detection in CT results of large-scale observer test. Acad Radiol 2005; 12: pp. 681-686.
23. Das M., Muhlenbruch G., Mahnken A.H., et. al.: Small pulmonary nodules: effect of two computer-aided detection systems on radiologist performance. Radiology 2006; 241: pp. 564-571.
24. Bazzocchi M., Mazzarella F., Del Frate C., et. al.: CAD systems for mammography: a real opportunity? A review of the literature. Radiol Med 2007; 112: pp. 329-353.
25. Chan H.P., Hadjiiski L.M., Zhou C., et. al.: Computer-aided diagnosis of lung cancer and pulmonary embolism in computed tomography—a review. Acad Radiol 2008; 15: pp. 535-555.
26. Taylor S.A., Charman S.C., Lefere P., et. al.: CT colonography: investigation of the optimum reader paradigm by using computer-aided detection software. Radiology 2008; 246: pp. 463-471.
27. Armato S.G., McLennan G., McNitt-Gray M.F., et. al.: Lung Image Database Consortium: developing a resource for the medical imaging research community. Radiology 2004; 232: pp. 739-748.
28. Henschke C.I., McCauley D.I., Yankelevitz D.F., et. al.: Early lung cancer action project: overall design and findings from baseline screening. Lancet 1999; 354: pp. 99-105.
29. Swensen S.J., Jett J.R., Hartman T.E., et. al.: Lung cancer screening with CT: Mayo Clinic experience. Radiology 2003; 226: pp. 756-761.
30. Diederich S., Wormanns D., Semik M., et. al.: Screening for early lung cancer with low-dose spiral CT: prevalence in 817 asymptomatic smokers. Radiology 2002; 222: pp. 773-781.
31. McNitt-Gray M.F., Armato S.G., Meyer C.R., et. al.: The Lung Image Database Consortium (LIDC) data collection process for nodule detection and annotation. Acad Radiol 2007; 14: pp. 1464-1474.
32. Sahiner B., Hadjiiski L.M., Chan H.P., et. al.: Computerized lung nodule detection on screening CT scans: performance on juxta-pleural and internal nodules. Proc SPIE 2006; 6144: 5S1–5S6
33. Way T.W., Hadjiiski L.M., Sahiner B., et. al.: Computer-aided diagnosis of pulmonary nodules on CT scans: segmentation and classification using 3D active contours. Med Phys 2006; 33: pp. 2323-2337.
34. Ge Z., Sahiner B., Chan H.P., et. al.: Computer aided detection of lung nodules: false positive reduction using a 3D gradient field method and 3D ellipsoid fitting. Med Phys 2005; 32: pp. 2443-2454.
35. Sahiner B., Hadjiiski L.M., Chan H.P., et. al.: The effect of nodule segmentation on the accuracy of computerized lung nodule detection on CT scans: comparison on a dataset annotated by multiple radiologists. Proc SPIE 2007; 6514: 65140L–65141, 65147
36. Bunch P.C., Hamilton J.F., Sanderson G.K., Simmons A.H.: A free response approach to the measurement and characterization of radiographic observer performance. J Appl Photo Engr 1978; 4: pp. 166-171.
37. Chakraborty D.P.: Validation and statistical power comparison of methods for analyzing free-response observer performance studies. Acad Radiol 2008; 15: pp. 1554-1566.
38. Chakraborty D.P., Winter L.H.L.: Free-response methodology: alternate analysis and a new observer-performance experiment. Radiology 1990; 174: pp. 873-881.
39. Chakraborty D.P., Berbaum K.S.: Observer studies involving detection and localization: modeling, analysis, and validation. Med Phys 2004; 31: pp. 2313-2330.
40. Nishikawa R.M., Kallergi M., Orton C.G.: Computer-aided detection, in its present form, is not an effective aid for screening mammography. Med Phys 2006; 33: pp. 811-814.
41. Karssemeijer N., Otten J.D., Rijken H., et. al.: Computer aided detection of masses in mammograms as decision support. Br J Radiol 2006; 79: pp. S123-S126.
42. Zheng B., Swensson R.G., Golla S., et. al.: Detection and classification performance levels of mammographic masses under different computer-aided detection cueing environments. Acad Radiol 2004; 11: pp. 398-406.
43. Manning D.J., Ethell S.C., Donovan T.: Detection or decision errors? Missed lung cancer from the posteroanterior chest radiograph. Br J Radiol 2004; 77: pp. 231-235.
44. Karssemeijer N., Hupse A., Samulski M., et. al.: An interactive computer aided decision support system for detection of masses in mammograms.Krupinski E.A.9th International Workshop on Digital Mammography.2008.Springer-VerlagTucson, AZ Berlin:pp. 273-278.
45. Ochs R., Angel E., Boedeker K., et. al.: The influence of CT dose and reconstruction parameters on automated detection of small pulmonary nodules. Proc SPIE 2006; 6144: 5W1–5W8
46. Boedeker K.L., McNitt-Gray M.F.: Tradeoffs in noise, resolution, and dose with reconstruction filter in lung nodule detection in CT. Proc SPIE 2005; 5745: pp. 695-703.
47. MacMahon H., Austin J.H.M., Gamsu G., et. al.: Guidelines for management of small pulmonary nodules detected on CT scans: a statement from the Fleischner Society. Radiology 2005; 237: pp. 395-400.
48. Marten K., Engelke C., Seyfarth T., et. al.: Computer-aided detection of pulmonary nodules: influence of nodule characteristics on detection performance. Clin Radiol 2005; 60: pp. 196-206.
49. Revesz G., Kundel H.L., Bonitatibus M.: The effect of verification on the assessment of imaging techniques. Investig Radiol 1983; 18: pp. 194-198.