
Rationale and Objectives
The aim of this study was to compare precontrast and postcontrast renal diffusion-weighted images for signal intensity (SI), apparent diffusion coefficient (ADC), and lesion conspicuity.
Materials and Methods
In 62 patients (mean age, 54 ± 29; 29 men, 33 women) precontrast and postcontrast (0.1 mmol/kg of extracellular gadolinium-based contrast medium; mean, 3.3 ± 0.9 minutes], diffusion-weighted images at b values of 50 and 400 s/mm 2 were compared (3 T). The SI, signal-to-noise ratio, and ADC of the renal cortex, medulla, and lesions were measured. Lesion contrast-to-noise ratios (against the medulla and cortex) were calculated.
Results
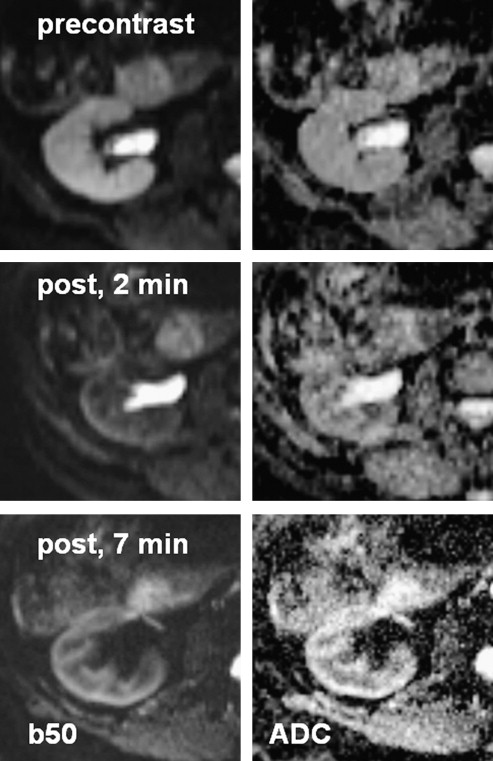
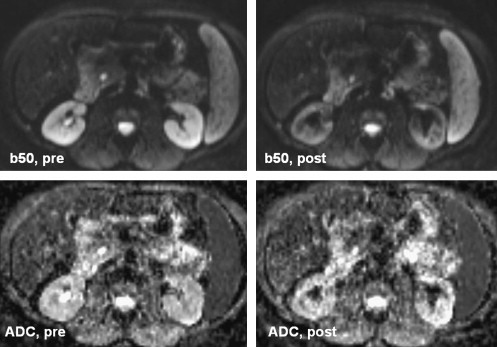
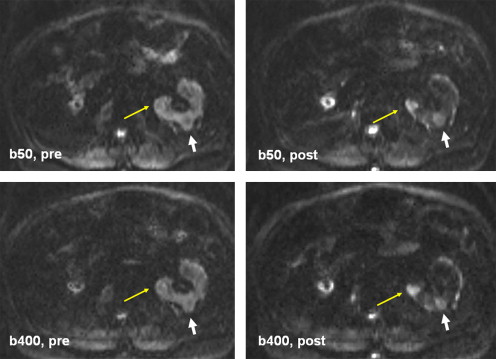
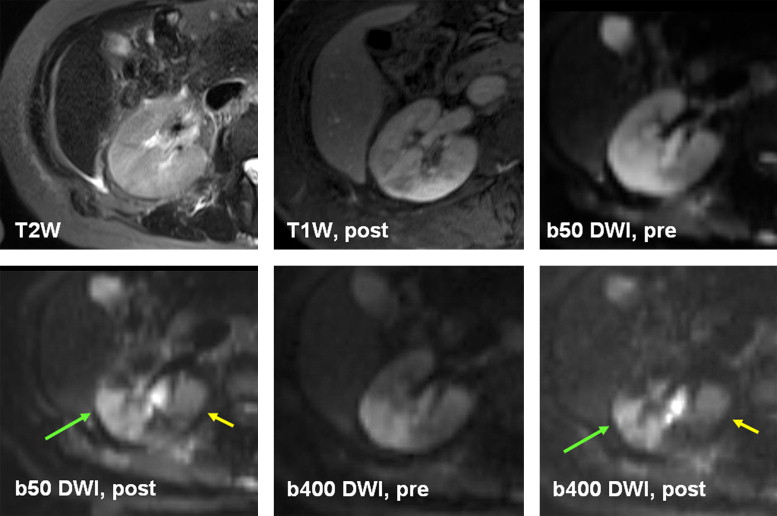
Postcontrast medullary SI decreased by 50% and cortical SI decreased by 33% and 39% on images at b = 50 s/mm 2 and b = 400 s/mm 2 , respectively ( P < .0001). The SI and signal-to-noise ratio of lesions did not change significantly after contrast, but lesion-medullary contrast-to-noise ratio was increased by 50% at both b = 50 s/mm 2 and b = 400 s/mm 2 ( P < .005 and P = .0005, respectively) following contrast. Qualitative postcontrast lesion conspicuity was improved, with average scores of 2.8 ± 0.9 for all lesions (κ = 0.7 ± 0.08) and 3.2 ± 0.9 for solid lesions (κ = 0.82 ± 0.1). The ADC of renal cortex decreased ( P = .03), but the ADC of renal medulla or renal lesions did not significantly change.
Conclusion
Postcontrast diffusion-weighted imaging causes a significant decrease in renal parenchymal signal without a significant change in lesion signal, resulting in increased lesion conspicuity.
Recent technical innovations have expanded the application of diffusion-weighted imaging (DWI) in the field of abdominal imaging. These innovations include echo-planar imaging, parallel imaging, high-performance gradients, phased-array multichannel surface coils, and higher magnetic field strengths . Promising results have been obtained using DWI in the abdomen and pelvis, particularly for assessment of the liver, kidneys, and pelvic structures .
To date, DWI has been performed before intravenous extracellular gadolinium-based contrast medium (E-GdCM) administration . However, the images are not uncommonly degraded because of various technical limitations and thus need to be repeated at the end the study, by which time contrast material has already been administered. The effect of E-GdCM on image quality and apparent diffusion coefficient (ADC) values has been studied for the brain and liver, with no significant difference detected before and after the administration of contrast on DWI . In the assessment of the liver, one study concluded that contrast administration in diagnostic doses did not limit the utility of DWI . However, the accumulation of a larger amount of E-GdCM in tissues such as the kidneys may change the signal intensity (SI) of tissue in DWI sequences. This change in SI is mostly attributed to T2∗ shortening and susceptibility effects . The fact that the kidney excretes E-GdCM causes the organ’s signal characteristics to be influenced differently compared to the other soft tissues, such as on postcontrast diffusion-weighted images. In fact, it has been shown that renal excretion of E-GdCM will result in signal loss in the normal renal parenchyma on postcontrast diffusion-weighted images .
Get Radiology Tree app to read full this article<
Materials and methods
Patients
Get Radiology Tree app to read full this article<
Get Radiology Tree app to read full this article<
Imaging Technique
Get Radiology Tree app to read full this article<
Get Radiology Tree app to read full this article<
Get Radiology Tree app to read full this article<
Get Radiology Tree app to read full this article<
Get Radiology Tree app to read full this article<
Image Analysis
Get Radiology Tree app to read full this article<
Get Radiology Tree app to read full this article<
Get Radiology Tree app to read full this article<
Get Radiology Tree app to read full this article<
Get Radiology Tree app to read full this article<
Get Radiology Tree app to read full this article<
Get Radiology Tree app to read full this article<
Statistical Analysis
Get Radiology Tree app to read full this article<
Results
General Observations
Get Radiology Tree app to read full this article<
Get Radiology Tree app to read full this article<
Get Radiology Tree app to read full this article<
SI and SNR
Get Radiology Tree app to read full this article<
Table 1
SI of Kidney (Cortex and Medulla), Renal Lesions, Liver, and Spleen on Diffusion-weighted Images at b = 50 s/mm 2 and b = 400 s/mm 2 Before and After Contrast Administration
SI at b = 50 s/mm 2 SI at b = 400 s/mm 2 Location Precontrast ∗ Postcontrast ∗ Difference Score † P Precontrast ∗ Postcontrast ∗ Difference Score † P ‡ Renal cortex 191 ± 62 128 ± 54 −63 ± 7 (−76 to −48) <.0001 87 ± 26 53 ± 22 −34 ± 3.3 (−40 to −27) <.0001 Renal medulla 146 ± 53 75 ± 43 −70 ± 6.6 (−83 to −56) <.0001 66 ± 21 33 ± 21 −33 ± 2.9 (−38 to −26) <.0001 Renal lesion (all) 240 ± 111 233 ± 115 −6.4 ± 12 (−31 to 18) 0.60 (NS) 96 ± 37 84 ± 39 −11 ± 4 (−19 to −3) .008 Solid renal lesion 165 ± 60 153 ± 45 −12 ± 19 (−56 to 32) 0.54 (NS) 91 ± 29 81 ± 28 −9.5 ± 12 (−36 to 17) .40 (NS) Liver 43 ± 21 42 ± 22 −1.2 ± 1.8 (−4.6 to 2.2) 0.50 (NS) 26 ± 18 21 ± 12 −4 ± 1.5 (−7.7 to −0.4) .03 Spleen 119 ± 61 138 ± 64 19.4 ± 4.3 (11 to 28) <.0001 92 ± 85 100 ± 79 8.8 ± 3 (2.7 to 15) .005
SI, signal intensity.
Get Radiology Tree app to read full this article<
Get Radiology Tree app to read full this article<
Get Radiology Tree app to read full this article<
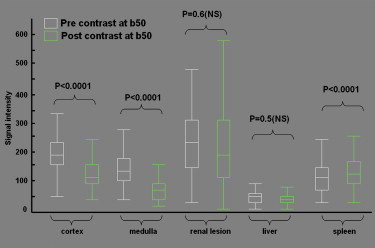
Table 2
SNR of the Kidney (Cortex and Medulla), Renal Lesions, Liver, and Spleen on Diffusion-weighted Images at b = 50 s/mm 2 and b = 400 s/mm 2 Before and After Contrast Administration
SNR at b = 50 s/mm 2 SNR at b = 400 s/mm 2 Location Precontrast ∗ Postcontrast ∗ Difference Score † P Precontrast ∗ Postcontrast ∗ Difference Score † P ‡ Renal cortex 24 ± 13 15.5 ± 8.5 −8.3 ± 1.1 (−10 to −6) <.0001 21.6 ± 10 5.2 ± 3.4 −16 ± 1.2 (−18 to −14) <.0001 Renal medulla 18 ± 11 9.4 ± 6.6 −8.8 ± 1.1 (−11 to −6.6) <.0001 16 ± 7.6 8 ± 5.7 −8 ± 1 (−10 to −6) <.0001 Renal lesion 31 ± 19 30 ± 18 −1 ± 2 (−5.6 to 3.5) .65 (NS) 22 ± 11 21 ± 14 −1 ± 1.3 (−4 to 1.4) .36 (NS) Solid renal lesion 26 ± 14 25 ± 13 −1.4 ± 3 (−9 to 6.3) .67 (NS) 15 ± 3.9 14 ± 7.4 −1 ± 3 (−7 to 5.5) .74 (NS) Liver 5.3 ± 3.7 5.3 ± 4 −0.02 ± 0.3 (−0.6 to 0.6) .90 (NS) 6.2 ± 4 5.2 ± 3.4 −0.9 ± 0.4 (−1.8 to −0.1) .02 Spleen 15 ± 10 18 ± 14 3.2 ± 1.2 (0.7 to 5.6) .01 23.5 ± 28 25.4 ± 27 1.8 ± 1.3 (−0.7 to 4.4) .15 (NS)
SNR, signal-to-noise ratio.
Get Radiology Tree app to read full this article<
Get Radiology Tree app to read full this article<
Get Radiology Tree app to read full this article<
Get Radiology Tree app to read full this article<
Get Radiology Tree app to read full this article<
Get Radiology Tree app to read full this article<
Get Radiology Tree app to read full this article<
Get Radiology Tree app to read full this article<
Get Radiology Tree app to read full this article<
Get Radiology Tree app to read full this article<
Lesion Conspicuity
Get Radiology Tree app to read full this article<
Get Radiology Tree app to read full this article<
Table 3
CNR of Renal Lesions (Overall and for Solid Lesions Only) Relative to Cortex and Medulla on Diffusion-weighted Images at b = 50 s/mm 2 and b = 400 s/mm 2 Before and After Contrast Administration
CNR at b = 50 s/mm 2 CNR at b = 400 s/mm 2 Precontrast ∗ Postcontrast ∗ Difference Score † P Precontrast ∗ Postcontrast ∗ Difference Score † P ‡ Lesion-medulla 12 ± 15 18 ± 17 6.5 ± 2 (2 to 11) <.005 8 ± 7.4 12.5 ± 12 4.5 ± 1 (2 to 7) .0005 Lesion-cortex 6 ± 17 13 ± 17 6.8 ± 2 (2.4 to 11) <.003 2.5 ± 9 7.5 ± 12 5 ± 1.4 (2.2 to 8) .0008 Solid lesion-medulla 3.8 ± 6.4 11 ± 8.7 7.3 ± 3 (0.4 to 14) .04 4.6 ± 2.8 8.3 ± 5 3.7 ± 1.7 (−0.1 to 7.6) .05 Solid lesion-cortex 0.6 ± 7 7 ± 9 6 ± 2.4 (0.4 to 12) .03 2.4 ± 3.5 5.2 ± 5 2.9 ± 1.6 (−0.8 to 6.5) .11
CNR, contrast-to-noise ratio.
Get Radiology Tree app to read full this article<
Get Radiology Tree app to read full this article<
Get Radiology Tree app to read full this article<
Get Radiology Tree app to read full this article<
ADC Results
Get Radiology Tree app to read full this article<
Table 4
ADCs (×10 −3 mm 3 /s) of the Kidney (Cortex and Medulla), Renal Lesions, Liver, and Spleen in ADC Images Before and After Contrast Administration
Location Precontrast ∗ Postcontrast ∗ Difference Score † P ‡ Renal cortex 1.853 ± 0.26 1.760 ± 0.25 −0.093 ± 0.04 (−0.17 to −0.07) .03 Renal medulla 1.627 ± 0.25 1.506 ± 1.12 −0.121 ± 0.14 (−0.4 to 0.14) .40 Renal lesion (all) 2.205 ± 0.6 2.090 ± 0.62 −0.115 ± 0.08 (−0.3 to 0.045) .17 Solid renal lesions 1.45 ± 0.4 1.48 ± 0.4 −0.035 ± 0.01 (−0.2 to 0.3) .70 Liver 0.919 ± 0.57 0.755 ± 0.32 −0.164 ± 0.06 (−0.2 to −0.05) .007 Spleen 0.711 ± 0.26 0.705 ± 0.21 −0.006 ± 0.07 (−0.08 to 0.07) .85
ADC, apparent diffusion coefficient.
Get Radiology Tree app to read full this article<
Get Radiology Tree app to read full this article<
Get Radiology Tree app to read full this article<
Get Radiology Tree app to read full this article<
Discussion
Get Radiology Tree app to read full this article<
Get Radiology Tree app to read full this article<
Get Radiology Tree app to read full this article<
Get Radiology Tree app to read full this article<
Get Radiology Tree app to read full this article<
Limitations
Get Radiology Tree app to read full this article<
Conclusions
Get Radiology Tree app to read full this article<
References
1. Müller M.F., Prasad P., Siewert B., et. al.: Abdominal diffusion mapping with use of a whole-body echo-planar system. Radiology 1994; 190: pp. 475-478.
2. Namimoto T., Yamashita Y., Sumi S., et. al.: Focal liver masses: characterization with diffusion-weighted echo planar MR imaging. Radiology 1997; 204: pp. 739-744.
3. Yamashita Y., Tang Y., Takahashi M.: Ultrafast MR imaging of the abdomen: echo planar imaging and diffusion-weighted imaging. J Magn Reson Imaging 1998; 8: pp. 367-374.
4. Chow L.C., Bammer R., Moseley M.E., et. al.: Single breath-hold diffusion-weighted imaging of the abdomen. J Magn Reson Imaging 2003; 18: pp. 377-382.
5. Yoshikawa T., Kawamitsu H., Mitchell D.G., et. al.: ADC measurement of abdominal organs and lesions using parallel imaging technique. AJR Am J Roentgenol 2006; 187: pp. 1521-1530.
6. Naganawa S., Kawai H., Fukatsu H., et. al.: Diffusion-weighted imaging of the liver: technical challenges and prospects for the future. Magn Reson Med Sci 2005; 4: pp. 175-186.
7. Sandrasegaran K., Sundaram C.P., Ramaswamy R., et. al.: Usefulness of diffusion-weighted imaging in the evaluation of renal masses. AJR Am J Roentgenol 2010; 194: pp. 438-445.
8. Squillaci E., Manenti G., Di Stefano F., et. al.: Diffusion-weighted MR imaging in the evaluation of renal tumours. J Exp Clin Cancer Res 2004; 23: pp. 39-45.
9. Thoeny H.C., De Keyzer F., Oyen R.H., et. al.: Diffusion weighted MR imaging of kidneys in healthy volunteers and patients with parenchymal diseases: initial experience. Radiology 2005; 235: pp. 911-917.
10. Kilickesmez O., Inci E., Atilla S., et. al.: Diffusion-weighted imaging of the renal and adrenal lesions. J Comput Assist Tomogr 2009; 33: pp. 828-833.
11. Ichikawa T., Haradome H., Hachiya J., et. al.: Diffusion-weighted MR imaging with single-shot echo-planar imaging in the upper abdomen: preliminary clinical experience in 61 patients. Abdom Imaging 1999; 24: pp. 456-461.
12. Zhang J., Tehrani Y.M., Wang L., et. al.: Renal masses: characterization with diffusion-weighted MR imaging—a preliminary experience. Radiology 2008; 247: pp. 458-464.
13. Taouli B., Thakur R.K., Mannelli L., et. al.: Renal lesions: characterization with diffusion-weighted imaging versus contrast-enhanced MR imaging. Radiology 2009; 251: pp. 398-407.
14. Yamada K., Kubota H., Kizu O., et. al.: Effect of intravenous gadolinium-DTPA on diffusion-weighted images: evaluation of normal brain and infarcts. Stroke 2002; 33: pp. 1799-1802.
15. Chiu F.Y., Jao J.C., Chen C.Y., et. al.: Effect of intravenous gadolinium-DTPA on diffusion-weighted magnetic resonance images for evaluation of focal hepatic lesions. J Comput Assist Tomogr 2005; 29: pp. 176-180.
16. Ogura A., Hayakawa K., Miyati T., et. al.: The effect of susceptibility of gadolinium contrast media on diffusion-weighted imaging and the apparent diffusion coefficient. Acad Radiol 2008; 15: pp. 867-872.
17. Gulani V., Willatt J.M., Blaimer M., et. al.: Effect of contrast media on single-shot echo planar imaging: implications for abdominal diffusion imaging. J Magn Reson Imaging 2009; 30: pp. 1203-1208.
18. Kanal E., Barkovich A.J., Bell C., et. al.: ACR Blue Ribbon Panel on MR Safety. ACR guidance document for safe MR practices: 2007. AJR Am J Roentgenol 2007; 188: pp. 1447-1474.
19. Teh H.S., Ang E.S., Wong W.C., et. al.: MR renography using a dynamic gradient-echo sequence and low-dose gadopentetate dimeglumine as an alternative to radionuclide renography. AJR Am J Roentgenol 2003; 181: pp. 441-450.
20. Barnhart J.L., Kuhnert N., Douglas B.A., et. al.: Biodistribution of GdCI3 and Gd-DTPA and their influence on proton magnetic relaxation in rat tissues. Magn Reson Imaging 1987; 5: pp. 221-231.
21. Choyke P.L., Frank J.A., Girton M.E., et. al.: Dynamic Gd-DTPA–enhanced MR imaging of the kidney: experimental results. Radiology 1989; 170: pp. 713-720.
22. Landis J.R., Koch G.G.: The measurement of observer agreement for categorical data. Biometrics 1977; 33: pp. 159-174.
23. Katzberg R.W., Buonocore M.H., Ivanovic M., et. al.: Functional, dynamic, and anatomic MR urography: feasibility and preliminary findings. Acad Radiol 2001; 8: pp. 1083-1099.
24. Caravan P., Ellison J.J., McMurry T.J., et. al.: Gadolinium (III) chelates as MRI contrast agents: structure, dynamics, and applications. Chem Rev 1999; 99: pp. 2293-2352.
25. Elster A.D.: Gradient-echo MR imaging: techniques and acronyms. Radiology 1993; 186: pp. 1-8.
26. Manka C., Träber F., Gieseke J., et. al.: Three-dimensional dynamic susceptibility-weighted perfusion MR imaging at 3.0 T: feasibility and contrast agent dose. Radiology 2005; 234: pp. 869-877.
27. Le Bihan D., Poupon C., Amadon A., et. al.: Artifacts and pitfalls in diffusion MRI. J Magn Reson Imaging 2006; 24: pp. 478-488.
28. Clayton D.B., Albers G.W., Nagle S., et. al.: Clinical multishot DW-EPI through parallel imaging with considerations of susceptibility, motion, and noise. Magn Reson Med 2007; 57: pp. 881-890.