
Rationale and Objectives
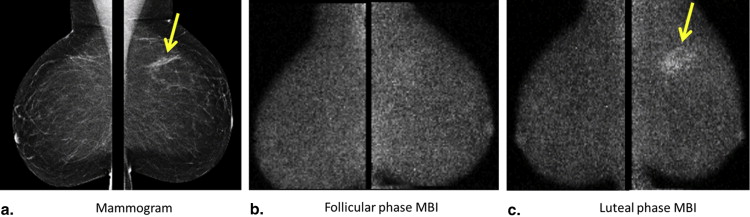
The level of Tc-99m sestamibi uptake within normal fibroglandular tissue on molecular breast imaging (MBI), termed background parenchymal uptake (BPU), has been anecdotally observed to fluctuate with menstrual cycle. Our objective was to assess the impact of menstrual cycle phase on BPU appearance.
Materials and Methods
Premenopausal volunteers who reported regular menstrual cycles and no exogenous hormone use were recruited to undergo serial MBI examinations during the follicular and luteal phase. A study radiologist, blinded to cycle phase, categorized BPU as photopenic, minimal mild, moderate, or marked. Change in BPU with cycle phase was determined, as well as correlations of BPU with mammographic density and hormone levels.
Results
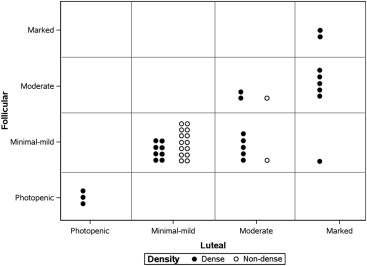
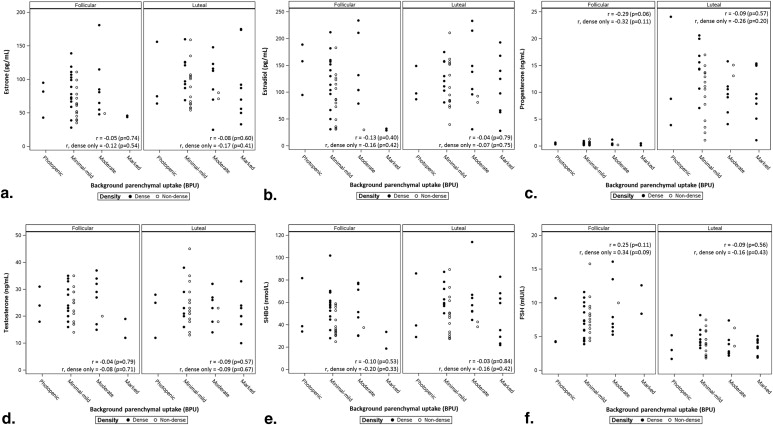
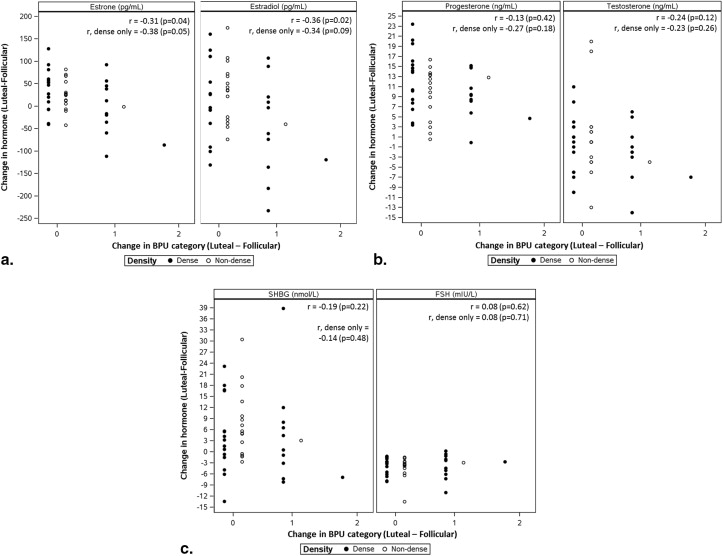
In 42 analyzable participants, high BPU (moderate or marked) was observed more often in luteal phase compared to follicular ( P = .016). BPU did not change with phase in 30 of 42 participants (71%) and increased in the luteal phase compared to follicular in 12 (29%). High BPU was more frequent in dense breasts compared to nondense breasts at both the luteal (58% [15 of 26] vs. 13% [2 of 16], P = .004) and follicular phases (35% [9 of 26] vs. 6% [1 of 16], P = .061). Spearman correlation coefficients did not show any correlation of BPU with hormone levels measured at either cycle phase and suggested a weak correlation between change in BPU and changes in estrone and estradiol between phases.
Conclusions
We observed variable effects of menstrual cycle on BPU among our cohort of premenopausal women; however, when high BPU was observed, it was most frequently seen during the luteal phase compared to follicular phase and in women with dense breasts compared to nondense breasts.
Changes in radiologic appearance of the breast due to changes in hormonal milieu across phases of the menstrual cycle have been described for multiple imaging modalities, including mammography, magnetic resonance imaging (MRI), ultrasound, optical imaging, and nuclear medicine technologies . These menstrual cycle effects have important clinical implications. Timing imaging during the follicular phase of the menstrual cycle has been shown to improve diagnostic performance for both mammography and breast MRI . In addition, variation in the magnitude of cyclic changes on breast radiologic appearance between women is thought to reflect differences in hormonal responsiveness of breast tissue, which in turn has been hypothesized as a potential differentiator of breast cancer risk . By this theory, the more variant the appearance of the breast on imaging at different stages of the menstrual cycle, the more hormonally responsive the breast tissue and the higher the breast cancer risk.
Molecular breast imaging (MBI) is a functional imaging technique that uses a dedicated gamma camera to image preferential uptake of Tc-99m sestamibi in cells with elevated metabolic activity. MBI and similar techniques using Tc-99m sestamibi have been shown to detect breast tumors, particularly those occult on mammography because of radiographically dense tissue . MBI can also demonstrate uptake in normal parenchyma, which has been termed background parenchymal uptake (BPU) . In the screening setting, we have observed variability in BPU among women with similar mammographic densities, ranging from photopenic (less-intense uptake within fibroglandular tissue compared to that in subcutaneous fat) to marked (uptake in fibroglandular tissue more than twice as intense as that in fat), suggesting that MBI depicts properties of breast parenchymal function that are not readily appreciated by the anatomic depiction of fibroglandular tissue on mammography.
Get Radiology Tree app to read full this article<
Get Radiology Tree app to read full this article<
Materials and Methods
Participants
Get Radiology Tree app to read full this article<
Get Radiology Tree app to read full this article<
MBI Procedure
Get Radiology Tree app to read full this article<
Get Radiology Tree app to read full this article<
Get Radiology Tree app to read full this article<
Serum Hormone Measurements
Get Radiology Tree app to read full this article<
Get Radiology Tree app to read full this article<
Get Radiology Tree app to read full this article<
MBI Interpretation
Get Radiology Tree app to read full this article<
Get Radiology Tree app to read full this article<
Get Radiology Tree app to read full this article<
Data Analysis
Get Radiology Tree app to read full this article<
Get Radiology Tree app to read full this article<
Get Radiology Tree app to read full this article<
Get Radiology Tree app to read full this article<
Get Radiology Tree app to read full this article<
Results
Get Radiology Tree app to read full this article<
Table 1
Participant Characteristics of 42 Eligible Participants
Characteristic Mean, Median (Range) Age at enrollment (years) 41.0, 41.0 (35–45) Length of menstrual cycle (days) ∗ 28.1, 28.0 (24–34) Follicular-phase MBI Day of cycle 7.7, 7.5 (4–13) Estrone (pg/mL) 74.3, 69.0 (28–181) Estradiol (pg/mL) 116.6, 105.5 (29–307) Progesterone (ng/mL) 0.5, 0.4 (0.16–1.3) Testosterone (ng/mL) 24.0, 23.5 (12–37) SHBG (nmol/L) 48.5, 45.8 (18.8–102) FSH (mIU/L) 8.0, 7.5 (3.9–16.1) Luteal-phase MBI Day of cycle 22.4, 22.0 (19–31) Estrone (pg/mL) 94.7, 88.0 (25–175) Estradiol (pg/mL) 119.1, 110.0 (28–233) Progesterone (ng/mL) † 11.1, 10.9 (1.1–24.1) Testosterone (ng/mL) 23.2, 23.0 (10–45) SHBG (nmol/L) 54.1, 52.1 (22–114) FSH (mIU/L) 4.1, 4.0 (1.7–8.2) Mammographic density, ‡ n (%) Almost entirely fat 3 (7.1) Scattered fibroglandular densities 13 (31) Heterogeneously dense 22 (52) Extremely dense 4 (9.5)
FSH, follicle-stimulating hormone; MBI, molecular breast imaging; SHBG, sex hormone–binding globulin.
Get Radiology Tree app to read full this article<
Get Radiology Tree app to read full this article<
Get Radiology Tree app to read full this article<
Get Radiology Tree app to read full this article<
Get Radiology Tree app to read full this article<
Get Radiology Tree app to read full this article<
Get Radiology Tree app to read full this article<
Get Radiology Tree app to read full this article<
Get Radiology Tree app to read full this article<
Get Radiology Tree app to read full this article<
Get Radiology Tree app to read full this article<
Get Radiology Tree app to read full this article<
Get Radiology Tree app to read full this article<
Get Radiology Tree app to read full this article<
Discussion
Get Radiology Tree app to read full this article<
Get Radiology Tree app to read full this article<
Get Radiology Tree app to read full this article<
Get Radiology Tree app to read full this article<
Get Radiology Tree app to read full this article<
Get Radiology Tree app to read full this article<
Get Radiology Tree app to read full this article<
Get Radiology Tree app to read full this article<
Get Radiology Tree app to read full this article<
Get Radiology Tree app to read full this article<
References
1. White E., Velentgas P., Mandelson M.T., et. al.: Variation in mammographic breast density by time in menstrual cycle among women aged 40–49 years. Journal of the National Cancer Institute 1998; 90: pp. 906-910.
2. Morrow M., Chatterton R., Rademaker A., et. al.: A prospective study of variability in mammographic density during the menstrual cycle. Breast Cancer Research and Treatment 2010; 121: pp. 565-574.
3. Buist D.S.M., Aiello E.J., Miglioretti D.L., et. al.: Mammographic breast density, dense area, and breast area differences by phase in the menstrual cycle. Cancer Epidemiology Biomarkers & Prevention 2006; 15: pp. 2303-2306.
4. Hovhannisyan G., Chow L., Schlosser A., et. al.: Differences in measured mammographic density in the menstrual cycle. Cancer Epidemiology Biomarkers & Prevention 2009; 18: pp. 1993-1999.
5. Miglioretti D.L., Walker R., Weaver D.L., et. al.: Accuracy of screening mammography varies by week of menstrual cycle. Radiology 2011; 258: pp. 372-379.
6. Kuhl C.K., Bieling H.B., Gieseke J., et. al.: Healthy premenopausal breast parenchyma in dynamic contrast-enhanced MR imaging of the breast: normal contrast medium enhancement and cyclical-phase dependency. Radiology 1997; 203: pp. 137-144.
7. Delille J.P., Slanetz P.J., Yeh E.D., et. al.: Physiologic changes in breast magnetic resonance imaging during the menstrual cycle: perfusion imaging, signal enhancement, and influence of the T1 relaxation time of breast tissue. Breast J 2005; 11: pp. 236-241.
8. Chan S., Su M.-Y.L., Lei F.-J., et. al.: Menstrual cycle–related fluctuations in breast density measured by using three-dimensional MR imaging. Radiology 2011; 261: pp. 744-751.
9. Kajihara M., Goto M., Hirayama Y., et. al.: Effect of the menstrual cycle on background parenchymal enhancement in breast MR imaging. Magnetic Resonance in Medical Sciences 2013; 12: pp. 39-45.
10. Zhou Y.Z., Jiang Y.X., Sun Q., et. al.: Features of breast ultrasound image and its correlation with estradiol and progesterone level in different phases of menstrual cycle in normal women. Zhongguo Yi Xue Ke Xue Yuan Xue Bao 2001; 23: pp. 609-613.
11. Stahel M., Wolf M., Baños A., et. al.: Optical properties of the breast during spontaneous and birth control pill-mediated menstrual cycles. Lasers Med Sci 2009; 24: pp. 901-907.
12. Diggles L., Mena I., Khalkhali I.: Bilateral increased uptake of Tc-99m sestamibi in scintimammography: its correlation with the menstrual cycle. [abstract] Journal of Nuclear Medicine Technology 1994; 22: pp. 111.
13. Larson M., Li Z., Hall C.L., et. al.: Physiological fluctuation of 99mtc-sestamibi uptake in normal mammary glands: a systematic investigation in female rats. Acta Radiologica 2009; 50: pp. 975-978.
14. Lin C.-Y., Ding H.-J., Liu C.-S., et. al.: Correlation between the intensity of breast FDG uptake and menstrual cycle. Academic Radiology 2007; 14: pp. 940-944.
15. Park H.-H., Shin J.Y., Lee J.Y., et. al.: Discussion on the alteration of 18F-FDG uptake by the breast according to the menstrual cycle in PET imaging. Engineering in Medicine and Biology Society (EMBC), 2013 35th Annual International Conference of the IEEE 2013; pp. 2469-2472.
16. Narayanan D., Madsen K.S., Kalinyak J.E., et. al.: Interpretation of positron emission mammography: feature analysis and rates of malignancy. AJR Am J Roentgenol 2011; 196: pp. 956-970.
17. Hruska C.B., Rhodes D.J., Conners A.L., et. al.: Background parenchymal uptake during molecular breast imaging and associated clinical factors. American Journal of Roentgenology 2015; 204: pp. W363-W370.
18. Khan S.A., Rogers M.A., Khurana K.K., et. al.: Estrogen receptor expression in benign breast epithelium and breast cancer risk. J Natl Cancer Inst 1998; 90: pp. 37-42.
19. Khan S.A., Sachdeva A., Naim S., et. al.: The normal breast epithelium of women with breast cancer displays an aberrant response to estradiol. Cancer Epidemiol Biomarkers Prev 1999; 8: pp. 867-872.
20. Woolcott C.G., SenGupta S.K., Hanna W.M., et. al.: Estrogen and progesterone receptor levels in nonneoplastic breast epithelium of breast cancer cases versus benign breast biopsy controls. BMC Cancer 2008; 8: pp. 130.
21. Rhodes D.J., Hruska C.B., Conners A.L., et. al.: Journal Club: Molecular breast imaging at reduced radiation dose for supplemental screening in mammographically dense breasts. American Journal of Roentgenology 2015; 204: pp. 241-251.
22. Rechtman L.R., Lenihan M.J., Lieberman J.H., et. al.: Breast-specific gamma imaging for the detection of breast cancer in dense versus nondense breasts. AJR Am J Roentgenol 2014; 202: pp. 293-298.
23. Rhodes D.J., Hruska C.B., Phillips S.W., et. al.: Dedicated dual-head gamma imaging for breast cancer screening in women with mammographically dense breasts. Radiology 2011; 258: pp. 106-118.
24. Conners A.L., Hruska C.B., Tortorelli C.L., et. al.: Lexicon for standardized interpretation of gamma camera molecular breast imaging: observer agreement and diagnostic accuracy. Eur J Nucl Med Mol Imaging 2012; 39: pp. 971-982.
25. Conners A.L., Maxwell R.W., Tortorelli C.L., et. al.: Gamma camera breast imaging lexicon. AJR Am J Roentgenol 2012; 199: pp. W767-W774.
26. D’Orsi C.I., Bassett L.W., Berg W.A.: Breast imaging reporting and data system, BI-RADS: mammography.2003.American College of RadiologyReston, VA
27. Nelson R.E., Grebe S.K., DJ O.K., et. al.: Liquid chromatography-tandem mass spectrometry assay for simultaneous measurement of estradiol and estrone in human plasma. Clin Chem 2004; 50: pp. 373-384.
28. Mayo Medical Laboratories MC. Rochester 2015 Test Catalog. Available at: http://www.mayomedicallaboratories.com/test-catalog/ . Accessed April 1, 2015.
29. McNemar Q.: Note on the sampling error of the difference between correlated proportions or percentages. Psychometrika 1947; 12: pp. 153-157.
30. Sun X., Yang Z.: Generalized McNemar’s test for homogeneity of the marginal distributions. Book Generalized McNemar’s test for homogeneity of the marginal distributions. City2008.
31. Bowker A.H.: A test for symmetry in contingency tables. J Am Stat Assoc 1948; 43: pp. 572-574.
32. Chiu M.L., Kronauge J.F., Piwnica-Worms D.: Effect of mitochondrial and plasma membrane potentials on accumulation of Hexakis (2-Methoxyisobutylisonitrile)Technetium(I) in cultured mouse fibroblasts. Journal of Nuclear Medicine 1990; 31: pp. 1646-1653.
33. O’Connor M.K., Hruska C.B., Tran T.D., et. al.: Factors influencing the uptake of 99mTc-sestamibi in breast tissue on molecular breast imaging. J Nucl Med Technol 2015; 43: pp. 13-20.
34. Wackers F.J.T., Berman D.S., Maddahi J., et. al.: Technetium-99m Hexakis 2-methoxyisobutyl isonitrile: human biodistribution, dosimetry, safety, and preliminary comparison to thallium-201 for myocardial perfusion imaging. Journal of Nuclear Medicine 1989; 30: pp. 301-311.
35. Savi A., Gerundini P., Zoli P., et. al.: Biodistribution of Tc-99m methoxy-isobutyl-isonitrile (MIBI) in humans. European Journal of Nuclear Medicine 1989; 15: pp. 597-600.
36. Mankoff D.A., Dunnwald L.K., Gralow J.R., et. al.: [Tc-99m]-sestamibi uptake and washout in locally advanced breast cancer are correlated with tumor blood flow. Nucl Med Biol 2002; 29: pp. 719-727.
37. Delmon-Moingeon L.I., Piwnica-Worms D., Van den Abbeele A.D., et. al.: Uptake of the cation hexakis (2-methoxyisobutylisonitrile)-technetium-99m by human carcinoma cell lines in vitro. Cancer Res 1990; 50: pp. 2198-2202.
38. Scopinaro F., Schillaci O., Scarpini M., et. al.: Technetium-99m sestamibi: an indicator of breast cancer invasiveness. Eur J Nucl Med 1994; 21: pp. 984-987.
39. Cwikla J.B., Buscombe J.R., Kolasinska A.D., et. al.: Correlation between uptake of Tc-99m sestaMIBI and prognostic factors of breast cancer. Anticancer Res 1999; 19: pp. 2299-2304.
40. Gann P.H., Geiger A.S., Helenowski I.B., et. al.: Estrogen and progesterone levels in nipple aspirate fluid of healthy premenopausal women: relationship to steroid precursors and response proteins. Cancer Epidemiology Biomarkers & Prevention 2006; 15: pp. 39-44.
41. Van de Wiele C., De Vos F., Slegers G., et. al.: Radiolabeled estradiol derivatives to predict response to hormonal treatment in breast cancer: a review. European Journal of Nuclear Medicine 2000; 27: pp. 1421.