
Rationale and Objectives
To assess the effect of measurement time on blood flow (BF), blood volume (BV), and k-trans-values (flow extraction product) in patients undergoing volume perfusion computed tomography (VPCT) for lung cancer.
Materials and Methods
This prospective study was approved by our local Research Ethics Committee and informed consent was obtained in all patients. Between December 2009 and December 2010, 75 VPCT scans were obtained in 54 consecutive patients (15 women, 39 men) with histologically confirmed lung cancer. A 64-second VPCT of the tumor (80 kV, 60 mAs) using 128 × 0.6-mm collimation, 6.9-cm z-axis coverage and a total of 26 volume measurements, was performed. BF, BV, and K trans were determined. Data evaluation was performed for different measurement times (64 seconds, 45 seconds, 39 seconds, and 36 seconds) by removing the last two, four, and five scans and repeating the analysis. A one-way repeated-measures analysis of variance was used to test for effects of measurement time on BF, BV, and k-trans and unpaired/paired Student t -tests were applied for comparisons within/between groups, respectively.
Results
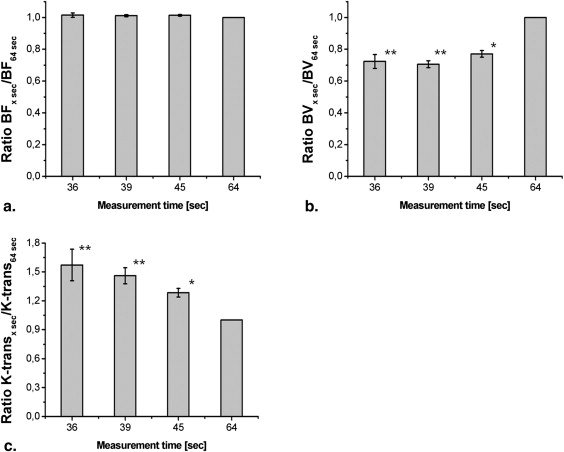
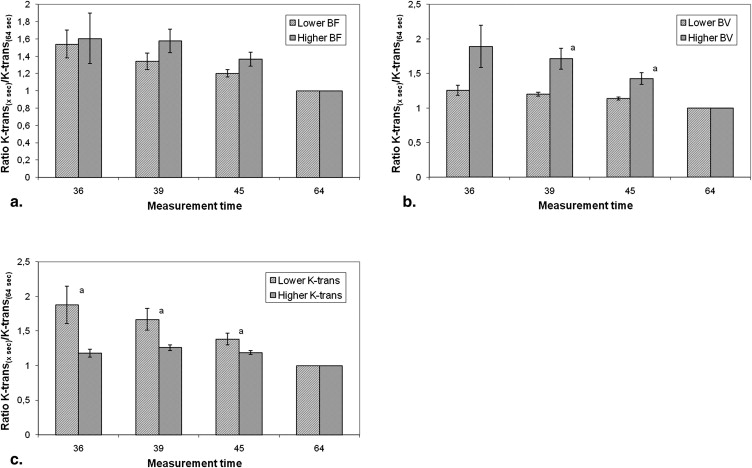
No effect of measurement time on BF values was noted ( P > .05), whereas a significant decrease of BV values (at 39 seconds: 71% ± 2% of 64-second values) and a significant increase of k-trans-values (at 39 seconds: 146% ± 8% of 64-second values) were observed with progressively shortened measurement time ( P < .05, respectively). Additionally, with reduced measurement time, the increase in k-trans-values was significantly more pronounced in those patient groups with higher BV (at 39 seconds: 171% ± 15% versus 120% ± 3% of 64-second measurements), and those with lower k-trans (at 39 seconds: 167% ± 16% versus 126% ± 4% of 64-second measurements) ( P < .05, respectively).
Conclusion
Whereas estimation of BF in lung cancer was independent from VPCT measurement time within the chosen ranges, approximation of both BV and k-trans was affected by measurement duration. A fixed measurement time of 40 seconds is recommended.
In the functional assessment of a tumor, two properties are best prone for evaluation: its metabolic activity, which is readily appreciated by molecular imaging techniques, such as positron emission tomography (PET), and its vascular characteristics (ie, perfusion and vessel wall permeability), which can be approximated by volume perfusion computed tomography (VPCT) as well as dynamic contrast-enhanced magnetic resonance imaging (DCE-MRI), and DCE ultrasound (DCE-US) . Whereas PET imaging and its applications in oncology have been extensively investigated , the significance of VPCT has scarcely been explored.
Contrast-enhanced VPCT measures changes in tissue density over time. After intravenous injection of contrast material, repeated CT scans of the tissue volume being studied are performed. The density/time curves of two structures are compared: a region of interest (ROI) is placed on the afferent artery, and a volume of interest (VOI) on the tumor being analyzed . A two-compartment model (Patlak analysis) can be used to evaluate dynamics of contrast medium. Initially, the contrast material remains predominantly intravascular and therefore can be used to measure perfusion . Over time, it leaks out of the intravascular space into the interstitium, which can be used to estimate permeability also known as transit constant (k-trans or flow extraction product, defined as the sum of the flow within the microvasculature and capillary permeability) . Only 1%–2% of an administered dose enters the intracellular space, an amount that can readily be neglected .
Get Radiology Tree app to read full this article<
Get Radiology Tree app to read full this article<
Materials and methods
Patients and Lesions
Get Radiology Tree app to read full this article<
CT Protocol
Get Radiology Tree app to read full this article<
Quantitative Perfusion Assessment
Get Radiology Tree app to read full this article<
Tumor Size and Location
Get Radiology Tree app to read full this article<
Statistics
Get Radiology Tree app to read full this article<
Results
Mean BF, BV, and k-trans
Get Radiology Tree app to read full this article<
BF, BV, and k-trans Values—Changes Through Different Measurement Times
Get Radiology Tree app to read full this article<
Get Radiology Tree app to read full this article<
Changes in k-trans Values—Dependence on Absolute BV and K-trans
Get Radiology Tree app to read full this article<
Get Radiology Tree app to read full this article<
Discussion
Get Radiology Tree app to read full this article<
Get Radiology Tree app to read full this article<
Get Radiology Tree app to read full this article<
Get Radiology Tree app to read full this article<
Conclusion
Get Radiology Tree app to read full this article<
References
1. Padhani A.R., Miles K.A.: Multiparametric imaging of tumor response to therapy. Radiology 2010; 256: pp. 348-364.
2. Kim B.T., Lee K.S., Shim S.S., et. al.: Stage T1 non-small cell lung cancer: preoperative mediastinal nodal staging with integrated FDG PET/CT–a prospective study. Radiology 2006; 241: pp. 501-509.
3. Antoch G., Stattaus J., Nemat A.T., et. al.: Non-small cell lung cancer: dual-modality PET/CT in preoperative staging. Radiology 2003; 229: pp. 526-533.
4. Yoo D.C., Dupuy D.E., Hillman S.L., et. al.: Radiofrequency ablation of medically inoperable Stage IA non-small cell lung cancer: are early posttreatment PET findings predictive of treatment outcome?. AJR Am J Roentgenol 2011; 197: pp. 334-340.
5. Petralia G., Preda L., D’Andrea G., et. al.: CT perfusion in solid-body tumours. Part I: technical issues. Radiol Med 2010; 115: pp. 858-874.
6. Miles K.A.: Perfusion CT for the assessment of tumour vascularity: which protocol?. Br J Radiol 2003; 76: pp. S36-S42.
7. Miles K.A., Charnsangavej C., Lee F.T., et. al.: Application of CT in the investigation of angiogenesis in oncology. Acad Radiol 2000; 7: pp. 840-850.
8. Kambadakone A.R., Sahani D.V.: Body perfusion CT: technique, clinical applications, and advances. Radiol Clin North Am 2009; 47: pp. 161-178.
9. Dawson P.: Functional imaging in CT. Eur J Radiol 2006; 60: pp. 331-340.
10. Miles K.A., Griffiths M.R.: Perfusion CT: a worthwhile enhancement?. Br J Radiol 2003; 76: pp. 220-231.
11. Patlak C.S., Blasberg R.G., Fenstermacher J.D.: Graphical evaluation of blood-to-brain transfer constants from multiple-time uptake data. J Cereb Blood Flow Metab 1983; 3: pp. 1-7.
12. Dawson P., Peters M.: Dynamic contrast bolus computed tomography for the assessment of renal function. Invest Radiol 1993; 28: pp. 1039-1042.
13. Li Y., Yang Z.G., Chen T.W., et. al.: Whole tumour perfusion of peripheral lung carcinoma: evaluation with first-pass CT perfusion imaging at 64-detector row CT. Clin Radiol 2008; 63: pp. 629-635.
14. Reiner C.S., Goetti R., Eberli D., et. al.: CT Perfusion of renal cell carcinoma: impact of volume coverage on quantitative analysis. Invest Radiol 2011; [Epub ahead of print]
15. Goetti R., Reiner C.S., Knuth A., et. al.: Quantitative perfusion analysis of malignant liver tumors: dynamic computed tomography and contrast-enhanced ultrasound. Invest Radiol 2011; [Epub ahead of print]
16. Ketelsen D., Horger M., Buchgeister M., et. al.: Estimation of radiation exposure of 128-slice 4D-perfusion CT for the assessment of tumor vascularity. Korean J Radiol 2010; 11: pp. 547-552.
17. Saddi KA, Chefd’hofel C, Cheriet F. Large deformation registration of contrast-enhanced images with volume-preserving constraint. In: Pluim JPW, Reinhard JM, eds. Medical Imaging 2007 – Image Processing. Proceedings of the International Society for Optical Engineering (SPIE) 2007; Bellingham, WA.
18. Mineo T.C., Ambrogi V., Baldi A., et. al.: Prognostic impact of VEGF, CD31, CD34, and CD105 expression and tumour vessel invasion after radical surgery for IB-IIA non-small cell lung cancer. J Clin Pathol 2004; 57: pp. 591-597.
19. Fraioli F., Anzidei M., Zaccagna F., et. al.: Whole-tumor perfusion CT in patients with advanced lung adenocarcinoma treated with conventional and antiangiogenetic chemotherapy: initial experience. Radiology 2011; 259: pp. 574-582.
20. Pandharipande P.V., Krinsky G.A., Rusinek H., et. al.: Perfusion imaging of the liver: current challenges and future goals. Radiology 2005; 234: pp. 661-673.
21. Wang J., Chen L.T., Tsang Y.M., et. al.: Dynamic contrast-enhanced MRI analysis of perfusion changes in advanced hepatocellular carcinoma treated with an antiangiogenic agent: a preliminary study. AJR Am J Roentgenol 2004; 183: pp. 713-719.
22. Jiang H.J., Zhang Z.R., Shen B.Z., et. al.: Quantification of angiogenesis by CT perfusion imaging in liver tumor of rabbit. Hepatobiliary Pancreat Dis Int 2009; 8: pp. 168-173.
23. Lee T.Y., Purdie T.G., Stewart E.: CT imaging of angiogenesis. Q J Nucl Med 2003; 47: pp. 171-187.
24. Swensen S.J., Brown L.R., Colby T.V., et. al.: Pulmonary nodules: CT evaluation of enhancement with iodinated contrast material. Radiology 1995; 194: pp. 393-398.
25. Zhang M., Kono M.: Solitary pulmonary nodules: evaluation of blood flow patterns with dynamic CT. Radiology 1997; 205: pp. 471-478.
26. Swensen S.J., Viggiano R.W., Midthun D.E., et. al.: Lung nodule enhancement at CT: multicenter study. Radiology 2000; 214: pp. 73-80.
27. Li Y., Yang Z.G., Chen T.W., et. al.: First-pass perfusion imaging of solitary pulmonary nodules with 64-detector row CT: comparison of perfusion parameters of malignant and benign lesions. Br J Radiol 2010; 83: pp. 785-790.
28. Ma S.H., Xu K., Xiao Z.W., et. al.: Peripheral lung cancer: relationship between multi-slice spiral CT perfusion imaging and tumor angiogenesis and cyclin D1 expression. Clin Imaging 2007; 31: pp. 165-177.
29. Tacelli N., Remy-Jardin M., Copin M.C., et. al.: Assessment of non-small cell lung cancer perfusion: pathologic-CT correlation in 15 patients. Radiology 2010; 257: pp. 863-871.
30. Park M.S., Klotz E., Kim M.J., et. al.: Perfusion CT: noninvasive surrogate marker for stratification of pancreatic cancer response to concurrent chemo- and radiation therapy. Radiology 2009; 250: pp. 110-117.
31. Zahra M.A., Hollingsworth K.G., Sala E., et. al.: Dynamic contrast-enhanced MRI as a predictor of tumour response to radiotherapy. Lancet Oncol 2007; 8: pp. 63-74.
32. Miles K.A.: Functional CT imaging in oncology. Eur Radiol 2003; 13: pp. M134-M138.