
Rationale and Objectives
With employment of both multidetector computed tomography (MDCT) and endobronchial procedures in multicenter studies, effects of timing of endobronchial procedures on quantitative imaging (Q-MDCT) metrics is a question of increasing importance.
Materials and Methods
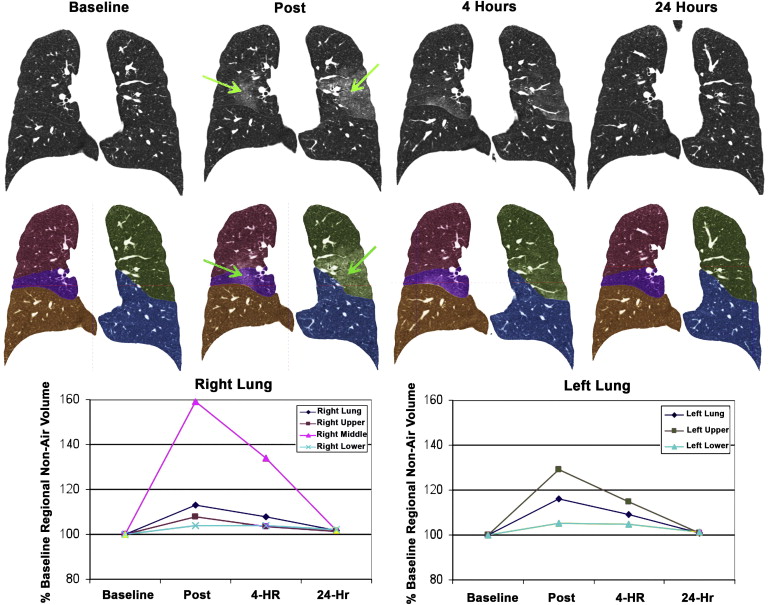
Six subjects were studied via MDCT at baseline, immediately following and at 4 hours and 24 hours post-bronchoalveolar lavage (BAL) (right middle lobe and lingula). Through quantitative image analysis, non-air, or “tissue” volume (TV) in each lung and lobe was recorded. Change in TV from baseline was used to infer retention and redistribution of lavage fluid.
Results
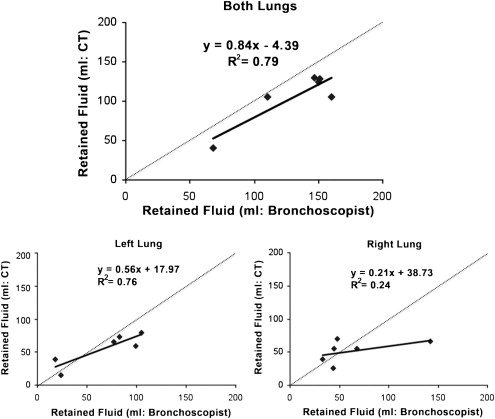
Bronchoscopist reported unrecovered BAL volume correlated well with Q-MDCT for whole lung measures, but less well with individual lobes indicating redistribution. TV in all lobes except the right lower lobe differed significantly ( P < .05) from baseline immediately post lavage. At 24 hours, all lobes except the left lower lobe (small 1% mean difference at 24 hours) returned to baseline.
Conclusions
These findings suggest fluid movement affecting Q-MDCT metrics between lobes and between lungs before eventual resolution, and preclude protocols involving the lavage of one lung and imaging of the other to avoid interactions. We demonstrate that Q-MDCT is sensitive to lavage fluid retention and redistribution, and endobronchial procedures should not precede Q-MDCT imaging by less than 24 hours.
This study seeks to understand the interaction of bronchoalveolar lavage (BAL) and quantitative measures obtained from multidetector-row x-ray computed tomography (Q-MDCT). There has been considerable effort to use regional lung density measures from Q-MDCT for the objective assessment of lung pathology . Q-MDCT density measures have been shown to accurately reflect regional air and non-air content of the lung , and comparisons with biopsy samples have been made in humans to validate these measures .
BAL is used in pulmonary research and clinical practice as a means of access to the lung parenchyma. During the lavage procedure, 30%–40% of instilled saline is left unrecovered in the lungs of healthy patients. The unrecovered volume is increased in smokers and patients with obstructive lung disease . Volumes of individual aliquots instilled by both clinicians and researchers vary, usually between 20 and 200 mL; approximately 100–200 mL cumulative saline is used at each site . Despite BAL’s wide use as an academic, diagnostic, and therapeutic tool, specifics of the procedure are not standardized and many results are susceptible to a great degree of uncertainty, as summarized by Baughman . Of particular importance in recent efforts to establish study designs for complex multicenter studies of the lung has been the question of how to sequence an endobronchial procedure relative to a Q-MDCT study. With the difficulty of scheduling the Q-MDCT exam and the pressure to complete a series of procedures in a single day, there have been efforts to simply allow the Q-MDCT scan to float within the order of procedures. Little is known, however, of the fate or consequences of unretrieved saline. Klein et al have demonstrated that for as much as an hour or longer after BAL, lung mechanics as well as blood gases can be significantly altered. This is of interest as one might not expect that a localized alteration of a single lobar segment would change lung mechanics. Imaging studies of BAL fluid itself are largely limited to chest films and V/Q scans . One such study found a correlation between volume of retained fluid and qualitative measures of opacity on immediate postlavage images; these opacities cleared after 24 hours . Though studies have combined both Q-MDCT and BAL as adjuncts in patient treatment or even compared their respective diagnostic values . CT data of BAL fluid itself is minimal. The effects of BAL on Q-MDCT is critical, particularly when Q-MDCT measures are being sought to follow, for instance, progression of emphysema when it has been shown that such changes are on the order of 2.5 Hounsfield unit change in lung density per year .
Get Radiology Tree app to read full this article<
Materials and methods
Subjects
Get Radiology Tree app to read full this article<
Study Design
Timeline
Get Radiology Tree app to read full this article<
Get Radiology Tree app to read full this article<
Table 1
Location and Amount of Lavage Fluid Delivered and Retrieved
Subject Location Total Fluid (mL) Total Unretrieved per Side (mL) Total unretrieved (mL) 1 RB5 120 48 147 LB4 220 99 2 RB5 220 142 (coughed much of large lavage out) 160 LB4 120 18 3 RB5 120 33 110 LB4 220 77 4 RB5 220 68 151 LB4 120 83 5 RB5 120 45 150 LB4 220 105 6 RB5 220 44 68 LB4 120 24
LB, left segmental bronchi; RB, right segmental bronchi.
Bronchoscopist-reported volumes instilled and recovered during a bronchoalveolar lavage procedure. During aspiration of subject 1, the bronchoscopist did not count the “junk” aspirate, a term used for the first 20 mL of aspirate. Subject 2 was reported to have immediately coughed out much of the lavage delivered to the right middle lobe before aspiration.
Get Radiology Tree app to read full this article<
Get Radiology Tree app to read full this article<
CT imaging
Get Radiology Tree app to read full this article<
Analysis
Get Radiology Tree app to read full this article<
Estimation of retained bronchoalveolar lavage saline
Get Radiology Tree app to read full this article<
Get Radiology Tree app to read full this article<
Retainedlavagefluid=(TVTimeX)−(TVBaseline) Retained
lavage
fluid
=
(
TV
Time
X
)
-
(
TV
Baseline
)
where TV Time x is the non–air volume within a segmented area of the CT scan at a time x after lavage, and TV Baseline is non–air volume within that area before lavage. In the interest of standardization among patients, values are reported as a percentage of baseline non–air values, as shown in this expression:
(TVTimeX)−(TVBaseline)(TVBaseline)×100% (
TV
Time
X
)
-
(
TV
Baseline
)
(
TV
Baseline
)
×
100
%
Get Radiology Tree app to read full this article<
Results
Subject Characteristics
Get Radiology Tree app to read full this article<
Table 2
Subject Characteristics
Male Female All_n_ 4 2 6 Mean age ± SD (y) 27.3 (7.1) 20.5 (0.7) 25 (6.5) Age range (y) 22–37 20–21 20–37 Mean % FEV 1 (SD) (L) 95.5 (8.4) 94.5 (14.9) 95.2 (9.3) Mean % FVC (SD) (L) 96.0 (9.6) 96.5 (6.4) 96.2 (7.9) Mean FEV 1 /FVC (SD) (%) 83 (3.0) 84 (8.0) 83 (4.0)
FEV 1 , forced expiratory volume in 1 second; FVC, forced vital capacity; SD, standard deviation.
Get Radiology Tree app to read full this article<
Visual Assessment
Get Radiology Tree app to read full this article<
Quantitative Assessment of Retained BAL Fluid
Get Radiology Tree app to read full this article<
Get Radiology Tree app to read full this article<
Get Radiology Tree app to read full this article<
Get Radiology Tree app to read full this article<
![Figure 3, Individual data for all subjects showing change in non–air volume relative to baseline scan. Values are calculated as [(region non-air) - (region baseline non-air)]/(lung baseline non-air). Considerable heterogeneity exists between subjects with respect to changes in non-air volume among lobes over time. With the exception of Subject 1(see Discussion), non–air volume values return to near baseline at 24 hours.](https://storage.googleapis.com/dl.dentistrykey.com/clinical/EffectofSegmentalBronchoalveolarLavageonQuantitativeComputedTomographyoftheLung/2_1s20S1076633211001644.jpg)
Get Radiology Tree app to read full this article<
Get Radiology Tree app to read full this article<
Table 3
Increase in CT-based Non–air Volume as a Percent of Baseline ± Standard Deviation
Post (%) 4 Hours (%) 24 Hours (%) Left lung 116 ± 7.76 ∗ 109 ± 7.17 ∗ 101 ± 1.95 Left upper lobe 129 ± 13.5 ∗ 115 ± 10.6 ∗ 101 ± 3.35 Left lower lobe 105 ± 4.13 ∗ 105 ± 5.84 101 ± 0.98 ∗ Right lung 113 ± 4.97 ∗ 108 ± 7.00 ∗ 102 ± 3.29 Right upper lobe 108 ± 5.77 ∗ 103 ± 6.49 101 ± 2.94 Right middle lobe 159 ± 16.5 ∗ 134 ± 15.6 ∗ 102 ± 7.22 Right lower lobe 104 ± 5.39 104 ± 7.20 102 ± 4.07 Both lungs 114 ± 5.43 ∗ 109 ± 6.66 ∗ 101 ± 2.51
Average (((TV Time x ) − (TV Baseline )/(TV Baseline )) × 100%), ± standard deviation. Values that are significantly different ( P < .05) from baseline (defined as 100%) are denoted by an asterisk.
Get Radiology Tree app to read full this article<
Discussion
Validation of Approach
Get Radiology Tree app to read full this article<
Get Radiology Tree app to read full this article<
Assessment of Unretrieved Fluid Behavior, Distribution, and Clearance
Get Radiology Tree app to read full this article<
Get Radiology Tree app to read full this article<
Get Radiology Tree app to read full this article<
Analysis of One BAL Subject after a Febrile Response
Get Radiology Tree app to read full this article<
Get Radiology Tree app to read full this article<
Acknowledgments
Get Radiology Tree app to read full this article<
Get Radiology Tree app to read full this article<
Get Radiology Tree app to read full this article<
References
1. Coxson H.O., Rogers R.M.: Quantitative computed tomography of chronic obstructive pulmonary disease. Acad Radiol 2005; 12: pp. 1457-1463.
2. Hoffman E.A., Simon B.A., McLennan G.: State of the art. A structural and functional assessment of the lung via multidetector-row computed tomography: phenotyping chronic obstructive pulmonary disease. Proc Am Thorac Soc 2006; 3: pp. 519-532.
3. Kinsella M., Muller N.L., Abboud R.T., et. al.: Quantitation of emphysema by computed tomography using a “density mask” program and correlation with pulmonary function tests. Chest 1990; 97: pp. 315-321.
4. Newell J.D., Hogg J.C., Snider G.L.: Report of a workshop: quantitative computed tomography scanning in longitudinal studies of emphysema. Eur Respir J 2004; 23: pp. 769-775.
5. Hoffman E.A.: Effect of body orientation on regional lung expansion: a computed tomographic approach. J Appl Physiol 1985; 59: pp. 468-480.
6. Coxson H.O., Rogers R.M., Whittall K.P., et. al.: A quantification of the lung surface area in emphysema using computed tomography. Am J Respir Crit Care Med 1999; 159: pp. 851-856.
7. Crystal R.G., Reynolds H.Y., Kalica A.R.: Bronchoalveolar lavage. The report of an international conference. Chest 1986; 90: pp. 122-131.
8. Goldstein R.A., Rohatgi P.K., Bergofsky E.H., et. al.: Clinical role of bronchoalveolar lavage in adults with pulmonary disease. Am Rev Respir Dis 1990; 142: pp. 481-486.
9. Merchant R.K., Schwartz D.A., Helmers R.A., et. al.: Bronchoalveolar lavage cellularity. The distribution in normal volunteers. Am Rev Respir Dis 1992; 146: pp. 448-453.
10. Technical recommendations and guidelines for bronchoalveolar lavage (BAL). Eur Respir J 1989; 2: pp. 561-585.
11. Baughman R.P.: The uncertainties of bronchoalveolar lavage. Eur Respir J 1997; 10: pp. 1940-1942.
12. Baughman R.P.: Technical aspects of bronchoalveolar lavage: recommendations for a standard procedure. Semin Respir Crit Care Med 2007; 28: pp. 475-485.
13. Klein U., Karzai W., Zimmerman P., et. al.: Changes in pulmonary mechanics after fiberoptic bronchoalveolar lavage in mechanically ventilated patients. Intensive Care Med 1998; 24: pp. 1289-1293.
14. Chen C.C., Andrich M.P., Shelhamer J.: Abnormalities on ventilation/perfusion lung scans induced by bronchoalveolar lavage. J Nucl Med 1993; 34: pp. 1854-1858.
15. Gurney J.W., Harrison W.C., Sears K., et. al.: Bronchoalveolar lavage: radiographic manifestations. Radiology 1987; 163: pp. 71-74.
16. Clements P.J., Goldin J.G., Kleerup E.C., et. al.: Regional differences in bronchoalveolar lavage and thoracic high-resolution computed tomography results in dyspneic patients with systemic sclerosis. Arthritis Rheum 2004; 50: pp. 1909-1917.
17. Davis S.D., Fordham L.A., Brody A.S., et. al.: Computed tomography reflects lower airway inflammation and tracks changes in early cystic fibrosis. Am J Respir Crit Care Med 2007; 175: pp. 943-950.
18. Sharma S.K., Mukhopadhyay S., Arora R., et. al.: Computed tomography in miliary tuberculosis: comparison with plain films, bronchoalveolar lavage, pulmonary functions and gas exchange. Australas Radiol 1996; 40: pp. 113-118.
19. Shin K.M., Lee K.S., Chung M.P., et. al.: Prognostic determinants among clinical, thin-section CT, and histopathologic findings for fibrotic idiopathic interstitial pneumonias: tertiary hospital study. Radiology 2008; 249: pp. 328-337.
20. Tschirren J., Hoffman E.A., McLennan G., et. al.: Intrathoracic airway trees: segmentation and airway morphology analysis from low dose CT scans. IEEE Trans Med Imaging 2005; 24: pp. 1529-1539.
21. Shikata H., Ea H., Sonka M.: Automated segmentation of pulmonary vascular tree from 3D CT images. Progr Biomed Optics Imaging 2004; 5: pp. 107-116.
22. Hu S., Hoffman E.A., Reinhardt J.M.: Automatic lung segmentation for accurate quantitation of volumetric X-ray CT images. IEEE Trans Med Imaging 2001; 20: pp. 490-498.
23. Zhang L., Hoffman E.A., Reinhardt J.M.: Atlas-driven lung lobe segmentation in volumetric X-ray CT images. IEEE Trans Med Imaging 2006; 25: pp. 1-16.