
Rationale and Objectives
To evaluate the effect that variations in the enhancement threshold have on the diagnostic accuracy of two computer-aided detection (CAD) systems for magnetic resonance based breast cancer screening.
Materials and Methods
Informed consent was obtained from all patients participating in cancer screening and this study was approved by the participating institution’s review board. This retrospective study was nested in a prospective, single-institution, high-risk, breast screening study involving dynamic contrast-enhanced magnetic resonance imaging. Only those screening examinations ( n = 223) for which a histopathological diagnosis was available were included. Two CAD methods were performed: the signal enhancement ratio (SER) and support vector machines (SVMs). Statistical analysis was performed by tracking changes in each CAD test’s diagnostic accuracy (eg, receiver-operating characteristic [ROC] curve area, maximum possible sensitivity) with changes in the enhancement threshold.
Results
The enhancement threshold plays a significant role in affecting a CAD test’s potential sensitivity, ROC curve area, and number of assumed true and false-positive predictions per cancerous examination. A high threshold can also limit the CAD-based detection of the full size of a lesion.
Conclusions
Enhancement thresholds can limit a CAD test’s ability to diagnose a lesion’s full size and as such should not be raised above 60%. The clinically used SER method exhibits a high rate of false positives at low enhancement thresholds and as such the threshold should not be set lower than 50%. The SVM method yielded better results in our study than the SER method at clinically realistic enhancement thresholds.
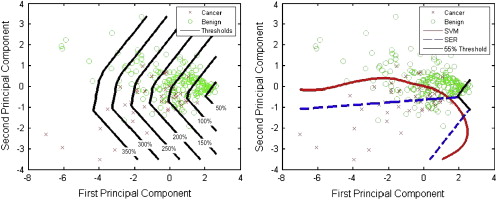
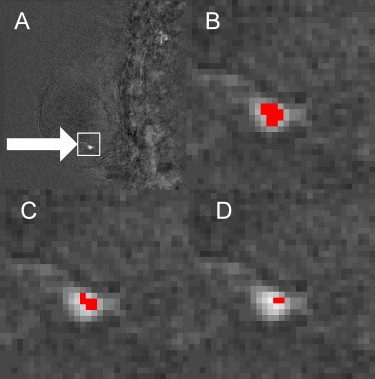
Dynamic contrast-enhanced magnetic resonance imaging (MRI) has been shown to be an effective modality for breast cancer screening ( ); however, there is considerable interobserver variability between radiologists in their interpretation of the large amounts of data acquired in a breast MRI examination . Computer-aided detection (CAD) systems have the potential to further improve dynamic contrast-enhanced-MRI based breast cancer screening by reducing interobserver variability. A breast MRI examination involves the injection of a contrast agent that causes some tissues to enhance (brighten). The amount of enhancement can be calculated as a percentage of increased signal intensity (brightness). Breast MRI CAD systems identify suspected malignant regions and are routinely complemented by an enhancement threshold that limits the number of false-positive predictions by forcing the diagnosis of a specific region of tissue as being benign if the tissue’s brightness does not reach the set enhancement threshold. The role of the enhancement threshold in breast MRI CAD systems is illustrated in Figure 1 ; example curves that exceed the enhancement threshold (a, b) as well as curves that do not exceed the threshold (c, d) are provided in Figure 2 . Considerable research has been conducted on the use of CAD tools for breast MRI that employ an enhancement threshold; however, justification for the threshold selected is typically limited and reported threshold values vary considerably from 40% to 150% ( ). The purpose of this study is to evaluate the effect that variations in the enhancement threshold have on the CAD of breast cancer using MRI.
 Open full size image
Figure 1
Block diagram illustrating the role of the enhancement threshold in breast magnetic resonance imaging computer-aided diagnosis (CAD) systems. Dx: diagnosis; SVM: support vector machine; SER: signal enhancement ratio.
 Open full size image
Figure 2
Example signal intensity time curves with respect to the enhancement threshold. Curves C and D are below the threshold and therefore will both be labeled benign by the computer-aided diagnosis system.
Materials and methods
Patients and Lesions
Get Radiology Tree app to read full this article<
Screening MRI Technique
Get Radiology Tree app to read full this article<
CAD
Get Radiology Tree app to read full this article<
Statistical Analysis
Get Radiology Tree app to read full this article<
Get Radiology Tree app to read full this article<
Get Radiology Tree app to read full this article<
Classifier Visualization
Get Radiology Tree app to read full this article<
Get Radiology Tree app to read full this article<
Results
Get Radiology Tree app to read full this article<
![Figure 3, Enhancement threshold versus receiver-operating characteristic (ROC) area for signal enhancement ratio (SER) and support vector machine (SVM) (upper left) , threshold vs. ratio (assumed true-positive pixels [ATPP]/assumed false-positive pixels [AFPP]) for SER and SVM (upper right) , and threshold versus maximum test sensitivity (bottom) .](https://storage.googleapis.com/dl.dentistrykey.com/clinical/EffectoftheEnhancementThresholdontheComputerAidedDetectionofBreastCancerusingMRI/1_1s20S1076633209002530.jpg)
Get Radiology Tree app to read full this article<
Get Radiology Tree app to read full this article<
Get Radiology Tree app to read full this article<
Get Radiology Tree app to read full this article<
Discussion
Get Radiology Tree app to read full this article<
Get Radiology Tree app to read full this article<
Get Radiology Tree app to read full this article<
Acknowledgments
Get Radiology Tree app to read full this article<
Get Radiology Tree app to read full this article<
References
1. Warner E., Plewes D.B., Hill K.A., et. al.: Surveillance of BRCA1 and BRCA2 mutation carriers with magnetic resonance imaging, ultrasound, mammography, and clinical breast examination. J Am Med Assoc 2004; 292: pp. 1317-1325.
2. Lehman C.D., Gatsonis C., Kuhl C.K., et. al.: MRI evaluation of the contralateral breast in women with recently diagnosed breast cancer. N Engl J Med 2007; 356: pp. 1295-1303.
3. Pediconi F., Catalano C., Roselli A., et. al.: Contrast-enhanced MR mammography for evaluation of the contralateral breast in patients with diagnosed unilateral breast cancer or high-risk lesions. Radiology 2007; 243: pp. 670-680.
4. Lee S.G., Orel S.G., Woo I.J., et. al.: MR imaging screening of the contralateral breast in patients with newly diagnosed breast cancer: preliminary results. Radiology 2003; 226: pp. 773-778.
5. Warren R., Hayes C., Pointon L., et. al.: A test of performance of breast MRI interpretation in a multicentre screening study. Magn Reson Imaging 2006; 24: pp. 917-929.
6. Williams T.C., DeMartini W.B., Partridge S.C., et. al.: Breast MR imaging: computer-aided evaluation program for discriminating benign from malignant lesions. Radiology 2007 2007; 244: pp. 94-103.
7. Lehman C.D., Peacock S., DeMartini W.B., et. al.: A new automated software system to evaluate breast MR examinations: improved specificity without decreased sensitivity. AJR Am J Roentgenol 2006; 187: pp. 51-56.
8. Joe BN, Urioste A, Vahidi K, et al., Evaluation of CADStream for serial automated breast tumor volume measurements in patients undergoing neoadjuvant chemotherapy for breast cancer. Proc. Intl. Soc. Mag. Reson. Med., Vol. 14, pp.1796.
9. Szabo B.K., Aspelin P., Wiberg M.K.: Neural network approach to the segmentation and classification of dynamic magnetic resonance images of the breast: comparison with empiric and quantitative kinetic parameters. Acad Radiol 2004; 11: pp. 1344-1354.
10. DeMartini W.B., Lehman C.D., Peacock S., et. al.: Computer-aided detection applied to breast MRI: assessment of CAD-generated enhancement and tumor sizes in breast cancers before and after neoadjuvant chemotherapy. Acad Radiol 2005; 12: pp. 806-814.
11. Partridge S.C., Gibbs J.E., Lu Y., et. al.: MRI measurements of breast tumor volume predict response to neoadjuvant chemotherapy and recurrence-free survival. Am J Roentgenol 2005; 184: pp. 1774-1781.
12. Liu P.F., Debatin J.F., Caduff R.F., et. al.: Improved diagnostic accuracy in dynamic contrast enhanced MRI of the breast by combined quantitative and qualitative analysis. Br J Radiol 1998; 71: pp. 501-509.
13. Penn A., Thompson S., Brem R., et. al.: Morphologic blooming in breast MRI as a characterization of margin for discriminating benign from malignant lesions. Acad Radiol 2006; 13: pp. 1344-1354.
14. Kuhl C.K., Bieling H.B., Gieseke J., et. al.: Healthy premenopausal breast parenchyma in dynamic contrast-enhanced MR imaging of the breast: normal contrast medium enhancement and cyclical-phase dependency. Radiology 1997; 203: pp. 137-144.
15. Mussurakis S., Gibbs P., Horsman A.: Primary breast abnormalities: selective pixel sampling on dynamic gadolinium-enhanced MR images. Radiology 1998; 206: pp. 465-473.
16. Kuhl C.K., Schild H.H., Morakkabati N.: Dynamic bilateral contrast-enhanced MR imaging of the breast: trade-off between spatial and temporal resolution. Radiology 2005; 236: pp. 789-800.
17. Fischer D.R., Baltzer P., Malich A., et. al.: Is the ‘blooming sign’ a promising additional tool to determine malignancy in MR mammography?. Eur Radiol 2004; 14: pp. 394-401.
18. Niemeyer T.L., Wood C., Stegbauer K.C., et. al.: Comparison of automatic time curve selection methods for breast MR CAD. Proc SPIE Med Imaging 2004; Vol. 5370: pp. 785-790.
19. Tzacheva A.A., Najarian K., Brockway J.P.: Breast cancer detection in gadolinium-enhanced MR images by static region descriptors and neural networks. J Magn Reson Imaging 2003; 17: pp. 337-342.
20. Causer P., Piron C., Jong R., et. al.: MR imaging-guided breast localization system with medial or lateral access. Radiology 2006; 240: pp. 369-379.
21. Greenman R.L., Lenkinski R.E., Schnall M.D.: Bilateral imaging using separate interleaved 3D volumes and dynamically switched multiple receive coil arrays. Magn Reson Med 1998; 39: pp. 108-115.
22. Al Martel, Froh M.S., Brock K.K., et. al.: Evaluating an optical-flow based registration algorithm for contrast-enhanced magnetic resonance imaging of the breast. Phys Med Biol 2007; 52: pp. 3803-3816.
23. Hylton N.: Dynamic contrast-enhanced magnetic resonance imaging as an imaging biomarker. J Clin Oncol 2006; 24: pp. 3293-3298.
24. Vapnik V.N.: Support vector (SV) machines, The nature of statistical learning theory.Jordan M.Lauritzen S.L.Lawless J.F. et. al.1999.Springer-VerlagNew York:pp. 138-145.
25. Levman J., Leung T., Causer P., et. al.: Classification of dynamic contrast-enhanced magnetic resonance breast lesions by support vector machines. IEEE Trans Med Imaging 2008; 27: pp. 688-696.
26. Nattkemper T.W., Arnrich B., Lichte O., et. al.: Evaluation of radiological features for breast tumour classification in clinical screening with machine learning methods. Artif Intell Med 2005; 34: pp. 129-139.
27. Chang CC, Lin CJ. LIBSVM&mdasha library forsupport vector machines (Online). http://www.csie.ntu.edu.tw/∼cjlin/libsvm/ . Accessed April 2008.
28. Eng J.: Receiver Operating characteristic analysis: a primer. Acad Radiol 2005; 12: pp. 909-916.