
Rationale and Objectives
The aim of this study was to determine whether the administration of gadolinium diethylenetriamine penta-acetic acid (Gd-DTPA) significantly affects shimming and water suppression on kidney magnetic resonance spectroscopic prescanning and whether the impact of shimming and water suppression is changed with time after intravenous administration on a 3.0-T system.
Methods
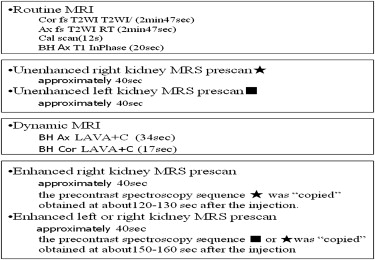
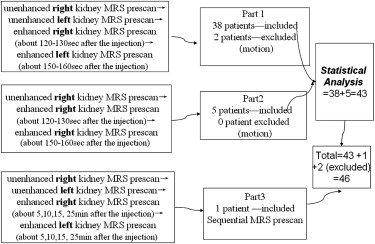
Forty patients (two patients were excluded from analysis because of motion) were examined before and after the administration of Gd-DTPA (the interval between the right and left kidneys was approximately 40 seconds). Regions of interest were carefully positioned in the region of the corresponding location of both kidneys separately. Line widths (full width at half maximum) and water suppression were obtained. A paired t test for comparison of means was used. In addition, repeat measurements with a shorter time interval (obtained 120–130 seconds after the injection) and a longer time interval (obtained 150–160 seconds after the injection) were performed in five patients in the same regions of interest of the right kidney. Sequential 1 H magnetic resonance spectroscopic prescanning in the same region of interest was performed in one patient.
Results
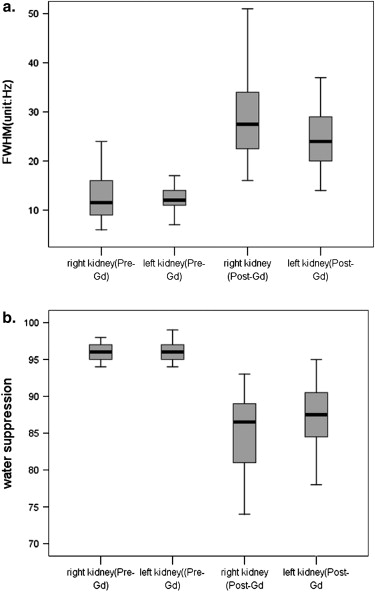
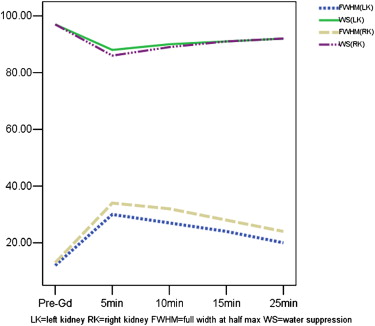
The left kidney had slightly better shimming and water suppression effects than the right kidney after contrast agent administration (all P values < .01). The limiting resolution of both shimming and water suppression effects was decreased on enhanced images in both kidneys (all P values < .01). The longer time interval group had better shimming and water suppression effects than the shorter time interval group (all P values < .01). After the administration of Gd-DTPA in one patient, sequential values of shimming and water suppression in the right and left kidneys, respectively, were 13 Hz and 97% and 12 Hz and 97% prior to the examination, 34 Hz and 86% and 30 Hz and 88% at 5 minutes, 32 Hz and 89% and 27 Hz and 90% at 10 minutes, 28 Hz and 91% and 24 Hz and 91% at 15 minutes, and 24 Hz and 92% and 20 Hz and 92% at 25 minutes.
Conclusions
Gd-DTPA exerts adverse effects on water suppression and shimming, both of which show a trend of becoming well gradually with time extension after the injection of Gd-DTPA. This phenomenon limits the diagnostic use of kidney magnetic resonance spectroscopy performed immediately after contrast-enhanced magnetic resonance imaging.
Magnetic resonance spectroscopic (MRS) imaging is a noninvasive technique that is increasingly applied to delineate biochemical changes of the kidneys. These include the determination of the heterogeneity of intracellular pH, the discovery of organic solutes that protect the kidneys from the hostile extracellular environment they manufacture, and the diagnosis of renal malignancies and treatment monitoring, which are still in the early stages of development . The recent installation of higher field strength (3-T) clinical magnets with multicoil arrays for the body offers new opportunities for performing body MRS imaging. Improved signal-to-noise ratios can reduce acquisition times, and the higher field strength also provides better separation of resonances .
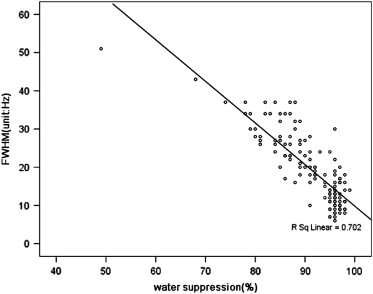
The diagnostic value of abdominal magnetic resonance spectroscopy relies on adequate technical factors such as the prescan adjustments of shimming and effective water suppression . Line width is usually defined as the full width at half maximum (FWHM) peak height in the frequency domain. It determines the resolution available to discern spectral features. As shimming improves the field homogeneity, line widths become smaller, and spectroscopic resolution is enhanced. Most prescan failure arises from inadequate water suppression. Strong resonance signals in prescans from the hydrogen atoms in water molecules may interfere the signals from the lower concentration compounds of interest. The water signal may be suppressed to better discern the resonance signals of compounds of interest .
Get Radiology Tree app to read full this article<
Get Radiology Tree app to read full this article<
Materials and methods
Subjects
Get Radiology Tree app to read full this article<
MRS Protocol
Get Radiology Tree app to read full this article<
Get Radiology Tree app to read full this article<
Get Radiology Tree app to read full this article<
Get Radiology Tree app to read full this article<
Get Radiology Tree app to read full this article<
Get Radiology Tree app to read full this article<
Get Radiology Tree app to read full this article<
Get Radiology Tree app to read full this article<
Statistical Analysis
Get Radiology Tree app to read full this article<
Get Radiology Tree app to read full this article<
Results
Comparison Between the Right and Left Kidneys Before and After Administration
Get Radiology Tree app to read full this article<
Get Radiology Tree app to read full this article<
Get Radiology Tree app to read full this article<
Comparison Between Shorter and Longer Time Interval Groups of Right Kidney Prescanning After Administration
Get Radiology Tree app to read full this article<
Sequential 1 H MRS Prescan Acquired from One Subject
Get Radiology Tree app to read full this article<
Get Radiology Tree app to read full this article<
Scatterplots and Pearson’s Correlation of FWHM and Water Suppression
Get Radiology Tree app to read full this article<
Get Radiology Tree app to read full this article<
Discussion
Get Radiology Tree app to read full this article<
Get Radiology Tree app to read full this article<
Get Radiology Tree app to read full this article<
Get Radiology Tree app to read full this article<
Get Radiology Tree app to read full this article<
Get Radiology Tree app to read full this article<
Conclusions
Get Radiology Tree app to read full this article<
Get Radiology Tree app to read full this article<
References
1. Balaban R.S.: MRS of the kidney. Invest Radiol 1989; 24: pp. 988-992.
2. Hricak H.: Phosphorus-31 MRS of the kidney. Invest Radiol 1989; 24: pp. 993-996.
3. Tosi M.R., Bottura G., Lucchi P., et. al.: Cholesteryl esters in human malignant neoplasms. Int J Mol Med 2003; 11: pp. 95-98.
4. Tugnoli V., Bottura G., Fini G., et. al.: 1H-NMR and 13C-NMR lipid profiles of human renal tissues. Biopolymers 2003; 72: pp. 86-95.
5. Tosi M.R., Rodriguez-Estrada M.T., Lercker G., et. al.: Magnetic resonance spectroscopy and chromatographic methods identify altered lipid composition in human renal neoplasms. Int J Mol Med 2004; 14: pp. 93-100.
6. Katz-Brull R., Rofsky N.M., Lenkinski R.E.: Breathhold abdominal and thoracic proton MR spectroscopy at 3T. Magn Reson Med 2003; 50: pp. 461-467.
7. Li C.W., Kuo Y.C., Chen C.Y., et. al.: Quantification of choline compounds in human hepatic tumors by proton MR spectroscopy at 3 T. Magn Reson Med 2005; 53: pp. 770-776.
8. Fischbach F., Bruhn H.: Assessment of in vivo 1H magnetic resonance spectroscopy in the liver: a review. Liver Int 2008; 28: pp. 297-307.
9. Starcuk Z., Starcuk Z., Mlynarik V., et. al.: Low-power water suppression by hyperbolic secant pulses with controlled offsets and delays (WASHCODE). J Magn Reson 2001; 152: pp. 168-178.
10. Bruhn H., Frahm J., Gyngell M.L., et. al.: Noninvasive differentiation of tumors with use of localized H-1 MR spectroscopy in vivo: initial experience in patients with cerebral tumors. Radiology 1989; 172: pp. 541-548.
11. Smith J.K., Kwock L., Castillo M.: Effects of contrast material on single-volume proton MR spectroscopy. AJNR Am J Neuroradiol 2000; 21: pp. 1084-1089.
12. Joe B.N., Chen V.Y., Salibi N., et. al.: Evaluation of 1H-magnetic resonance spectroscopy of breast cancer pre- and postgadolinium administration. Invest Radiol 2005; 40: pp. 405-411.
13. Fischbach F., Schirmer T., Thormann M., et. al.: Quantitative proton magnetic resonance spectroscopy of the normal liver and malignant hepatic lesions at 3.0 tesla. Eur Radiol 2008; 18: pp. 2549-2558.
14. Lin A.P., Ross B.D.: Short-echo time proton MR spectroscopy in the presence of gadolinium. J Comput Assist Tomogr 2001; 25: pp. 705-712.
15. Madhu B., Robinson S.P., Howe F.A., et. al.: Effect of Gd-DTPA-BMA on choline signals of HT29 tumors detected by in vivo 1H MRS. J Magn Reson Imaging 2008; 28: pp. 1201-1208.
16. de Graaf R.A., Brown P.B., McIntyre S., et. al.: Dynamic shim updating (DSU) for multislice signal acquisition. Magn Reson Med 2003; 49: pp. 409-416.
17. Stanwell P., Russell P., Carter J., et. al.: Evaluation of ovarian tumors by proton magnetic resonance spectroscopy at three tesla. Invest Radiol 2008; 43: pp. 745-751.
18. Kreis R.: Issues of spectral quality in clinical 1H-magnetic resonance spectroscopy and a gallery of artifacts. NMR Biomed 2004; 17: pp. 361-381.
19. Males R.G., Vigneron D.B., Star-Lack J., et. al.: Clinical application of BASING and spectral/spatial water and lipid suppression pulses for prostate cancer staging and localization by in vivo 3D 1H magnetic resonance spectroscopic imaging. Magn Reson Med 2000; 43: pp. 17-22.
20. Felix R., Schorner W., Laniado M., et. al.: Contrast media in magnetic resonance tomography. A review. 2. Biological basis, research technique and clinical application of gadolinium-DTPA in the diagnosis of intracranial tumors [article in German]. Rofo 1985; 143: pp. 9-14.
21. Yamada S., Kubota R., Yamada K., et. al.: T1 and T2 relaxation times on gadolinium-diethylenetriaminepentaacetic acid enhanced magnetic resonance images of brain tumors. Tohoku J Exp Med 1990; 160: pp. 145-148.